INITIATING COVERAGE REPORT
←
→
Page content transcription
If your browser does not render page correctly, please read the page content below
INITIATING COVERAGE REPORT
Market Cap.                         52 Week H/L                        CMP                        Target Price
  Eicher Motors Ltd.                           Rs. 58,382 Cr.                    Rs. 23,428/12,460                 Rs.21,381                        Rs. 28,681
                                     Recovery post Covid-19 to drive demand for private vehicles, especially for 2-wheelers
                                     The Coronavirus Pandemic has led to people spending on protective gear and hygiene products like never before. An
                                     important aspect of everyone’s day to day life is travelling, either for work or personal reasons. The need to maintain social
                                     distancing and this newfound focus on hygiene will lead to increased demand for private vehicles, especially in densely
                                     populated cities. Due to traffic concerns and the need for more than one vehicle in a household, we expect people to prefer
                                     2-wheelers over cars.
                                     Best managed the BS VI transition, strategic initiatives to drive commercial vehicle market share growth
                                     Eicher Motors was one of the first companies to clear all of its BS IV inventory and to launch its BS VI line of products. The
                                     company has revamped its Trucks and Buses with modern features and has leveraged its experience of manufacturing EURO
                                     6 engines for many years. These new products are well poised to help Eicher compete for market share in the CV industry.
                                     Expanding distribution network- both domestically and internationally
                                     Royal Enfield has seen a strong growth over the years led by its robust distribution network, which the company keeps on
                                     expanding. This year, the company adopted a strategy to open Studio Stores to deepen its reach in the tier 2&3 cities.
                                     Internationally, the company is steadily expanding its sales network to meet the growing demands.
                                     Capitalizing on its cult like community by investing in unique branding initiatives
                                     Royal Enfield has a community of riders who indulge in much more than just buy and ride a bike. They go on adventures,
                                     customize their bikes and wear the brand’s apparel. The company invests regularly in nurturing this community which helps
                                     distinguish the brand from its competitors.

                                                                                  OUTLOOK & VALUATION
                                       We expect a decline in revenue of ~41% YoY for FY21E, due to the pandemic caused slump mainly in the first half
                                      of the year. Thereafter, we expect a slow recovery for the rest of the year and in FY22E, followed by better
                                      demand in FY23E. We expect FY23E revenue to be Rs.12,907.21 Cr, growing at 12.1% CAGR over FY20-23E. We
                                      expect FY23E EPS at Rs. 1195.06. Assigning a PE multiple of 24x, we arrive at a Price Target of Rs. 28,681, which is
                                      an upside of ~34% from yesterday’s closing price of Rs. 21,381. We initiate coverage on Eicher Motors with a BUY
                                      rating, over an investment horizon of 24-30 months.

        RESEARCH ASSOCIATE                            Revenue         EBITDA            PAT          NPM          REPS          P/E           P/S          P/BV
                                     Y/E Mar
                                                       (Rs. Cr)       (Rs. Cr)        (Rs. Cr)        (%)         (Rs.)         (x)           (x)           (x)
Dhruvin Upadhyay| +91 22 4093 4082
Dhruvin.Upadhyay@sushilfinance.com   FY20               9,154          2,180           1,827         20%         669.5          31.9         2.34           5.8
              SALES:                 FY21E              5,401           814             769          14%         281.7          75.9         3.96           5.6
 Devang Shah | +91 22 4093 6060/61   FY22E              9,951          2,576           2,209         22%         809.1          26.4         2.15           4.8
  devang.shah@sushilfinance.com      FY23E             12,907          3,850           3,263         25%        1,195.1         17.9         1.66           3.9

July 30, 2020                                              Please refer to the disclosure on last page                                                            2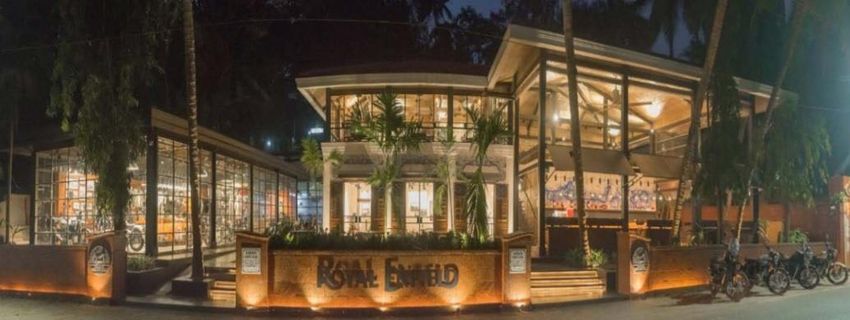
Eicher Motors Ltd.

INVESTMENT RATIONALE
                          “Recovery post Covid-19 to drive demand for private vehicles, especially for 2-Wheelers”

 The Coronavirus Pandemic has seen the world come to a standstill. People are scared to venture outside, are spending more than ever on hygiene
 and protective gear and have drastically changed their way of life. With gradual unlocking of restrictions and resumption of economic activities,
 people are focusing on how they can get about their business in the safest way possible. One of the most talked about points is the shift to
 personal mobility from shared and public mobility. The need to maintain social distancing and hygiene is bringing about this change.

 This will benefit small car manufacturers and 2-wheeler manufacturers as people scramble to get their hands on a private vehicle. Due to subdued
 consumer sentiment and factors like affordability, need for more than one vehicle in the household and traffic congestion concerns, we believe
 the preference will be higher for 2-wheelers. The sales figures for the first quarter of FY21E of the listed 2-wheeler manufacturers in India are as
 follows:

 Sales (units)              April          May            June     As we can see, all 2-wheeler OEMs have seen rapid increase in sales since the
 Royal Enfield                 91         19,113        38,065     reopening of most manufacturing and sales facilities after a lockdown in April and
 % growth                      NA        20903%           99%      some days of May.
 Bajaj Auto                32,009       1,12,798      2,55,122
                                                                   The volumes have also experienced tailwinds like pent up demand due to BS VI
 % growth                      NA          252%          126%
                                                                   driven up gradation. While headwinds like slowdown in economic activity has
 Hero Motocorp                  -       1,12,682      4,50,744     impacted demand for Premium Motorcycles (RE & Bajaj Auto), Economy Bikes and
 % growth                      NA             NA         300%      Scooters have recovered quickly in Q1FY21E as rural demand (driver for economy
 TVS Motor Co               8,134         56,218      1,91,076     bikes) was less affected by the pandemic as compared to the urban areas.
 % growth                     NA           591%          240%

 However, we believe that premium bikes will also see a swift recovery in volumes driven by demand from the urban working class population.
 The price sensitivity between Economy and Premium bikes is lesser in the urban areas due to better affordability and easy access to financing and
 consumers have a preference for performance over mere utility. The choice for urban consumers will be between a small car and a premium
 motorcycle, and we believe that concerns over traffic issues in most cities of India will steer the consumers towards 2-wheelers. The narrowing of
 price differences between Economy and Premium motorcycles since the introduction of BS VI models makes premium bikes more lucrative. Royal
 Enfield being the market leader in the 250cc+ premium motorcycle segment, with a 96% market share in the 250cc to 750cc motorcycles
 segment, is best positioned to benefit from this new surge in demand.
 Source: Company, Corporate Filings-BSE, Sushil Finance Research

July 30, 2020                                                                                                                                           3
Eicher Motors Ltd.

INVESTMENT RATIONALE
                “Best managed the BS VI transition, strategic initiatives to drive commercial vehicle market share growth”

 Eicher Motors’ Royal Enfield was one of the first companies to clear all of its BS IV inventory before 31st March 2020. RE was one of the first OEMs
 to completely sell off all of their BS IV inventory without any additional incentives. The company also successfully migrated its lineup to the BS VI
 models well before April 1st 2020. More than 60% of the sales during Q4FY20 were BS VI models.

 On the Commercial Vehicles (CE) side, the company has years of experience in manufacturing engines under EURO 6 norms for Volvo globally. The
 company used this knowledge and understanding of the technology to develop their BS VI solutions EUTECH 6 for their entire portfolio ranging
 from 4.9 tonnes to 55 tonnes. The company was able to liquidate its entire inventory of BS IV commercial vehicles optimally and was one of the
 first companies in the commercial vehicles industry to migrate to BS VI norms.

 Eicher's commercial vehicles enjoy a 29.5% market share in India’s light and medium duty (3.5 to 15 tonnes) CV segment, making them the
 market leaders. Their trucks and buses are known for their best in class fuel efficiency, superior uptime and modern industry first features for
 driving productivity and profitability.

 Volvo Eicher Commercial Vehicles (VECV) in line with their vision to modernize the commercial transportation, has introduced the Pro 2000 series
 in the light and medium duty vehicles. These vehicles set net industry benchmarks for industry first features in enhanced reliability, safety,
 comfort and efficiency. The company developed two new engines indigenously (2L and 3L engines) along with contemporary style cabins in 1.8
 meter and 2 meter. The company introduced several new state of the art features in their trucks and buses like all wheel disk brakes,
 infotainment systems, steering mounted buttons, advanced telematics, etc. The company also set up the ‘Uptime Centre’, a first of its kind
 initiative in the industry. These centres operate 24*7 and can provide remote diagnostics services and real time support to on-ground technicians
 by logging into any truck at the dealer workshop or via roadside assistance support team.

 VECV has not just upgraded its engines to comply with the BS VI norms, but has revamped and modernized its entire lineup to offer the best
 features and performance in their trucks and buses. Their grip on the technology that goes into BS VI engines also gives them an edge. While the
 Commercial Vehicles industry is marred with problems like lack of availability of financing, axel load norms and the transition to BS VI norms,
 Eicher has proactively positioned its offerings as a complete technologically advanced package and we believe it will help them strengthen their
 stronghold on the market share in the commercial vehicles industry.

 Source: Company, Sushil Finance Research

July 30, 2020                                                                                                                                            4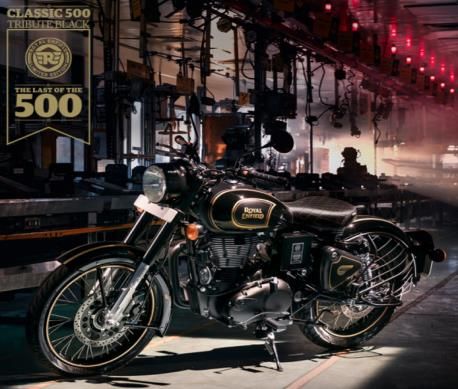
Eicher Motors Ltd.

INVESTMENT RATIONALE
                              “Expanding distribution network- both domestically and internationally” –(1/2)

 Royal Enfield’s dealership network is based on a strong platform of consistently growing stores across the country. The company’s large format
 stores have grown from 527 in FY16 to 921 in FY20, a growth of ~75%. In FY20, to capture the young audience from small towns (tier2,3&4),
 Eicher Motors adopted a strategy to open smaller, more compact Studio stores in these towns. During FY20, the company opened 600 studio
 stores across India and plans to add another 600 in FY21. The 1521 stores (921 large format and 600 studio) are distributed across India as
 follows:
                         Region         Large Format   Studio Store           City Category*                                Store Count
                         North                281           210               >1,000                                                202
                         South                287           139               Between 200 and 1,000                                 294
                         East                 169           143               Upto 200                                              425
                         West                 184           108               Studio Stores                                         600
                         Total                921           600               Total                                               1,521
                                                                              * Industry volume of >125cc engine size motorcycles per month

 Studio Stores: These are stores set up in a compact ~500 square feet area as compared to a large store which is ~2000 square feet. The area is
 distributed among sales and service (~225 + 275) sq.ft respectively. Eicher has strategically opened over 300 stores in locations of UP, MP,
 Rajasthan, Odisha, Bihar, Andhra Pradesh, West Bengal where Royal Enfield’s market share is lower than its India average.

 The studio stores offer the following benefits to the Royal Enfield stakeholders:
 • Studio stores are much smaller than large format stores, making it a lot more attractive for dealers to branch out in their nearby small towns.
   The investment is also affordable and operating costs are also low, dealers can break even by selling just 7-8 bikes in a month.
 • From the customer point of view, the studio stores offer the ease of purchasing and servicing their motorcycle without having to go to a main
   city to get it done. The small town/rural customer has the comfort and assurance of getting his bike serviced at an authorized dealer in
   his/her own town.
 • From the company’s perspective, the studio stores give Royal Enfield good brand visibility and customer outreach.

 We believe this strategy of adding studio stores to expand the distribution network will help Royal Enfield capture an audience with the rural and
 small town demographic. This is important for the company to grow its market share in the world’s largest motorcycle market with a largely
 young population.

 Source: Company, Sushil Finance Research

July 30, 2020                                                                                                                                         5
Eicher Motors Ltd.
INVESTMENT RATIONALE
“Expanding distribution network- both domestically and internationally” –(2/2)
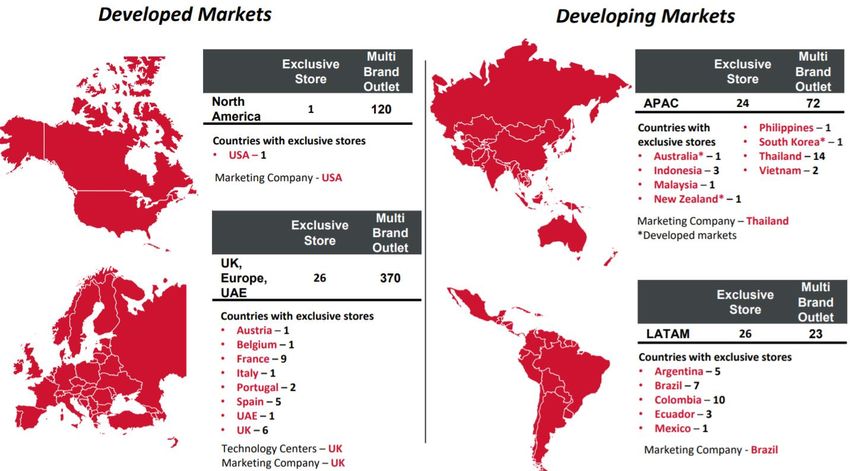
Coming to the International Business, Royal Enfield eyes to lead and grow the mid-sized motorcycle segment, which is under-served globally. In
developed markets, Leisure motorcycles (>750cc engine size) dominate the market share, while in developing markets, Commuter motorcycles
(
Eicher Motors Ltd.
INVESTMENT RATIONALE
“Capitalizing on its cult like community by investing in unique branding initiatives” –(1/2)
No other motorcycle brand in the world, perhaps with the exception of Harley Davidson, enjoys a cult like following from motorcycle enthusiasts
like Royal Enfield does. Customers don’t just buy the motorcycle for commuting purposes-they go on long adventurous trips across the country
with fellow RE motorcyclists, they customize their motorcycles to their own unique taste, they buy apparel branded with the RE logos and stories,
and they share their experiences and adventures with the massive Royal Enfield community online. All this makes owning and riding a Royal
Enfield motorcycle much more exciting and a matter of pride for the riders. The company recognizes this and has taken numerous initiatives to
support and grow this community. These brand building activities inculcate a sense of belonging and pride among the motorcycle enthusiasts
which creates a loyal customer base for Royal Enfield.
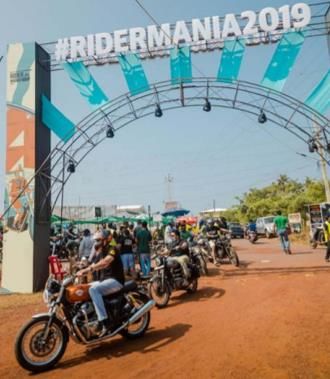
Royal Enfield organised events like ‘Rider Mania’- which is their most definitive motorcycle festival and the largest gathering of RE enthusiasts,
saw 8,000 participants and the launch of the Slide School- RE’s efforts to bring back flat-track racing culture. 2019 saw the 16th edition of the
Himalayan Odyssey where 60 motorcyclists rode for 15 days to Khardung-La pass, the highest motorable road in the world. The company uses
these trips to promote environmental sustainability, like on the Himalayan Odyssey riders said no to single use plastics and instead used RE
installed water purifiers for public use.
The 3rd picture showcases the Astral Ride, the first of its kind ride that combined astro-photography with motorcycle riding in the Himalayas. The
4th picture is from the RE Himalayan Adventure Rongbuk, a first of its kind expedition to take riders to the base camp of Mount Everest. The last
picture is from the 3rd edition of the Tour of Thailand, this was an exclusive all twins ride with riders from Thailand, media personnel and Indian
riders.
Source: Company, Sushil Finance Research
July 30, 2020 7
Eicher Motors Ltd.

 INVESTMENT RATIONALE
                           “Capitalizing on its cult like community by investing in unique branding initiatives” –(2/2)

                                      Royal Enfield phased out their over a
                                      decade old Unit Construction Engine
                                      (UCE)     500cc    single    cylinder
                                      motorcycle with a commemorative
                                      end of production limited edition
                                      motorcycle “Classic 500 Tribute
                                      Black” the company sold over 300
                                      motorcycles online within 180            Above are pictures from Royal Enfield’s showrooms from Milan,
                                      minutes.                                 New Delhi and China, showcasing how they use their showrooms
                                                                               to create an appeal for their merchandise and apparel.

                                                                                                            These are some examples of the
                                                                                                            apparel and merchandise that
                                                                                                            customers can avail from a
 The above picture is from Royal Enfield Garage Café, Goa- RE’s first. The                                  customization and personalization
 café is an inclusive and engaging space that is deigned to be a catalyst to                                portfolio of over 120 products. To
 deepen closer association with riding enthusiasts and customers. The                                       the left is Royal Enfield’s make
 garage café is a massive 120 seater café and also has a Royal Enfield                                      your own digital configuration
 motorcycle museum and exhibition area, an exclusive gear store,                                            service, where customers can
 customization are and a service bay.                                                                       customize their motorcycle on an
                                                                                                            in-store tablet and place their
Source: Company, Sushil Finance Research
                                                                                                            order.

 July 30, 2020                                                                                                                                   8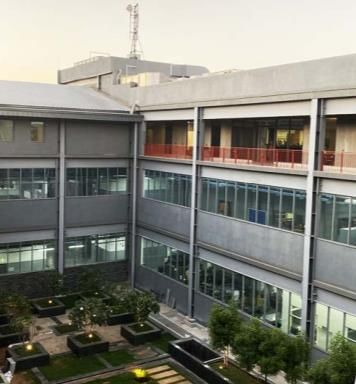
Eicher Motors Ltd.

 COMPANY OVERVIEW
  Eicher Motors Limited (EML) is the owner of the iconic Royal Enfield brand. A global leader in the mid-sized motorcycle segment, Royal Enfield is
  the oldest motorcycle brand in continuous production since 1901. With its distinctive range of simple yet engaging and accessible motorcycles,
  exhilarating community riding events and an ecosystem that introduces customers to the world of pure motorcycling, Royal Enfield has evolved
  into an experiential brand. Royal Enfield with its motorcycle that combines modern day elements with the brand’s heritage, garners immense
  enthusiasm amongst global motorcyclists. It has modern product development centres at Leicestershire, UK and Chennai, India where an expert
  technical team conceptualizes next-generation motorcycles. This is supported by its three state-of-the-art manufacturing facilities around
  Chennai where these machines are handcrafted to perfection.

  EML’s joint venture VE Commercial Vehicles (VECV) with Sweden’s AB Volvo, is one of India’s leading manufacturer of trucks, buses, engines and
  engineering components. With a wide range of new-generation trucks and buses, VECV is driving modernization in commercial transportation in
  India and the developing world. The Eicher Trucks and Buses range includes 4.9 to 55 tonne trucks and 12 to 62 seater buses. VE Power Train
  (VEPT) is a global hub for medium duty engines for the Volvo Group and has been engaged in supply of base engines for Euro VI requirements of
  the Volvo Group since 2013.

                 2                         3                         60                         921                          600
         Technology                  Manufacturing                Countries                 Full Stores in                  Studio
           Centres                     Facilities                  Retail                        India                     Stores in
                                                                  Network                                                    India

                              3                      585                           77                        1521
                       Fully-owned                Multi brand                  Exclusive                      Touch
                       Subsidiaries                outlets                      Stores                       Points in
                                                   Abroad                       Abroad                         India

Source: Company, Sushil Finance Research

 July 30, 2020                                                                                                                                        9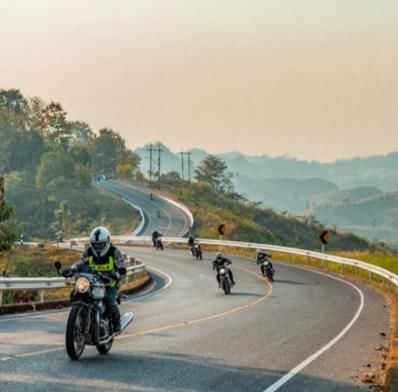
Eicher Motors Ltd.

 BUSINESS OVERVIEW
                                           Eicher Motors Limited
                                                   (EML)

                                                                     Volvo Eicher Commercial
    Royal Enfield Motorcycles
                                                                         Vehicles (VECV)

                                                                   Eicher Motors    Volvo Group
                                                                       54.4%           45.6%

Source: Company, Sushil Finance Research

 July 30, 2020                                                                                    10
Eicher Motors Ltd.
BUSINESS OVERVIEW- Royal Enfield: Prices & Market Share
Models Price Rs. (ex-showroom avg.) Royal Enfield’s motorcycles are known for their classic retro designs and simple but
RE Classic 350 1,59,824 robust construction. Their bikes are also quite affordable as seen in the table.
RE Bullet 350 1,24,311 The most expensive bike in their portfolio, the Continental GT 650 costs under Rs. 3
RE Thunderbird 350 1,56,496 lakhs, while a typical 650cc motorcycle from any other manufacturer would cost
RE Thunderbird 350X 1,63,842 anywhere between Rs. 6 to 10 lakhs.
RE Himalayan 1,89,538 This price advantage is mainly due to Royal Enfield’s ability to manufacture these
motorcycles almost entirely in India, while the other 650cc bikes come from foreign
RE Interceptor 650 2,64,884
manufacturers like Suzuki, Honda, Kawasaki, Benelli to name a few.
RE Continental GT 650 2,80,677
24.9%
20.6%
15.1% Royal Enfield’s market share in all 5.9%
9.5% motorcycles sold in India.
6.6% 7.6% 8.3%
-1.8% -2.1%
FY15 FY16 FY17 FY18 FY19 FY20
-8.0% Royal Enfield’s market share in 125cc+
motorcycles.
26.6%
Up to 125cc Above 125cc -16.0%
Growth rate of various motorcycle segments
-23.0%
The Premiumization theme in the motorcycle market is expected to
continue led by India’s favourable demographic (young population) Royal Enfield’s market share in 250cc+
and the rising disposable income that they enjoy. Royal Enfield being motorcycles.
96.0%
a dominant player in the Premium bikes segment, has positioned
itself well to capture this demand.
Source: Company, Sushil Finance Research
July 30, 2020 11Eicher Motors Ltd.
BUSINESS OVERVIEW- Royal Enfield: Volumes & Capacity Expansion
Royal Enfield’s monthly volumes show
80,000 77,878 how the company’s products have been
70,000 60,831 gaining popularity in the recent past, and
60,000 the chart below shows how the company
50,000 has managed to ramp up its capacity to
40,000 meet this rising demand.
30,000 24,106 The company has increased its capacity 10
times over 2012-2020 by adding phases to
20,000
its 3 manufacturing facilities. The recent
10,000
addition of Phase-2 at Vallam Vadagal has
Oct/14
Oct/15
Oct/16
Oct/17
Oct/18
Oct/19
Jan/15
Jan/16
Jan/17
Jan/18
Jan/19
Jan/20
Jul/14
Jul/15
Jul/16
Jul/17
Jul/18
Jul/19
Apr/14
Apr/15
Apr/16
Apr/17
Apr/18
Apr/19
increased the company’s annual capacity
to 1.2 million motorcycles.
Monthly Volumes
2012 2014 2016 2018
183,000 420,000 825,000 1,200,000
Motorcycles Motorcycles Motorcycles Motorcycles
120,000 310,000 670,000 900,000
Motorcycles Motorcycles Motorcycles Motorcycles
2013 2015 2017 2020
Source: Company, Sushil Finance Research
July 30, 2020 12Eicher Motors Ltd.
BUSINESS OVERVIEW- Nothing Outdated about the Oldest Motorcycle brand in continuous production
Royal Enfield has set up 2 technology centres, one in the UK and the other in India
over the past two years. The UK facility is a state-of-the-art Technology Centre
situated at Bruntingthorpe, Leicestershire, within the grounds of ‘Bruntingthorpe
Proving Ground’, one of the largest vehicle test track facilities in the UK. The facility
is set up over 36,00 square feet and houses a fully equipped industrial design
studio, development workshop, engine test facility and engineering office. The team
consists of 160 engineers and designers from all around the world working on new
motorcycles and accessories.
The Indian Technology Centre was commissioned in FY20. The facility is set up in
Chennai, and houses engineering and design teams under one roof. The facility has
a dedicated prototyping facility and state-of-the-art engine, chassis and component The Technology Centre at Bruntingthorpe, UK
test equipment. The design studio has best in class facilities for clay and digital
modelling. There’s also a new hemi-anechoic chamber to aid develop the famous
Royal Enfield exhaust note for future models. The in-house Climate Chassis Test cell
allows a simulation of various temperature conditions for optimal drivability.
These in-house facilities at the Technology Centres are world class and enable Royal
Enfield to take full ownership of all aspects of motorcycle design and development,
reducing the dependence on third party contractors. This helps make a much better
motorcycle and keeps costs low.
The most recent products from these Technology Centres, the Interceptor and
Continental GT, also known as the 650 Twins have been a huge hit among riders
from around the world. The models have won numerous awards and accolades
from reviewers and magazines worldwide.
The Technology Centre at Chennai, India
Source: Company, Sushil Finance Research
July 30, 2020 13Eicher Motors Ltd.
BUSINESS OVERVIEW- Volvo Eicher Commercial Vehicles (VECV): Volumes Overview
80,000 40,000 14,000
70,000 35,000 12,000
60,000 30,000 10,000
50,000 25,000
8,000
40,000 20,000
6,000
30,000 15,000
58,604
65,932
72,969
48,721
26,027
33,010
37,706
26,707
11,109
12,372
13,281
4,000
7,279
20,000 10,000
10,000 5,000 2,000
- - -
FY17 FY18 FY19 FY20 FY17 FY18 FY19 FY20 FY17 FY18 FY19 FY20
Total Volumes Eicher LMD Trucks (3.5 to 15 tonne) Eicher HD Trucks (16+ tonne)
14,000 12,000 1,250
12,000 10,000 1,200
10,000
8,000 1,150
8,000
6,000 1,100
6,000
12,270
10,494
10,746
10,010
4,000 1,050
4,000
9,060
8,035
9,001
4,568
1,163
1,055
1,226
1,107
2,000 2,000 1,000
- - 950
FY17 FY18 FY19 FY20 FY17 FY18 FY19 FY20 FY17 FY18 FY19 FY20
Buses Exports Volvo Trucks
Source: Company, Sushil Finance Research
July 30, 2020 14Eicher Motors Ltd.
BUSINESS OVERVIEW- Volvo Eicher Commercial Vehicles (VECV): Market Share Overview
5.5% 32.0% 31.5%
31.3%
5.1% 31.5%
4.9% 31.0%
5.0% 30.5%
4.6% 30.0% 29.5%
4.5% 29.4%
4.5% 29.5%
29.0%
28.5%
4.0% 28.0%
FY17 FY18 FY19 FY20 FY17 FY18 FY19 FY20
Eicher HD Trucks Domestic Market Share Eicher LMD Trucks Market Share
20.0% 16.8% 17.0% 15.0% 14.6%
15.6%
14.1% 14.5%
15.0%
14.0%
13.3% 13.3%
10.0% 13.5% 13.1%
13.0%
5.0%
12.5%
0.0% 12.0%
FY17 FY18 FY19 FY20 FY17 FY18 FY19 FY20
Eicher Domestic Buses Market Share VECV Market share (including exports)
Source: Company, Sushil Finance Research
July 30, 2020 15Eicher Motors Ltd.
BUSINESS OVERVIEW
14,000.0 12,907.2 4,500.0 35.0%
29.6% 29.8%
12,000.0 4,000.0 30.0%
25.9%
9,797.1 9,951.0 3,500.0 23.8%
10,000.0 9,153.6 25.0%
3,000.0
8,000.0 2,500.0 20.0%
15.1%
6,000.0 5,401.2 2,000.0 15.0%
4,000.0 1,500.0
10.0%
2,903.1
2,180.4
2,576.2
3,849.8
1,000.0
2,000.0 5.0%
500.0 814.1
- - 0.0%
FY19 FY20 FY21E FY22E FY23E FY19 FY20 FY21E FY22E FY23E
Revenue EBITDA (Rs. Cr) EBITDA Margin (%)
30.0% 28.0%
3,500.0 30.0%
25.3%
25.0% 21.5%
24.7% 3,000.0 22.5% 22.2% 25.0%
18.3% 18.0% 20.0%
20.0% 2,500.0
21.9% 20.0%
15.0% 17.3% 2,000.0 14.2%
17.1%
15.0%
10.0% 7.4% 1,500.0
10.0%
5.0% 1,000.0
2,202.7
1,827.4
2,208.7
3,262.5
5.0%
769.1
0.0% 3.8% 500.0
FY19 FY20 FY21E FY22E FY23E - 0.0%
FY19 FY20 FY21E FY22E FY23E
ROE ROCE
PAT (Rs. Cr) PAT Margin (%)
Source: Company, Sushil Finance Research
July 30, 2020 16Eicher Motors Ltd.
RECENT QUARTER
For the quarter ended March 31, 2020, Eicher Particulars (Rs. Cr) Q4FY20 Q4FY19 YoY Q3FY20 QoQ
Motors’ total revenue from operations was Revenue 2,208 2,500 -12% 2,371 -7%
recorded at Rs. 2,208 Cr, down by 12% YoY as Cost of Goods Sold 1,244 1,335 -7% 1,290 -4%
compared to Rs. 2,500 Cr in the corresponding Employee Benefit Expenses 214 171 25% 185 16%
quarter of FY18-19. Other Expenses 319 310 3% 304 5%
EBITDA 432 685 -37% 592 -27%
EBITDA was Rs. 432 Cr, down 37% as compared to
Rs. 685 Cr in the same quarter of the previous EBITDA margin 19.6% 27.4% -781 Bps 25.0% -541 Bps
financial year. The EBITDA margin stood at 19.6% Depreciation 109 81 34% 95 14%
for the quarter. Interest expense 6 2 158% 4 30%
PBT 447 820 -45% 644 -31%
Profit After Tax was Rs. 304 Cr as compared to Rs. PBT margin 20.2% 32.8% -1255 Bps 27.2% -693 Bps
545 Cr during the same period last year, down by Tax expense 143 275 -48% 145 -2%
44% YoY. The EPS for the quarter was Rs. 111.46.
PAT 304 545 -44% 499 -39%
PAT margin 13.8% 21.8% -801 Bps 21.0% -725 Bps
EPS 111.46 199.72 -44% 182.67 -39%
Source: Company, Sushil Finance Research
July 30, 2020 17Eicher Motors Ltd.
Profit & Loss Statement (Rs. Cr) Balance Sheet Statement (Rs. Cr)
Y/E Mar. FY20 FY21E FY22E FY23E Y/E Mar. FY20 FY21E FY22E FY23E
Revenue 9,154 5,401 9,951 12,907 PP&E (incl. CWIP) 2,029 2,030 2,120 2,204
Raw Material Cost 4,996 3,033 5,330 6,745 Other Non-Current assets 4,047 4,595 5,460 6,690
Employee Cost 796 876 947 993
Inventories 572 506 666 749
Other Expenses 1,182 678 1,097 1,320
Trade Receivables 87 180 95 117
EBITDA 2,180 814 2,576 3,850
Cash and Bank Balances 2,951 3,267 3,518 3,938
EBITDA Margin (%) 23.8% 15.1% 25.9% 29.8%
Other Current Assets 2,765 2,009 3,275 4,480
Depreciation 382 403 408 432
Total Assets 12,450 12,587 15,135 18,178
EBIT 1,799 411 2,168 3,418
Equity Share Capital 27 27 27 27
EBIT Margin (%) 19.7% 7.6% 21.8% 26.5%
Reserves & Surplus 9,954 10,382 12,235 15,116
Finance Costs 19 11 20 26
Borrowings (LT & ST) 144 135 149 129
Other Income 543 594 665 738
Other Non-Current Liabilities 444 451 444 450
Share of Profits from JV 32 31 132 220
Trade Payables 1,028 632 1,211 1,349
Profit before Tax 2,355 1,026 2,945 4,350
Tax Expense 527 256 736 1,088 Other Financial Liabilities 167 170 172 173
Net Profit 1,827 769 2,209 3,263 Other Current Liabilities 519 624 730 768
Net Margin (%) 20.0% 14.2% 22.2% 25.3% Current Tax Liab & Provisions 166 166 166 166
EPS 669.5 281.7 809.1 1,195.1 Total Liabilities 12,450 12,587 15,135 18,178
Source: Company, Sushil Finance Research
July 30, 2020 18Eicher Motors Ltd.
Cash Flow Statement (Rs. Cr) Financial Ratio Statement
Y/E Mar. FY20 FY21E FY22E FY23E Y/E Mar. FY20 FY21E FY22E FY23E
PBT 2,355 1,026 2,945 4,350 Growth (%)
Depreciation 382 403 408 432 Revenue -6.6% -41.0% 84.2% 29.7%
Interest 19 11 20 26
EBITDA -24.9% -62.7% 216.5% 49.4%
CFO before Working Cap chg 2,755 1,440 3,373 4,808
Net Profit -17.0% -57.9% 187.2% 47.7%
Chg in Inventories 61 67 (161) (83)
Chg in Investments (2,044) 757 (1,230) (1,145) Profitability (%)
Chg in Trade Receivables (2) (93) 85 (23) EBITDA Margin 23.8% 15.1% 25.9% 29.8%
Chg in Other Current Assets 19 (1) (37) (59) Net Profit Margin 20.0% 14.2% 22.2% 25.3%
Chg in Short term Borrowings (42) (9) 14 (20) ROCE 17.3% 3.8% 17.1% 21.9%
Chg in Trade Payables (206) (396) 580 137
ROE 18.3% 7.4% 18.0% 21.5%
Chg in Other Fin Liabilities 4 3 2 1 Per Share Data (Rs.)
Chg in Other Current Liabilities (88) 105 105 39
EPS 670 282 809 1,195
Income Taxes Paid (527) (256) (736) (1,088)
BVPS 3,656 3,813 4,492 5,547
Other Adjustments 1,514 - - -
Valuation (x)
Cash Flow from Operations 1,694 1,616 1,995 2,568
Chg in Other Non-current P/E 31.9 75.9 26.4 17.9
Liabilities 20 7 (7) 6 P/BV 5.8 5.6 4.8 3.9
Interest Paid (19) (11) (20) (26) EV/EBITDA 26.8 71.4 22.5 14.9
Dividend Paid (341) (341) (355) (382)
P/SALES 2.34 3.96 2.15 1.66
Other Adjustments (572) - - -
Turnover
Cash Flow from Financing (858) (345) (382) (402)
Capital Expenditure (446) (405) (498) (516) Inventory days 42 61 46 41
Investments 1,166 (546) (796) (1,185) Debtor days 3 12 3 3
Other Non-Current Assets 69 (2) (68) (44) Creditor days 75 76 83 73
Other Adjustments (2,023) - - -
Gearing Ratio
Cash Flow from Investing (1,508) (954) (1,362) (1,746)
Debt/Equity 0.02 0.01 0.01 0.01
Opening Cash 727 43 360 611
Total Cash Flow (673) 317 251 420 Free Cash Flow to the Firm 127 1,295 1,650 2,057
Closing Cash 54 360 611 1,031 Free Cash Flow to Equity 84 960 1,398 1,598
Source: Company, Sushil Finance Research
July 30, 2020 1910
15
20
25
35
30
0
5
0
10000
15000
20000
25000
30000
35000
40000
45000
5000
01/07/2016
Jul/16 01/10/2016
Oct/16 01/01/2017
July 30, 2020
Jan/17 01/04/2017
Apr/17 01/07/2017
Jul/17 01/10/2017
Oct/17 01/01/2018
Jan/18 01/04/2018
Apr/18
Close -Unit Curr
MARKET INFORMATION
01/07/2018
Source: Company, Sushil Finance Research
Jul/18 01/10/2018
EV/EBITDA
Oct/18 01/01/2019
Jan/19 01/04/2019
Apr/19 01/07/2019
Jul/19
BSE Sensex
01/10/2019
Oct/19 01/01/2020
Jan/20 01/04/2020
Apr/20 01/07/2020
Jul/20
10
20
30
40
50
60
0
01/07/2016
01/10/2016
01/01/2017
01/04/2017
01/07/2017
01/10/2017
01/01/2018
01/04/2018
01/07/2018
01/10/2018
01/01/2019
Price/Earning
01/04/2019
01/07/2019
01/10/2019
01/01/2020
Eicher Motors Ltd.
01/04/2020
01/07/2020
20Eicher Motors Ltd.
OUTLOOK & VALUATION
Eicher Motors Ltd. Is one of India’s largest Automobile companies. Their brand Royal Enfield is the market leader in the mid-sized (250cc to
750cc) motorcycle segment. The company’s Joint Venture with the Volvo Group, Volvo Eicher Commercial Vehicles (VECV) manufactures
trucks and buses under the Eicher brand, and also some Trucks under the Volvo Brand. The company has a vision to lead the mid-sized
motorcycle market globally, and with its trucks and buses-to revolutionize the Indian commercial vehicles segment with technologically
equipped vehicles like never seen before.
The company sits on a strong balance sheet, with no debt and ample cash on its books. The management’s operational capabilities are
showcased by the rich margins that the business has sustained despite the motorcycles being some of the most affordable ones on the
road.
The Coronavirus Pandemic has impacted the business of Eicher Motors, as it has all other businesses and industries around the globe. The
company has lost days in the months of April and May due to the lockdown, and the overall sales for FY21E are expected to decline. The
company might take a hit on its margins and profitability this fiscal, however, given its strong balance sheet, we expect the company to ride
these difficult roads rather comfortably. We expect the demand for 2-wheelers to recover rather quickly driven by the need for social
distancing and preference for private vehicles to shared and public mobility in the post-Covid scenario.
We expect a decline in revenue of ~41% YoY for FY21E, due to the pandemic caused slump mainly in the first half of the year. Thereafter,
we expect a slow recovery for the rest of the year and in FY22E, followed by better demand in FY23E. We expect FY23E revenue to be
Rs.12,907.21 Cr, growing at 12.1% CAGR over FY20-23E. We expect FY23E EPS at Rs.1195.06. Assigning a PE multiple of 24x, we arrive at a
Price Target of Rs.28,681, which is an upside of ~34% from yesterday’s closing price of Rs.21,381. We initiate coverage on Eicher Motors
with a BUY rating, over an investment horizon of 24-30 months.
Risks & Concerns
• Prolonged slowdown of Auto Sector could lead to the company performing poorly than our expectations.
• The impact of Covid-19 on the company’s operations and revenue could be much worse than we have factored in.
Source: Company, Sushil Finance Research
July 30, 2020 21Eicher Motors Ltd.
Disclaimer & Disclosures : http://goo.gl/1sOHeV
This report has been furnished to you for your general information only and should not be reproduced, re-circulated, published in any media, website or otherwise, in any form or manner, in part or as a whole,
without the express consent in writing of Sushil Financial Services Private Limited. This Research Report is meant solely for use by the original recipient to whom it is sent and is not for circulation. Any
unauthorized use, disclosure or public dissemination or copying of information (either whole or partial) contained herein is prohibited.
This Report does not constitute a personal recommendation or take into account the particular investment objectives, financial situations, or needs of individual clients. The recommendations, if any, made
herein are expression of views and/or opinions and should not be deemed or construed to be neither advice/offer for the purpose of purchase or sale of any securities mentioned herein. Past performance is not
a guide for future performance, future returns are not guaranteed. Opinions expressed herein are subject to change without notice. Investor should rely on information/data arising out of their own
investigations. The Sushil Equity Universe consists of ## Sushil’s Classic- the company’s where fundamental reports are published and # Sushil’s Bonanza - the other company’s under study.
Investors are advised to seek independent professional advice and arrive at an informed trading/investment decision before executing any trades or making any investments. The price and value of the
investments referred to in this material and the income from them may go down as well as up, and investor may realize losses on any investments. This Report has been prepared on the basis of publicly available
information, internally developed data and other sources believed by us to be reliable. A graph of daily closing prices of securities is available at www.nseindia.com, www.bseindia.com. Research Analyst views on
Subject Company may vary based on Fundamental and Technical Research. Sushil Financial Services Private Limited or its directors, employees, affiliates or representatives do not assume any responsibility for, or
warrant the accuracy, completeness, adequacy and reliability of such information / opinions / views. None of the directors, employees, affiliates or representatives of company shall be liable for any direct,
indirect, special, incidental, consequential, punitive or exemplary damages/loss etc whatsoever from the information/opinions/views contained in this Report and investors are requested to use the information
contained at their risk.
Sushil Financial Services Private Limited (SFSPL) and its connected companies, and their respective Directors, Officers and employees or their relative, may have a long or short position in the subject companies
mentioned in the report and it may not be construed as potential conflict of interest with respect to any recommendation and related information and opinions. Reports based on technical and derivative analysis
centre on studying charts company’s price movement, outstanding positions and trading volume, as opposed to focusing on a company’s fundamentals and, as such, may not match with a report on a company’s
fundamental analysis. SFPSL has different business segments/Divisions with independent research and maintains arm’s length distance catering to different set of customers having various objectives, risk
profiles, investment horizon, etc. and therefore may at times have different contrary views on stocks sector and markets. Research Report may differ between SFSPL’s RAs on account of differences in research
methodology, personal judgment and difference in time horizons for which recommendations are made. User should keep this risk in mind and not hold - SFSPL, its employees and associates responsible for any
losses, damages of any type whatsoever.
This Report is not intended to be a complete statement or summary of the securities, market or developments referred to in this document. SFSPL or its affiliates or employees are under no obligation to update
the information. SFSPL or its affiliates or employees shall not be in any way responsible and liable for any loss or damage that may arise to any person from any inadvertent error in the information contained in
this report.
SFSPL or its affiliates and/or its employees/its associates or his relative does not have financial interest in the subject companies. SFSPL or its affiliates and/or its employees/its associates or his relative may or
may not have beneficial ownership of one per cent or more securities of the subject company, at the end of the month immediately preceding the date of publication of the research report. SFSPL/its Associates/
Research Analyst have not received any compensation from the subject company in the past twelve months. Further the subject company is/was not a client during twelve months preceding the date of
distribution of the research report and the types of services provided. SFSPL or its research analyst has not served as an officer, director or employee of the subject company. SFSPL or its affiliates and/or its
research analysts have not been engaged in market making activity for the subject company. SFSPL or its associates or its Research Analyst have not received any compensation or other benefits from the subject
companies or third party in connection with the research report. SFSPL/its Associates/ Research Analyst/ his Relatives not have any other material conflict of interest at the time of publication of the research
report.
SFSPL/its Associates/ Research Analyst have not managed or co-managed public offering of securities, have not received compensation for investment banking or merchant banking or brokerage services, have
not received any compensation for product or services other than investment banking or merchant banking or brokerage services from the subject companies in the last twelve months. There is no material
disciplinary action that been taken by any regulatory authority impacting equity research analysis activities.
Sushil Financial Services Private Limited
Member : BSE / NSE - SEBI Regn. No. INZ000165135
Research Analyst – SEBI Registration No. INH000000867
Regd. Office : 12, Homji Street, Fort, Mumbai 400 001.
Phone: +91 22 40936000 Fax: +91 22 22665758
Email : info@sushilfinance.com
July 30, 2020 22You can also read