Corporate Presentation - David J. Wilson President & Chief Executive Officer - Kelt Exploration
←
→
Page content transcription
If your browser does not render page correctly, please read the page content below
Corporate Presentation                     April  2019
                                           KeltExploration.com

David J. Wilson
President & Chief Executive Officer

Sadiq H. Lalani
Vice President & Chief Financial Officer

www.keltexploration.com
                                                                 0
Why Invest in Kelt ?
                  CREATING VALUE DURING DOWNTURNS
● The Kelt management team has a track record of creating shareholder value during
  downturns, previously during the 2008-2009 period with Celtic Exploration Ltd., eventually
  sold in February 2013 for $3.2 billion.
● Kelt focuses on long-term growth with emphasis on low-cost land accumulation in
  resource-style plays and rapid growth of its drilling inventory portfolio.
● Kelt successfully acquired large contiguous tracts of Montney acreage in both Alberta and
  British Columbia during the 2015-2016 downturn – the Company currently holds over
  500,000 acres of Montney rights.
● Kelt targets a 2.0 times or better recycle ratio over the long-term on a proved plus probable
  reserve basis – the Company’s 2018 recycle ratio was 2.7 times and in 2017, the recycle
  ratio was 2.3 times.
                                                                                                  1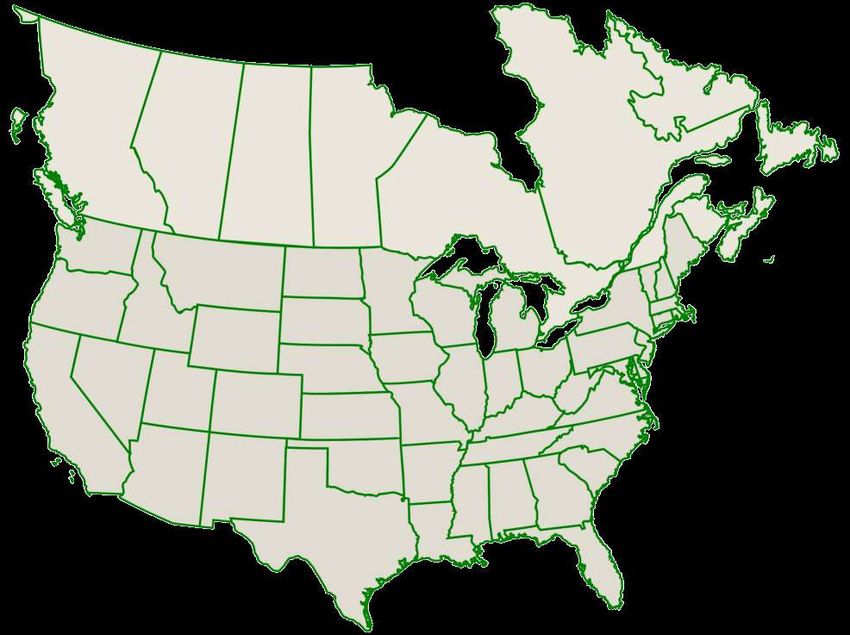
Common Share Information
                            ●    Stock Exchange listing                                                                                                      TSX
                            ●    Trading symbol                                                                                                              KEL
                            ●    Market capitalization                                                                                               $ 1.0 billion
                            ●    52-week trading range                                                                                           $ 3.97 – $ 10.01
                            ●    Common shares issued ( @ Feb/2019 )                                                                                184.0 million

                              ● Stock options ( 9.7 MM ) & RSUs ( 1.1 MM )                  10.8 million ( 5.9% )
                                → average exercise price of stock options is $ 6.17 / share
                              ● Diluted common shares (debentures convert to 16.3 MM shares) 200.3 million
                              ● Diluted common shares (incl. all outstanding options & RSUs)       211.1 million
                              ● Directors & Officers (D&O’s) ownership [1]                  14% ( 15% diluted )

Note:
[1] See slide entitled “Insider Commitment” for details of Insider participation in equity offerings. Current D&O ownership excludes holdings of retired Director, Eldon McIntyre, who served on the Kelt Board
    from inception until his retirement in April 2018. Upon retirement, Mr. McIntyre’s ownership in Kelt shares represented 3.6% of the Company’s outstanding shares.
                                                                                                                                                                                                                  2
Convertible Debentures
            ●   TSX trading symbol                                                       KEL.DB
            ●   Principal amount issued                                           $ 90.00 million
            ●   Principal amount outstanding                                      $ 89.91 million
            ●   Coupon / Maturity date                                       5.0% / May 31, 2021
            ●   52-week trading range                                         $ 105.00 – $ 186.05
                 → D&O’s purchased $14.7 million (16%) of the total Debenture offering.
    Conversion privilege:
    Each debenture will be convertible into common shares of Kelt at the option of the holder at any time prior
    to close of business on the earliest of:
    (a) the business day immediately preceding the maturity date;
    (b) if called for redemption (on or after May 31, 2019), on the business day immediately preceding the date
        specified by the Company for redemption of the debentures; or
    (c) if called for repurchase (pursuant to a “Change of Control”), on the business day immediately preceding
    the payment date;
    at a conversion price of $5.50 per common share, subject to adjustment in certain circumstances.
    Note: $90,000 of face principal value has been converted to common shares to date.
                                                                                                                  3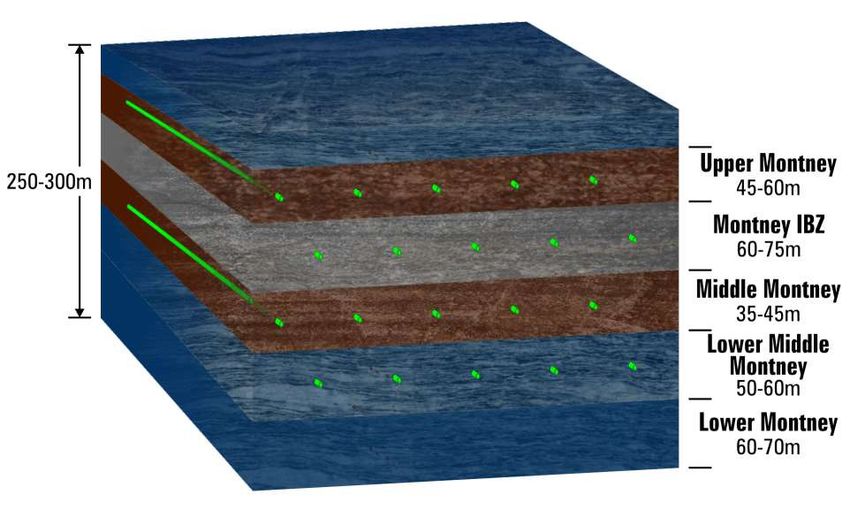
Insider Commitment
                                                                                                                                 Insider Purchases
                       Offering / Market Purchases
                                                                                                     Date                Shares (MM)               Amount (MM)                  Price/share
  $ 13.9 MM Equity Private Placement                                                              Feb-2013                     3.7                       $ 8.7                      $ 2.32
  $ 94.4 MM Equity Private Placement                                                              Apr-2013                     5.7                      $ 31.5                      $ 5.55
  $ 92.0 MM Equity Private Placement                                                             Aug-2013                      0.5                       $ 4.0                      $ 8.00
  $ 19.6 MM Flow-through Equity Private Placement                                                Aug-2013                      0.5                       $ 4.9                      $ 9.80
  $ 101.1 MM Equity Private Placement                                                             Dec-2013                     2.4                      $ 19.6                      $8.15
  $ 33.6 MM Flow-through Equity Private Placement                                                 Mar-2014                     1.1                      $ 13.5                     $ 12.75
  $ 33.4 MM Flow-through Equity Private Placement                                                 Mar-2015                     1.7                      $ 14.7                      $ 8.60
  $ 90.0 MM Equity Prospectus Offering                                                            Jul-2015                     0.4                       $ 3.5                      $ 8.85
  $ 22.1 MM Flow-through Equity Private Placement                                                 Apr-2016                     0.2                       $ 0.9                      $ 4.70
  $ 90.0 MM Convertible Debenture Offering [1]                                                   May-2016                      2.7                      $ 14.7                      $ 5.50
  $ 36.3 MM Flow-through Equity Private Placements                                               2017-2018                     0.1                       $ 1.0                      $ 8.12
  Open Market Purchases                                                                          2013-2018                     2.9                      $ 16.6                      $ 5.67
  TOTAL [2]                                                                                                                   21.9                      $ 133.6                     $ 6.10
 Notes:
  [1] Convertible debenture includes the option to convert to common shares at $5.50 per common share.
  [2] Insiders (excluding a retired director) total current holdings are 25.6 million shares or 14% of outstanding shares (includes Kelt shares received from previous Celtic and Artek holdings and
 is before the conversion of debentures into shares).                                                                                                                                                  4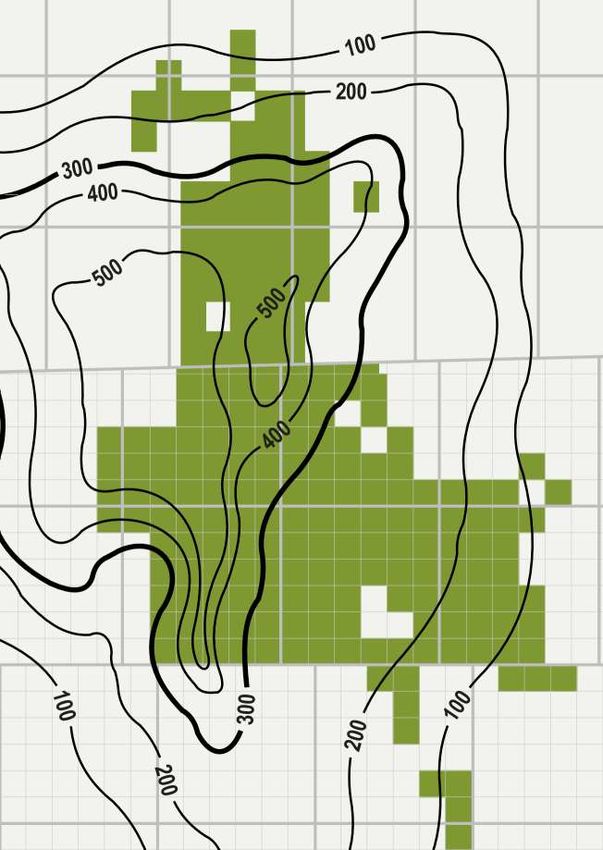
Capital Expenditures
                                                                                                                                      2019    2019/18
  ( $ millions )                                                                      2017                         2018
                                                                                                                                     Budget   Change
  Drilling & Completions                                                              154.7                       168.7              201.0    + 19%
  Equipment, Facilities, &
                                                                                       78.0                       117.7               60.0    − 49%
  Pipeline Infrastructure
  Land, Seismic & Asset Acquisitions                                                   11.6                          9.2              9.0      − 2%
      Capital Expenditures                                                            244.3                       295.6              270.0     − 9%
  Property Dispositions                                                          ( 116.3 ) [1]                   ( 10.1 )              −      − 100%
      Net Capital Expenditures                                                        128.0                       285.5              270.0     − 5%

 Note:
 [1] Approximately $103.0 MM of disposition proceeds relates to the sale of Karr assets on Jan/18/2017, after closing adjustments.
                                                                                                                                                        5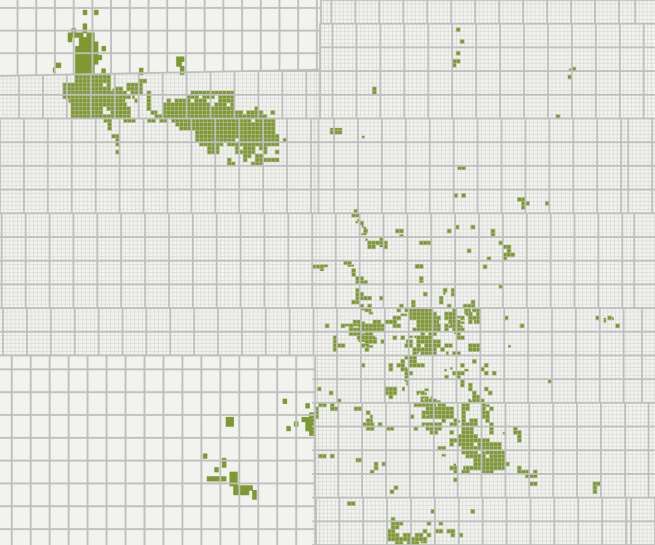
Drilling Program
                                                                                       2018                                               2019 Budget
  Drills                                                                         Gross ( Net ) Wells                                    Gross ( Net ) Wells
  Alberta                                                                                16 ( 15.1 )                                              8 ( 8.0 )
  British Columbia                                                                   17 (17.0 )                                             25 ( 25.0 )
  Total [1, 2, 3]                                                                    33 ( 32.1 )                                            33 ( 33.0 )
                                                                                       2018                                               2019 Budget
  Completions                                                                    Gross ( Net ) Wells                                    Gross ( Net ) Wells
  Alberta                                                                                21 ( 19.6 )                                              8 ( 8.0 )
  British Columbia                                                                        8 ( 8.0 )                                             28 ( 28.0 )
  Total [3]                                                                              29 ( 28.1 )                                            36 ( 36.0 )
 Notes:
 [1] There were 10 DUCs (wells drilled in 2018 but not expected to be completed until 2019)   [3] In addition to DUCs, as at December 31, 2018, the following wells were drilled and
 as at December 31, 2018 as follows:                                                          completed, however, production from these wells are not expected to be put on-stream
      ◦ Fireweed B-33-I Montney pad – 5 wells                                                 until 2019 or later:
      ◦ Inga 5-9 Montney pad – first 4 wells from the 24-well pad                                  ◦ Wembley 00/12-5 Upper-Middle Montney (D3/D4) well
      ◦ Wembley 00/14-2 Upper-Middle Montney (D3/D4) well                                          ◦ Wembley 00/13-13 Upper-Middle Montney (D3/D4) well
 [2] Kelt’s 2019 Budget assumes that there will be 7 DUCs (wells drilled in 2019 but not           ◦ Wembley 00/13-6 Upper-Middle Montney (D3/D4) well
 expected to be completed until 2020) as at December 31, 2019 as follows:                          ◦ Wembley 00/9-4 Upper-Middle Montney (D3/D4) well
      ◦ Inga 5-9 Montney pad – last 6 wells from the 24-well pad                                   ◦ Wembley 00/3-4 Middle Montney (D2) well
      ◦ Wembley 00/4-24 Upper-Middle Montney (D3/D4) well
                                                                                                                                                                                       6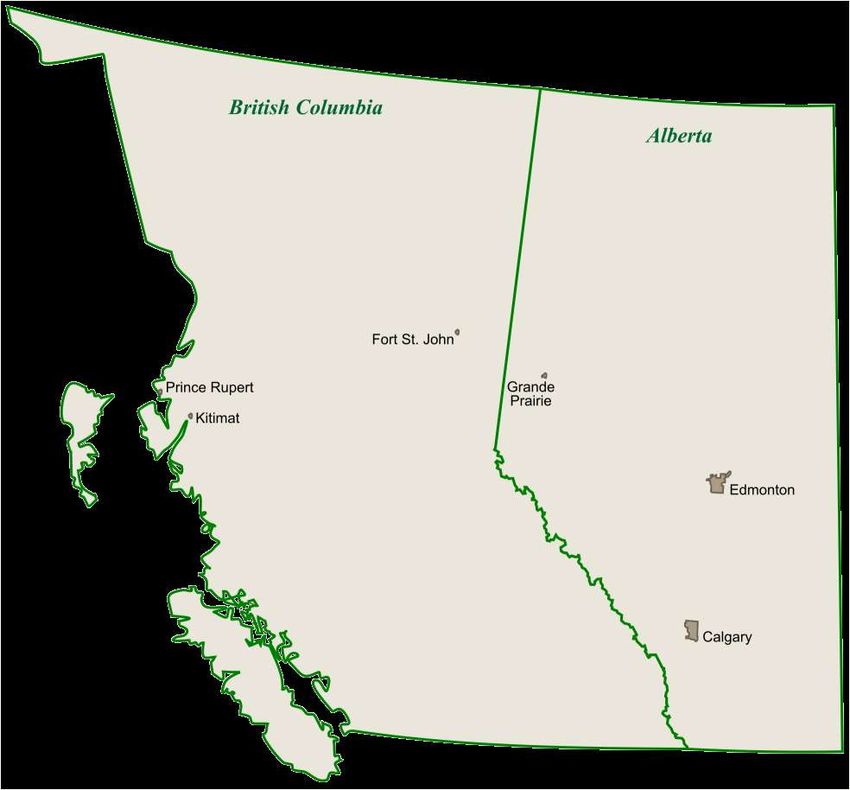
Expected Timing of 2019 Production Additions

                                                                                       Expected                    Expected Production                              Expected
                                                                  Number
 PROJECT                                                                               On-stream                      (IP30) Range                               Oil/NGLs (IP30)
                                                                  of Wells
                                                                                         Date                            BOE/d                                     Percentage
 Inga (5-9/4-9) 24-well pad                                             6                Q2 2019                          5,800 − 6,200                              60% − 65%
 Fireweed (B-33-I/A-34-I) pad [1]                                       5                Q3 2019                          5,200 − 5,500                              60% − 65%
 Wembley/Pipestone area [2]                                            11                Q3 2019                        10,400 − 10,900                              65% − 70%
 Inga (5-9/4-9) 24-well pad                                             6                Q3 2019                          5,800 − 6,200                              60% − 65%
 Inga (5-9/4-9) 24-well pad                                             6                Q4 2019                          5,800 − 6,200                              60% − 65%
 TOTAL PRODUCTION ADDITIONS                                            34                                               33,000 − 35,000                              62% − 67%

 Note:
 [1] The Fireweed B-33-I/A-34-I pad wells will be put on-stream after the construction of a pipeline from the pad to the Kelt Inga 2-10 Facility has been completed.
 [2] The Wembley/Pipestone wells will be put on-stream when the Tidewater Pipestone Sour Deep-Cut Gas Plant, that is currently under construction, commences operations.

                                                                                                                                                                                   7
2019 Production Outlook
                                                                                      2019           2019/2018
                                                               2017     2018
                                                                                     Budget           Change
  Oil ( bbls/d )                                               6,634    8,403     11,200 − 11,800    33% − 40%

  NGLs ( bbls/d ) [1]                                          2,608    3,186      4,300 − 4,600     35% − 44%

  Gas ( Mcf/d )                                                77,330   92,502   105,000 − 112,000   14% − 21%
  Combined ( BOE/d )                                           22,130   27,006    33,500 − 34,500    24% − 28%
  Per MM Shares ( BOE/d )                                       125      148        174 − 179        18% − 21%

  Note:
  [1] The forecasted 2019 NGLs production mix is as follows:
        Pentane ( C5+ )           19%
        Butane ( C4 )             23%
        Propane ( C3 )            35%
        Ethane ( C2 )             23%
        Total NGLs               100%

                                                                                                                 8
Product Mix
               Production   Operating Income   Operating Income
 2018 Actual      Split           (MM)               Split
 Oil & NGLs       43%           $ 158.8              78%
 Gas              57%            $ 43.8              22%
 Total           100%           $ 202.6             100%
               Production   Operating Income   Operating Income
 2019 Budget      Split           (MM)               Split
 Oil & NGLs       47%           $ 222.1              85%
 Gas              53%            $ 39.4              15%
 Total           100%           $ 261.5             100%

                                                                  9
Commodity Prices
( CA$, unless otherwise specified ) 2017 2018 2019 Budget YOY Change
WTI Crude Oil ( USD/bbl ) [1] US $ 50.95 US $ 64.94 US $ 67.50 + 4%
MSW Crude Oil ( CAD/bbl ) [2] $ 62.91 $ 69.29 $ 66.97 − 3%
WTI-MSW Basis Differential ($3.27 or 5%) ($14.87 or 18%) ($19.43 or 22%) + 31%
NYMEX Natural Gas ( USD/mmBtu ) US $ 3.07 US $ 3.04 US $ 3.00 − 1%
UNION-DAWN Gas Daily Index ( USD/MMBtu ) US $ 3.04 US $ 3.13 US $ 2.90 − 7%
CHICAGO [ACE] Gas Daily Index ( USD/MMBtu ) US $ 2.90 US $ 3.01 US $ 2.85 − 5%
MALIN Gas Monthly Index ( USD/MMBtu ) US $ 2.82 US $ 2.76 US $ 2.45 − 11%
SUMAS-HUNTINGDON Gas Monthly Index ( USD/MMBtu ) US $ 2.76 US $ 4.34 US $ 2.90 − 33%
AECO [5A] Gas Daily Index ( USD/MMBtu ) [3] US $ 1.66 US $ 1.16 US $ 1.60 + 38%
Station 2 [7B] Gas NGX Monthly Index ( USD/MMBtu ) [3] US $ 1.20 US $ 0.97 US $ 1.30 + 34%
Exchange Rate ( CAD/USD ) $ 1.299 $ 1.296 $ 1.280 − 1%
Exchange Rate ( USD/CAD ) US $ 0.770 US $ 0.772 US $ 0.781 + 1%
Kelt Oil price ( $/bbl ) $ 59.10 $ 65.82 $ 67.01 + 2%
Premium ( Discount ) to MSW Crude Oil price − 4% − 5% 0%
Kelt NGLs price ( $/bbl ) $ 27.72 $ 33.81 $ 33.70 −
Kelt Gas price ( $/Mcf ) $ 3.01 $ 3.76 $ 3.28 − 13%
Premium to AECO [5A] CAD price per MMBtu + 40% + 150% + 60%
Kelt combined price ( $/BOE ) $ 31.51 $ 37.30 $ 37.50 + 1%
Notes:
[1] WTI – West Texas Intermediate – light sweet crude oil (API 40˚) for settlement at Cushing, Oklahoma, priced in USD.
[2] MSW – Mixed Sweet Blend – light sweet crude oil (API 40˚) for settlement at Edmonton, Alberta, priced in CAD.
[3] AECO and Station 2 converted from GJ to MMBtu at a factor of 1.0546 GJ / MMBtu (1,000 Btu/scf gas). 10Gas Market Risk Management
GAS MARKET DIVERSIFICATION
● The Company has taken a diversified approach to selling its natural gas in order to reduce
exposure to single market risk.
● Kelt has entered into several contracts that result in price exposure to various gas price hubs in
North America.
● Estimated % of average gas sales in 2019 at each price hub is forecasted to be as follows:
1%
AECO
16% Dawn
37% Malin
21% Sumas
Chicago
11% 14%
Station 2
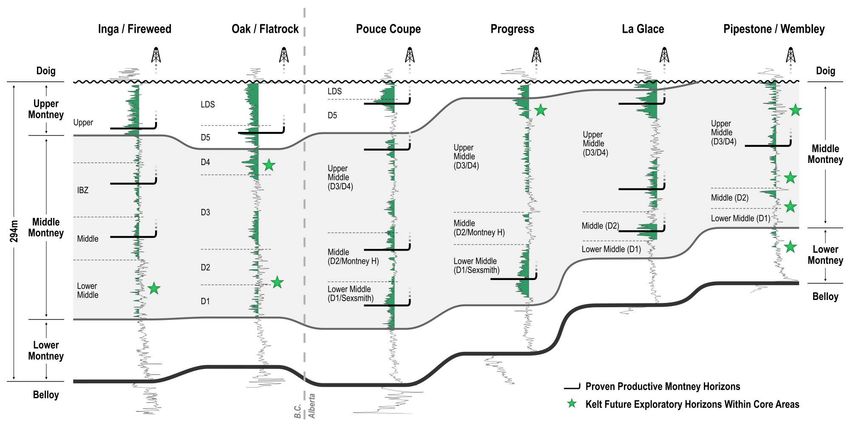
11North American Natural Gas Hubs
Kelt 2019 Budget Gas Netback Forecast
Station 2
Hub Price [1] Netback [2] Netback [2,3]
Gas Hub %
US$/MMBtu US$/Mcf CA$/Mcf
AECO
Sumas NYMEX 3.00
Empress Emerson
Kingsgate Waddington Dawn 21% 2.90 2.01 2.58
Boston Chicago 37% 2.85 1.76 2.25
Stanfield
Dawn
Opal
Malin
Ventura
Marcellus Malin 14% 2.45 1.62 2.07
Chicago
Sumas 11% 2.90 2.18 2.79
AECO 16% 1.60 1.36 1.74
Socal San Juan
Station 2 1% 1.30 1.23 1.57
Permian
Notes:
Henry Hub [1] Hub Price is for 1,000 Btu gas.
(NYMEX) [2] Netback is after the estimated premium for Kelt gas heat value, after fuel, transportation
and other corporate deductions, and before royalties and operating expenses.
Natural Gas Price Hub [3] Exchange rate = US$0.781/CA$ or CA$1.280/US$.
12Hedging
Commodity Index Term Quantity Fixed Price
NYMEX to Dawn Basis Jan/2019 to
Natural Gas 10,000 MMBtu/d Minus US$0.0975/MMBtu
Differential Dec/2019
NYMEX to Chicago Basis Jan/2019 to
Natural Gas 10,000 MMBtu/d Minus US$0.14/MMBtu
Differential Oct/2019
Jan/2019 to
Natural Gas Sumas 7,500 MMBtu/d US$5.97/MMBtu [1]
Mar/2019
Jan/2019 to
Natural Gas Malin 5,000 MMBtu/d US$4.55/MMBtu [2]
Mar/2019
Jan/2019 to
USD CAD/USD US$1.0 MM/month CA$1.3050
Dec/2019
Notes:
[1] At a fixed Sumas price of US$5.97/MMBtu, Kelt would realize approximately CA$7.00/Mcf at Station 2, after adjusting for heat value and after deducting financial basis contracts and transportation
costs, for its B.C. gas production delivered at Station 2 to this contract for the Jan19-Mar19 period.
[2] At a fixed Malin price of US$4.55/MMBtu, Kelt would realize approximately CA$5.00/Mcf at NIT, after adjusting for heat value and after deducting financial basis contracts and transportation costs, for its
Alberta gas production delivered at NIT to this contract for the Jan18-Mar19 period.
132019 Budget Commodity Price Sensitivities
Kelt Kelt Kelt CAD/USD
2019
Oil Price NGLs Price Gas Price Exchange Rate
Budget
minus 10% minus 10% minus 10% minus CAD 0.05
Kelt Oil Price ( CAD/bbl ) 67.01 60.31 - 10% 67.01 n/c 67.01 n/c 64.43 - 4%
Kelt NGLs Price ( CAD/bbl ) 33.70 33.70 n/c 30.33 - 10% 33.70 n/c 32.38 - 4%
Kelt Gas Price ( CAD/Mcf ) 3.28 3.28 n/c 3.28 n/c 2.95 - 10% 3.15 - 4%
Adjusted FFO ( $MM ) [1] [2] 240.0 215.9 - 10% 235.5 - 2% 226.2 - 6% 224.7 - 6%
Change ( $MM ) ( 24.1 ) ( 4.5 ) ( 13.8 ) ( 15.3 )
Adj. FFO per share, diluted [1] [2] 1.23 1.11 - 10% 1.21 - 2% 1.16 - 6% 1.15 - 6%
Change ( $/share ) ( 0.12 ) ( 0.02 ) ( 0.07 ) ( 0.08 )
Net Bank Debt ( $MM ) 225.0 249.1 229.5 238.8 240.3
Net Bank Debt/FFO Ratio [2] 0.9 x 1.2 x 1.0 x 1.1 x 1.1 x
Note:
[1] See “Financial Advisories”
[2] FFO: Funds from Operations
142019 Discretionary Capital Expenditures
Approximately $30.0 million of capital expenditures that is currently included in the 2019 Budget could be
deferred to 2020 if realized commodity prices in 2019 are significantly lower than currently forecasted:
2019 Impact to 2019
Forecasted
Capital Average
Project Production
Expenditures Production
Start Date
(MM) (BOE/d)
Oak – drill & complete 3 wells $ 18.0 Apr-1-2020 0
Inga 24-well pad − drill 6 wells $ 12.0 Apr-1-2020 0
TOTAL $ 30.0 0
“2019 Pro-forma” financial and operating results in this presentation assumes that the Company does
not incur the full $30.0 million in discretionary capital expenditures outlined above in 2019.
Commitments:
[1] Kelt has a take-or-pay commitment at the new AltaGas Townsend Deep-Cut Gas Plant that is expected to be constructed by the fourth quarter of 2019. After plant start-up, Kelt has an 18 month period to
ramp up its production in order to meet its obligation to deliver a minimum of 75.0 MMcf/d of raw gas.
[2] Kelt has a take-or-pay commitment at the new Tidewater Pipestone Sour Deep-Cut Gas Plant that is expected to be constructed by the third quarter of 2019. At plant start-up, Kelt is obligated to deliver a
minimum of 22.5 MMcf/d (75% of its 30.0 MMcf/d firm plant capacity) of raw gas.
152019 Pro-forma Commodity Prices
( CA$, unless otherwise specified ) 2019 Budget 2019 Pro-forma Difference Percent Change
WTI Crude Oil ( USD/bbl ) [1] US $ 67.50 US $ 55.00 − 12.50 − 19%
MSW Crude Oil ( CAD/bbl ) [2] $ 66.97 $ 63.75 − 3.22 − 5%
WTI-MSW Basis Differential ($19.43 or 22%) ($8.85 or 12%)
NYMEX Natural Gas ( USD/mmBtu ) US $ 3.00 US $ 3.00 n/c n/c
UNION-DAWN Gas Daily Index ( USD/MMBtu ) US $ 2.90 US $ 2.90 n/c n/c
CHICAGO [ACE] Gas Daily Index ( USD/MMBtu ) US $ 2.85 US $ 2.85 n/c n/c
MALIN Gas Monthly Index ( USD/MMBtu ) US $ 2.45 US $ 2.85 + 0.40 + 16%
SUMAS-HUNTINGDON Gas Monthly Index ( USD/MMBtu ) US $ 2.90 US $ 3.10 + 0.20 + 7%
AECO [5A] Gas Daily Index ( USD/MMBtu ) [3] US $ 1.60 US $ 1.50 − 0.10 − 6%
Station 2 [7B] Gas NGX Monthly Index ( USD/MMBtu ) [3] US $ 1.30 US $ 1.20 − 0.10 − 8%
Exchange Rate ( CAD/USD ) $ 1.280 $ 1.320 + 0.040 + 3%
Exchange Rate ( USD/CAD ) US $ 0.781 US $ 0.758 − 0.023 − 3%
Kelt Oil price ( $/bbl ) $ 67.01 $ 63.27 − 3.74 − 6%
Premium ( Discount ) to MSW Crude Oil price 0% − 1%
Kelt NGLs price ( $/bbl ) $ 33.70 $ 27.73 − 5.97 − 18%
Kelt Gas price ( $/Mcf ) $ 3.28 $ 3.52 + 0.24 + 7%
Premium to AECO [5A] CAD price per MMBtu + 60% + 78%
Kelt combined price ( $/BOE ) $ 37.50 $ 36.10 − 1.40 − 4%
Notes:
[1] WTI – West Texas Intermediate – light sweet crude oil (API 40˚) for settlement at Cushing, Oklahoma, priced in USD.
[2] MSW – Mixed Sweet Blend – light sweet crude oil (API 40˚) for settlement at Edmonton, Alberta, priced in CAD.
[3] AECO and Station 2 converted from GJ to MMBtu at a factor of 1.0546 GJ / MMBtu (1,000 Btu/scf gas). 16Netbacks
2019 2019/18 2019
( $ / BOE ) 2017 2018
Budget Change Pro-forma
Revenue/Price 31.51 37.30 37.50 + 1% 36.10
Realized hedging gain ( loss ) ( 0.13 ) ( 0.60 ) 0.13 − 0.12
Royalties ( % of revenue/price ) ( 9.3% ) ( 8.3% ) ( 10.2% ) + 23% ( 10.4% )
Transportation expense ( 3.13 ) ( 3.92 ) ( 3.99 ) + 2% ( 3.92 )
Production expense ( 10.05 ) ( 9.11 ) ( 9.06 ) − 1% ( 9.06 )
Operating netback [1] 15.28 20.56 20.77 + 1% 19.48
G&A expense ( 0.94 ) ( 0.85 ) ( 0.76 ) − 11% ( 0.77 )
Interest expense ( 0.97 ) ( 1.02 ) ( 0.95 ) − 7% ( 0.98 )
Other income − 0.26 − − −
Adjusted funds from operations [1] 13.37 18.95 19.06 + 1% 17.73
Note:
[1] See “Financial Advisories”. 17Financial Outlook
2019 2019/18 2019
2017 2018
Budget Change Pro-forma
Revenue ( $ MM ) 257.6 389.3 473.9 + 22% 449.5
Operating income ( $ MM ) [1] 123.4 202.6 261.5 + 29% 241.8
Adj. funds from operations ( $ MM ) [1] 108.0 186.8 240.0 + 28% 220.0
Per share – diluted ( $/share ) 0.61 1.01 1.23 + 22% 1.13
Capital expenditures, net ( $ MM ) [2] 128.0 285.5 270.0 − 5% 240.0
Net bank debt, at year-end ( $ MM ) [1,3] 136.7 196.4 225.0 + 15% 220.0
Net bank debt / FFO ratio 1.3 x 1.1 x 0.9 x − 18% 1.0 x
Notes:
[1] See “Financial Advisories”.
[2] Capital expenditures are net of property dispositions.
[3a] Net bank debt includes amounts outstanding under the Company’s credit facility, net of working capital. The current borrowing base amount of Kelt’s credit facility is $250.0 million.
[3b] In addition to net bank debt, the Company has $89.9 million principal amount of 5% convertible subordinated unsecured debentures outstanding, maturing on May 31, 2021 and
convertible to common equity at a price of $5.50 per share, subject to certain conditions and subject to adjustment in certain events. 18Core Areas
Fort St. John ( BC ) :
Inga/Fireweed & Oak/Flatrock
● Stacked Montney light oil and condensate-rich gas
● Doig condensate-rich gas
Grande Prairie ( AB ) : Fort St. John
Pouce Coupe/Progress, Valhalla/La Glace &
Grande Prairie
Pipestone/Wembley
● Stacked Montney light oil Grande Cache
● Montney/Doig gas
● Charlie Lake light oil
● Halfway light oil
Grande Cache ( AB ) :
● Cretaceous gas
19Kelt Land Fairway
Fireweed Corporate Land Holdings
Inga February Net Net
Flatrock
2019 Acres Sections
Oak Developed 225,797 353
Fort
Undeveloped 596,895 933
St. John
Total 822,692 1,286
Pouce
Coupe
Progress
Montney Rights
Spirit River
Net Net
Acres Sections
Valhalla /
La Glace British Columbia 363,852 569
Pipestone /
Wembley
Alberta 146,719 229
Grande
British Columbia Alberta
Prairie Total 510,571 798
Kelt Lands 20Reserves
NPV 10% BT NPV 10% BT
Dec/31/2017 Dec/31/2018 Percent
Dec/31/2018 Dec/31/2018
( MBOE ) ( MBOE ) Change
( $ MM ) ( $/BOE )
Proved Developed
37,858 40,701 + 8% $ 481 $ 11.82
Producing
Total Proved 132,973 158,443 + 19% $ 1,499 $ 9.46
Proved plus Probable
235,601 302,678 + 28% $ 3,129 $ 10.34
( P+P )
Oil / Ngls ( P+P % ) 43% 43%
Gas ( P+P % ) 57% 57%
Notes:
[1] Reserves are per the reports prepared by Sproule Associates Limited. Reserve volumes include Company gross working interest share of remaining reserves, as determined in accordance
with NI 51-101.
21Finding, Development & Acquisition Costs
As at December 31, 2018 Proved Proved + Probable
2018 capital expenditures + change in FDC ( $M ) 381,046 596,004
Reserve additions, net ( MBOE ) 35,298 76,905
FD&A cost ( $/BOE ) 10.80 7.75
2018 operating netback ( $/BOE ) 20.56 20.56
Recycle ratio 1.9 x 2.7 x
As at December 31, 2017 Proved Proved + Probable
2017 capital expenditures + change in FDC ( $M ) 315,436 343,953
Reserve additions, net ( MBOE ) 32,837 49,592
FD&A cost ( $/BOE ) 9.61 6.94
2017 operating netback ( $/BOE ) 15.28 15.28
Recycle ratio 1.6 x 2.2 x
Notes:
[1] Reserves are per the reports prepared by Sproule Associates Limited. Reserve volumes include Company gross working interest share of remaining reserves, as determined in accordance with NI 51-101.
[2] FD&A: Finding, development & acquisition (net of dispositions). FDC: Future development capital.
22Sproule P+P Reserves – Future Development Capital
December 31, 2018 December 31, 2017
( $MM )
FDC Net HZ Wells FDC Net HZ Wells
Alberta Montney wells 332 59 176 37
B.C. Montney wells 744 140 638 103
TOTAL Montney wells 1,076 199 814 140
Other formation wells 355 77 342 74
Other expenditures 43 - 7 -
TOTAL 1,474 276 1,164 214
Notes:
[1] Reserves are per the reports prepared by Sproule Associates Limited. Reserve volumes include Company gross working interest share of remaining reserves, as determined in
accordance with NI 51-101.
[2] FDC = Future Development Capital.
[3] HZ = horizontal. 23Kelt Montney Framework
24British Columbia Montney Lands
Land ( Montney Rights )
Gross: 368,618 acres ( 576 sections )
Net: 363,852 acres ( 569 sections )
Fireweed
Operations
● Kelt has been successful delineating the
Flatrock Upper and Middle Montney at Inga/Fireweed.
● Kelt is pleased with the initial results from
Inga
Oak
the Montney IBZ at Inga and will continue its
delineation program in that formation.
● Kelt drilled its first exploration Upper
Kelt Lands
Montney well at Oak in 2017 and followed up
with two additional exploration wells in 2018.
25British Columbia Montney Wells
PRODUCTION RESERVES
Kelt British Columbia Montney Drills Typical Well EUR’s
Top 10 IP30 Wells ( gross sales, BOE/d ): Inga/Fireweed Upper Montney (UM)
(1) Fireweed 00/C-31-I/94-A-12 UM 2,068 ( 68% oil/ngls ) Sproule 2P EUR = 860 MBOE:
(2) Inga 02/15-33-087-23W6 MM 2,066 ( 79% oil/ngls ) ● 48% oil/ngls
● 52% gas
(3) Fireweed 00/B-90-A/94-A-13 UM 1,895 ( 63% oil/ngls )
(4) Inga 02/14-24-087-23W6 UM 1,609 ( 74% oil/ngls ) Inga/Fireweed Middle Montney (MM)
(5) Inga 00/14-24-087-23W6 MM 1,412 ( 71% oil/ngls ) Sproule 2P EUR = 637 MBOE:
(6) Inga 00/08-31-087-23W6 UM 1,296 ( 74% oil/ngls ) ● 56% oil/ngls
● 44% gas
(7) Inga 02/16-25-088-23W6 UM 1,242 ( 81% oil/ngls )
(8) Fireweed 02/C-026-A/094-A-13 UM 1,188 ( 65% oil/ngls )
(9) Inga 00/06-07-088-22W6 UM 1,130 ( 52% oil/ngls ) Note:
[a] Wells are typically completed using the ball drop system with 46 fracture stages at
(10) Inga 00/09-27-088-22W6 MM 951 ( 73% oil/ngls ) approximately 70 tonnes/stage of proppant and using high intensity fluid pump rates.
26Inga / Fireweed Montney Lands
A-65-I MM B-90-A UM
LAND (Montney Rights)
02/A-65-I UM
03/A-65-I UM
(sfc C-10-H)
222 gross sections ( 220 net sections )
B-65-I UM
(sfc B-33-I) C-26-A UM
A-58-I UM
(sfc D-A79-I)
(sfc A-6-A)
C-85-I UM 2019 DRILLING PLANS
(sfc A-65-I)
00/15-25 MM • Remaining 20 wells from the Inga (sfc 5-9) 24-well pad.
(sfc B-33-I) C-31-I UM
00/9-27 MM
02/9-27 UM
(sfc B-B62-I)
• One additional delineation Montney well.
02/16-25 UM
(sfc 2-23)
00/7-11 MM
(sfc B1-24) • One additional development Doig well.
02/7-11 UM 7-12 UM
02/8-11 IBZ (sfc 3-24)
(sfc 2-23) 6-7 UM Prior to 2019
(sfc 1-24)
DRILLS Total
8-31 UM
(sfc 7-29) 2019 Forecast
Upper Montney 18 7 25
02/15-33 MM CNRL West
(sfc 5-27)
03/15-33 UM
Stoddart
120 MMcf/d Middle Montney 9 7 16
04/15-33 MM Gas Plant
03/16-33 IBZ
05/16-33 UM KEL 00/8-17 UM
Montney IBZ 3 7 10
04/16-33 MM 00/14-24 MM
Inga 2-10 02/8-17 MM
06/16-33 IBZ
(sfc 5-9)
Facility
100 MMcf/d
02/14-24 UM
03/14-24 IBZ
(sfc 12-36)
(sfc 16-20) Total 30 21 51
7-17 MM Compressor
(sfc 7-29)
UM – Upper Montney IBZ – Montney IBZ MM – Middle Montney
Kelt Lands 27Inga / Fireweed - Stacked Montney Resource Potential
THE MONTNEY CUBE ● Kelt has been successful
MULTIPLE STACKED MONTNEY HORIZONS delineating the Upper and Middle
Montney at Inga/Fireweed.
● Initial results from the Montney IBZ
have been encouraging and Kelt will
continue with its delineation
program in this formation.
● Kelt has commenced drilling
operations on a multi-well (24) pad
targeting the three different
Montney layers.
● Kelt expects to test the Lower
Middle Montney in the near future.
28Inga 6-Section / 3-Pad / 72-Well Development Plan
● Kelt’s 2018/2019 capital expenditures to include 24
drills at Inga from the Company’s first 24-well
multi-layer Montney cube pad that will include 8
Upper, 8 IBZ and 8 Middle Montney wells.
● Wells in each Montney interval will be spaced at
approximately 270 metres apart.
● Vertically, the wells will be spaced in a “ > > > ”
formation.
150 M Heel to Heel
Upper Montney Middle Montney IBZ Montney
29Inga / Fireweed Montney CGR (Condensate to Gas Ratio)
02/14-24
IP30 – 1,609 BOE
(CGR - 402 bbls/MMcf)
1 Year Cum = 268,000 BOE
Inga
24 Well Pad
Inga
24 Well Pad
00/14-24
IP30 – 1,412 BOE
(CGR - 278 bbls/MMcf)
1 Year Cum = 202,000 BOE
02/15-33
IP30 - 2,066 BOE
(CGR - 509 bbls/MMcf)
1 Year Cum = 286,000 BOE
Kelt Lands Upper Montney CGR Kelt Lands Middle Montney CGR 30Inga DOIG Development Wells
● Kelt drilled two Doig wells in 2017 and two more wells in 2018. The Company has one Doig well planned in the
Company’s 2019 capital expenditure budget.
● 2P Type Curves target EURs of 1,300 MBOE (51% gas / 49% oil/ngls).
● Kelt has 36 (33.4 net) future 2P HZ wells booked as inventory in the Doig in its Dec/31/18 reserves evaluation.
Actual Cumulative to Dec 31, 2018 [3] Remaining to Payback [4]
Last Month’s
Capital Initial Production Payback Production
Doig Well Cost Test Start Operating Operating Production
Operating
Period Rate at
($ MM) Date Production Income
[1]
Date [2] (MBOE)
Income Netback Estimate
Estimate (Years) Payback
($ MM) ($/BOE) (MBOE) (BOE/d)
($ MM)
Inga 00/15-33-087-23W6/0 6.9 2017-06-29 2017-06-29 165.5 5.3 31.88 75.4 2.0 0.8 525
Inga 00/07-02-088-23W6/0 7.3 2017-07-14 2017-07-14 182.3 6.1 33.45 51.6 1.5 0.6 820
Inga 02/14-21-087-23W6/0 6.9 2018-10-10 2018-11-10 54.1 1.8 33.36 174.4 5.4 0.9 486
Inga 03/06-21-087-23W6/0 7.1 2018-11-09 2018-11-17 83.9 2.5 29.91 137.6 5.6 0.5 917
Notes:
[1] Half-cycle capital – actual drill & complete costs plus an incremental $300,000 per well is included in the capital cost for equipment and tie-in related costs.
[2] Production Start Date is the date when the well commenced steady production after tie-in operations were completed. The payback period is calculated from this date.
[3] Actual production and operating income cumulative to date is up to Dec 31, 2018 and includes any production and operating income generated during the test period, prior to the Production Start Date.
[4] Operating income required to payback is calculated based on actual sales prices received to date plus estimated 2019 sales prices, if necessary. Estimated future production is calculated
based on internally generated production forecasts/decline curves for each respective well.
31Inga Gas Processing & Liquids Handling
KELT FACILITY (“Inga 2-10 Facility”):
● The Company constructed a 100 MMcf/d compression, dehydration, liquids
handling and frac water facility located at Inga which is currently in operation.
● The Inga 2-10 Facility will compress raw gas that will be delivered to the AltaGas
Facility where a 99 MMcf deep-cut (C3+) gas plant located at Townsend is
currently under construction.
ALTAGAS FACILITY (“Townsend Deep-Cut Gas Plant”):
● The Townsend Deep-Cut Gas Plant is expected to commence commercial operations in the fourth quarter of
2019.
● Kelt has an initial “take-or-pay” volume commitment of 75 MMcf/d of raw gas with an extension and/or volume
increase option in the first two years. Kelt has an 18 month “ramp-up” period to get to the initial 75 MMcf/d
volume commitment.
● During the first three years, Kelt also has the option to commit to a second train for an additional volume of
between 50 and 95 MMcf/d.
● Kelt has also secured liquid fractionation and has committed to the sale of all its resulting propane volumes
to the AltaGas Ridley Island Facility, giving Kelt access to a Far East Propane Index pricing netback.
32Oak / Flatrock Montney Lands
LAND
Montney Rights:
Gross: 206,260 acres ( 322 sections )
Net: 204,988 acres ( 320 sections )
02/13-13 OPERATIONS
(sfc 13-12)
● Oil and gas exploration activity targeting the
Upper Montney (D4 / D5) at depths of 1,500 to
02/6-2
(sfc 14-11) 1,600 metres.
● Expectations are 30% to 50% oil/ngls and
Kelt Lands
pressure gradients slightly above normal.
● The Company’s initial discovery well located at
2019 DRILLING PLANS 02/6-2 was successful and is currently on
● Capital related to additional drilling at production.
Oak in 2019 is discretionary and will ● Two additional exploration tests were drilled in
depend on commodity prices in the first Q1 2018 and are expected to be tested in the
half of 2019. summer of 2019.
33Alberta Montney Lands
LAND
Montney Rights:
Gross: 171,200 acres ( 268 sections )
Net: 147,999 acres ( 231 sections )
Pouce OPERATIONS
Coupe
● Kelt continues with development of the Lower-Middle
Progress (D1) and the Middle (D2) Montney at Pouce Coupe. The
first five-well pad was completed Q117. The second five-
well pad was completed late in Q118 and the third five-
well pad was completed in Q418.
Valhalla / ● Kelt has had success with the first two wells drilled in
La Glace
the Middle Montney at Progress and has recently drilled
four additional wells.
● Kelt continues with its development drilling in the oil-
Pipestone / weighted Montney play at Valhalla/La Glace.
Wembley
● Kelt continues to have success with its delineation
program in the Montney at Pipestone/Wembley.
Kelt Lands
34Alberta Montney Wells
PRODUCTION RESERVES
Kelt Alberta Montney OIL Drills Typical Well EUR’s
Top 10 IP30 Wells ( gross sales, BOE/d ): Pouce Coupe Montney OIL Sproule
(1) Pouce Coupe 03/07-18-078-11W6 LMM (D1) 2,045 ( 66% oil/ngls ) 2P EUR = 585 MBOE:
(2) Pouce Coupe 02/06-18-078-11W6 MM (D2) 2,004 ( 68% oil/ngls ) ● 35% oil/ngls
(3) Pouce Coupe 02/16-09-078-11W6 MM (D2) 1,652 ( 67% oil/ngls ) ● 65% gas
(4) Pouce Coupe 05/07-18-078-11W6 LMM (D1) 1,546 ( 58% oil/ngls )
(5) Pouce Coupe 00/01-09-078-11W6 MM (D2) 1,529 ( 65% oil/ngls )
La Glace Montney OIL Sproule 2P
(6) Wembley/La Glace 00/01-35-074-09W6 UMM (D3/D4) 1,422 ( 67% oil/ngls )
EUR = 600 MBOE:
(7) Wembley/Pipestone 00/04-01-072-08W6 UMM (D3/D4) 1,337 ( 83% oil/ngls )
(8) Pouce Coupe 04/07-18-078-11W6 MM (D2) 1,320 ( 57% oil/ngls )
● 58% oil/ngls
(9) Pouce Coupe 02/09-09-078-11W6 MM (D2) 1,093 ( 71% oil/ngls ) ● 42% gas
(10) Valhalla/La Glace 00/13-33-074-08W6 MM (D2) 1,090 ( 88% oil/ngls )
Abbreviations:
UM = Upper Montney or D5.
UMM = Upper-Middle Montney or D3/D4.
MM = Middle Montney or D2 (at Pouce Coupe also referred to as “Montney H”).
LMM = Lower-Middle Montney or D1 (at Pouce Coupe also referred to as “Montney Sexsmith” ).
35Pouce Coupe / Progress
15-13 MM OPERATIONS
920 BOE/d IP30
(KEL 50%) ● Kelt recently completed its first well
14-14 MM
875 BOE/d IP30
(03/5-18) at Pouce Coupe in the Upper-
Pouce (KEL 50%) Middle Montney (D4).
Coupe Progress
02/5-18 LMM
02/6-18
03/7-18 04/7-18
00/3-9
00/8-9 Progress 1-8 MM ● Results from the 03/5-18 well are
(KEL 50%)
04/6-18 LMM
00/5-18 MM
05/7-18 02/8-18
00/8-18 MM
00/9-9
02/9-9
Gas Plant
(20% WI) encouraging with an initial 58%
03/6-18 MM
03/5-18 UMM
LMM 13-8
LMM
02/16-9
MM oil/ngls weighting.
16-9
MM
● The Company will evaluate the well’s
14-25
MM
1-9
MM
performance over the next few months
14-8
LMM 13-3 MM as this zone could unlock additional
(KEL 50%)
9-1 MM drilling inventory on Kelt’s lands.
16-25 (KEL 50%)
MM 13-32 Halfway Pad:
Doig/UM 00/1-10 Kelt Pouce Coupe Montney GAS Drills
Pouce Coupe 00/2-10
Compressor (KEL 56.25%)
Top IP30 Wells (gross sales, BOE/d):
16-17 Facility
Doig/UM (100% WI) (1) Pouce Coupe 03/16-25-077-13W6 MM 2,317 ( 94% gas )
(2) Pouce Coupe 00/14-25-077-13W6 MM [1] 1,400 ( 95% gas )
Abbreviations:
UM = Upper Montney (D5) (3) Pouce Coupe 00/16-17-077-12W6 UM [1] 1,071 ( 90% gas )
UMM = Upper-Middle Montney (D3/D4) Note:
MM = Middle Montney (D2 or may be referred to as “Montney H”) [1]The Pouce Coupe 14-25 and 16-17 wells were drilled with approximately two mile
LMM = Lower-Middle Montney (D1 or may be referred to as “Montney Sexsmith”) horizontal laterals and were put on production at restricted gas rates due to limited
compression capacity.
36Valhalla / La Glace and Pipestone / Wembley
OPERATIONS
● Ownership in pipeline infrastructure, minor interests in
Kelt 14-29 gas plants and 100% interest in the Kelt La Glace Facility
La Glace
Facility Encana
which has a handling capacity of 3,500 bbls/d of oil and 20
(100% WI) 1-5 Sexsmith MMcf/d of gas.
Gas Plant
02/13-33
15-33 UM
(0.3% WI) ● Kelt has entered into an agreement with Tidewater
14-32 Midstream and Infrastructure Ltd. for firm processing of
2-28 30.0 MMcf/d of raw gas under a 10-year take-or-pay
1-27
1-35 UMM
02/4-23
arrangement at the Pipestone Sour Deep-Cut Gas
16-32 Processing Plant that is currently under construction and
3-28 which is expected to be on-stream by mid-2019.
16-22 3-4
13-6
(sfc 10-28) ● At Wembley/Pipestone, as a follow-up to the discovery
14-2 UMM
(sfc 14-26)
UMM well at 4-1 (IP30 1,337 BOE/d), Kelt drilled, completed and
(sfc 11-31)
tested five additional wells in 2018 and drilled two more
Cenovus
Wembley 9-4 UMM wells (13-6 & 14-2) in Q418.
(sfc 12-5)
Gas Plant
(0.4% WI)
13-13 UMM 2019 DRILLING PLANS
(sfc 14-02)
12-5 UMM ● Eight Upper-Middle (D3/D4) Montney wells.
(sfc 12-3)
4-1 UMM (sfc 1-14)
Kelt Lands UM – Upper Montney (D5) UMM – Upper-Middle Montney (D3/D4) MM – Middle Montney (D2) 37Spirit River – Charlie Lake
Land
13-34 Gross: 29,440 acres ( 46 sections )
CL Pad:
14-22 (60%)
15-22 (60%)
Net: 22,227 acres ( 35 sections )
13-33 16-22 (60%)
Charlie Lake: 20.00 net sections
16-11 H2O
Disposal
Charlie Lake:
Gamma Ray Density Porosity
Worsley (O)
Y
J Upper
4-15 CL Pad:
(60%) 13-23 (27.5%) J Lower
14-23 (27.5%)
15-23 (27.5%) R
16-23 (27.5%)
15-5
TOU 7-3
IP90: F
770 bopd +
2.1 MMcf/d D
02/3-1 (E/M/D/F)
03/3-1 (Worsley/Y/J) M
E
Kelt Lands
38Grande Cache
Narraway
Modern 13-4
IP30: 9 MMcf/d
LAND
135 MMcf/d
Gas Plant
Falher/Wilrich
TOU 4-29 Gross: 94,240 acres ( 147 sections )
(7% WI) IP30: 20 MMcf/d
Falher/Wilrich Net: 56,904 acres ( 89 sections )
OPERATIONS
● Low decline Cretaceous natural gas
production
● Ownership interests in gas gathering
infrastructure and in the Narraway and
Copton Gas Plants
Copton ● Low operating expenses
25 MMcf/d
Gas Plant
(30% WI) ● Successful Falher/Wilrich gas wells
offsetting Kelt acreage
Kelt Lands
39Net Asset Value
Dec/31 Dec/31 Dec/31 2018/17
( millions )
2016 2017 2018 Change
P&NG reserves, NPV10% BT 1,730.7 2,111.5 3,128.6 + 48%
Decommissioning obligations, NPV10% BT [1] ( 9.5 ) ( 12.8 ) ( 9.0 ) − 29%
Undeveloped land 212.5 239.1 279.7 + 17%
Net bank debt ( 138.0 ) ( 136.7 ) ( 196.4 ) + 44%
Proceeds from exercise of stock options [2] 29.7 60.4 6.4 − 89%
NET ASSET VALUE 1,825.4 2,261.5 3,209.3 + 42%
Diluted common shares outstanding [3] 198.5 204.4 207.0 + 1%
NET ASSET VALUE PER SHARE $ 9.20 $ 11.06 $ 15.51 + 40%
Notes:
[1] The present value of decommissioning obligations included above is incremental to the amount included in the present value of P&NG reserves as evaluated by Sproule.
[2] The calculation of proceeds from exercise of stock options and the diluted number of common shares outstanding only include stock options that are “in-the-money” based on the closing price of KEL of $7.19 and $4.64 per
common share respectively as at December 31, 2017 and 2018.
[3] The 5% convertible debentures that mature on May 31, 2021 are convertible to common shares at $5.50 per share. At the December 31, 2018 closing price of $4.64 per share, the convertible debentures are “out-of-the-money”
and 20.4 million shares issuable at a 5% discount are included in diluted common shares outstanding. At the December 31, 2017 closing price of $7.19, the convertible debentures are “in-the-money” and 16.3 million shares
issuable upon conversion are included in diluted common shares outstanding.
40Future Considerations
● The Company has numerous potential future drilling opportunities on its
existing lands that will provide for continued growth in the years to come.
● The Company has amassed vast Montney acreage in new plays to
complement its existing development Montney lands.
● The Company will continue to de-risk its undeveloped exploration lands
as it embarks on full scale development of its de-risked Montney resource.
● The Company may divest certain assets in order to fund continued growth
in the future.
41Management
David
David J. Wilson Sadiq H. Lalani Douglas J. Errico Alan G. Franks Bruce D. Gigg
President & Chief Executive Officer Vice President & Chief Financial Officer Vice President, Land Vice President, Production Vice President, Engineering
David A. Gillis Douglas O. MacArthur Patrick W. G. Miles Carol Van Brunschot
Vice President, Finance Vice President , Operations Vice President, Exploration Vice President, Marketing
42Board of Directors
Robert J. Dales [2, 3, 4, 7] Geri L. Greenall [2, 3, 6] William C. Guinan [1,5]
President, Valhalla Ventures Inc. Chief Financial Officer, Partner, Borden Ladner Gervais LLP
Chief Compliance Officer &
Portfolio Manager, Camber Capital Corp.
Notes:
[1] Chairman of the Board
[2] Member of the Audit Committee
[3] Member of the Reserves Committee
[4] Member of the Compensation Committee
[5] Member of the Health, Safety and Environment Committee
[6] Member of the Nominating Committee
[7] Lead Director
Michael R. Shea [3, 4, 6] Neil G. Sinclair [2, 4, 5, 6] David J. Wilson [5]
Independent Businessman [8] Mr. Eldon A. McIntyre, who had been a director of Kelt
President, Sinson Investments Ltd. President & Chief Executive Officer, since inception of the Company, retired from the Board on
Kelt Exploration Ltd. April 18, 2018.
43Appendix
● Quarterly 2018 Oil Prices & 2019 Budget Oil Price Forecast
● Quarterly 2018 Gas Prices & 2019 Budget Gas Price Forecast
● Annual Production Growth Charts
● Annual Cash Costs Chart
● Well Type Curves
● Abbreviations
● Disclaimers
44Kelt’s 2019 Budget Oil Price Forecast
( CA$/bbl ) ( US$/bbl )
100.00 100.00
KELT Realized WTI
( 2018 Average = CA$65.82 ) ( 2018 Average = US$64.94 )
90.00 ( 2019 Average = CA$67.01 ) ( 2019 Average = US$$67.50 ) 90.00
80.00 80.56 80.62 80.00
74.46
70.38
70.00 68.16 67.88 69.46 67.50 67.50 70.00
67.50 67.50
62.87 63.47
60.00 59.08 60.00
58.32
50.00 50.00
40.00 40.00
38.77
30.00 30.00
2018 Q1 Q2 Q3 Q4 2019 Q1 [E] Q2 [E] Q3 [E] Q4 [E]
Notes:
2018: WTI to MSW differentials/discount = CA$7.50 (Q1), CA$7.27 (Q2), CA$9.23 (Q3), CA$35.39 (Q4); resulting in an average for 2018 = CA$14.99.
2019: WTI to MSW differentials/discount = CA$30.00 (Q1), CA$23.00 (Q2), CA$15.00 (Q3), CA$10.00 (Q4); resulting in an average for 2019 = CA$19.43.
45Kelt’s 2019 Budget Gas Price Forecast
( CA$/Mcf ) ( US$/MMBtu )
7.50 6.50
KELT Realized NYMEX Henry Hub
( 2018 Average = CA$3.76 ) ( 2018 Average = US$3.04 )
6.50 ( 2019 Average = CA$3.28 ) ( 2019 Average = US$3.00 ) 5.50
6.37
5.50 4.50
3.55
4.50 3.50
3.20
2.95 2.90 3.10
2.87 3.99 2.80
2.78
3.50 2.50
3.20 3.09
3.15
2.81 2.90
2.50 2.56 1.50
1.50 0.50
2018 Q1 Q2 Q3 Q4 2019 Q1 [E] Q2 [E] Q3 [E] Q4 [E]
46Annual Production Growth ( since inception )
PRODUCTION ( BOE / d )
45,000
CAGR since 2013 = 43%
40,000
33,500 −
35,000 34,500
30,000
27,006
17,500 −
25,000
22,130 18,600
20,947
20,000 18,577 15,417
15,000 12,888
12,756 13,168
11,879
10,000 15,500 −
8,419
16,400
5,000 3,961 11,589
7,779 9,242
3,148 6,698
4,337
0 813
2013 2014 2015 2016 2017 2018 2019 [E]
Oil / NGLs
Gas
47Annual Production per Share Growth ( since inception )
PRODUCTION PER MILLION SHARES ( BOE / d )
250
CAGR since 2013 = 22%
200
174 − 179
148
150
120 121 125 91 − 97
105
100 84
73
77 76
69
53
50
81 − 85
42 64
43 45 52
36
0 11
2013 2014 2015 2016 2017 2018 2019 [E]
Oil / NGLs
Gas
48Annual Cash Costs
( $ / BOE ) CONTROLLING COSTS
24.00
G&A
Interest
Production & Transportation
20.00
16.00
12.00
8.00
4.00
0.00
2014 2015 2016 2017 2018 2019 [E]
49Inga / Fireweed Upper Montney Type Curve
( BOE / d ) TOTAL RAW PRODUCTION (Well Count)
5,000
Sproule 2P Type Curve
Well Count
1,000
Sproule 2P EUR
100 860 MBOE
48% Oil/Ngls
52% Gas
10 15
10
5
0
1 3 5 7 9 11 13 15 17 19 21 23 25 27 29 31 33 35 37 39 41 43 45 47 49
Month
00/06-07-088-22W6/0 00/07-12-088-23W6/0 00/08-17-087-22W6/0 00/08-31-087-23W6/0 00/16-25-088-23W6/0
(CTD 231 MBOE) (CTD 148 MBOE) (CTD 178 MBOE) (CTD 389 MBOE) (CTD 176 MBOE)
00/B-090-A/094-A-13/0 00/C-031-I/094-A-12/0 00/C-085-I/094-A-12/0 02/14-24-087-23W6/3 02/C-026-A/094-A-13/0
(CTD 381 MBOE) (CTD 373 MBOE) (CTD 263 MBOE) (CTD 292 MBOE) (CTD 395 MBOE)
50Inga / Fireweed Upper Montney Type Curve
( BOE / d ) TOTAL RAW PRODUCTION ( Well Count [1] )
5,000
Average Well
Sproule 2P Type Curve
Well Count
1,000
Sproule 2P EUR
100 860 MBOE
48% Oil/Ngls
52% Gas
10 15
10
5
0
1 3 5 7 9 11 13 15 17 19 21 23 25 27 29 31 33 35 37 39 41 43 45 47 49
Month
51Inga / Fireweed Middle Montney Type Curve
( BOE / d ) TOTAL RAW PRODUCTION (Well Count)
5,000
Sproule 2P Type Curve
Well Count
1,000
Sproule 2P EUR
100
637 MBOE
56% Oil/Ngls
44% Gas
10 10
5
0
1 3 5 7 9 11 13 15 17 19 21 23 25 27 29 31 33 35 37 39 41 43 45 47 49
Month
00/07-17-087-23W6/0 00/09-27-088-23W6/0 00/14-24-087-23W6/0 02/08-17-087-22W6/0 02/15-33-087-23W6/0
(CTD 181 MBOE) (CTD 96 MBOE) (CTD 259 MBOE) (CTD 80 MBOE) (CTD 330 MBOE)
52Inga / Fireweed Middle Montney Type Curve
( BOE / d ) TOTAL RAW PRODUCTION ( Well Count [1] )
5,000
Average Well
Sproule 2P Type Curve
Well Count
1,000
Sproule 2P EUR
100
637 MBOE
56% Oil/Ngls
44% Gas
10 10
5
0
1 3 5 7 9 11 13 15 17 19 21 23 25 27 29 31 33 35 37 39 41 43 45 47 49
Month
Note:
[1] See “Appendix” for list of wells included in the well count and for individual decline curves for each well. 53Pouce Coupe / Progress Montney Oil Type Curve
( BOE / d ) TOTAL RAW PRODUCTION (Well Count)
5,000
2P EUR Type Curve
Well Count
1,000
2P EUR
585 MBOE
35% Oil/Ngls
100 65% Gas
10 30
20
10
0
1 3 5 7 9 11 13 15 17 19 21 23 25 27 29
Month
00/01-09-078-11W6/0 00/03-09-078-11W6/0 00/05-18-078-11W6/0 00/08-09-078-11W6/0 00/08-18-078-11W6/2 00/09-01-078-09W6/0 00/09-09-078-11W6/0 00/13-03-078-09W6/0 00/14-14-078-09W6/0
(CTD 259 MBOE) (CTD 137 MBOE) (CTD 161 MBOE) (CTD 125 MBOE) (CTD 211 MBOE) (CTD 50 MBOE) (CTD 141 MBOE) (CTD 39 MBOE) (CTD 340 MBOE)
00/15-13-078-09W6/0 02/05-18-078-11W6/0 02/06-18-078-11W6/0 02/08-18-078-11W6/0 02/09-09-078-11W6/0 02/12-08-078-11W6/0 02/13-08-078-11W6/0 02/14-08-078-11W6/0 02/14-09-078-11W6/0
(CTD 406 MBOE) (CTD 11 MBOE) (CTD 397 MBOE) (CTD 440 MBOE) (CTD 124 MBOE) (CTD 285 MBOE) (CTD 311 MBOE) (CTD 253 MBOE) (CTD 321 MBOE)
02/16-09-078-11W6/0 03/05-18-078-11W6/0 03/06-18-078-11W6/0 03/07-18-078-11W6/0 04/06-18-078-11W6/0 04/07-18-078-11W6/0 05/07-18-078-11W6/0
(CTD 228 MBOE) (CTD 55 MBOE) (CTD 120 MBOE) (CTD 253 MBOE) (CTD 103 MBOE) (CTD 323 MBOE) (CTD 227 MBOE) 54Pouce Coupe / Progress Montney Oil Type Curve
( BOE / d ) TOTAL RAW PRODUCTION ( Well Count [1] )
5,000
Average Well
2P EUR Type Curve [2]
Well Count
1,000
2P EUR [2]
585 MBOE
35% Oil/Ngls
100 65% Gas
10 30
20
10
0
1 3 5 7 9 11 13 15 17 19 21 23 25 27 29
Month
Note:
[1] See “Appendix” for list of wells included in the well count and for individual decline curves for each well.
[2] Sproule has a 795 MBOE and a 514 MBOE type curve. Kelt is using a blend of the two curves.
55La Glace Montney Oil Type Curve
( BOE / d ) TOTAL RAW PRODUCTION (Well Count)
5,000
Sproule 2P Type Curve
Well Count
1,000
Sproule 2P EUR
100 600 MBOE
58% Oil/Ngls
42% Gas
10 10
5
0
1 3 5 7 9 11 13 15 17 19 21 23 25 27 29 31 33 35 37 39 41 43 45 47 49
Month
00/01-27-074-08W6/0 00/02-28-074-08W6/0 00/03-28-074-08W6/0 00/13-33-074-08W6/0 02/01-05-075-08W6/0
(CTD 419 MBOE) (CTD 221 MBOE) (CTD 176 MBOE) (CTD 343 MBOE) (CTD 264 MBOE)
02/04-23-074-08W6/0 02/13-33-074-08W6/0 02/16-22-074-08W6/0 03/14-32-074-08W6/0 03/16-32-074-08W6/0
(CTD 218 MBOE) (CTD 244 MBOE) (CTD 345 MBOE) (CTD 85 MBOE) (CTD 336 MBOE)
56La Glace Montney Oil Type Curve
( BOE / d ) TOTAL RAW PRODUCTION ( Well Count [1] )
5,000
Average Well
Sproule 2P Type Curve
Well Count
1,000
Sproule 2P EUR
100 600 MBOE
58% Oil/Ngls
42% Gas
10 10
5
0
1 3 5 7 9 11 13 15 17 19 21 23 25 27 29 31 33 35 37 39 41 43 45 47 49
Month
Note:
[1] See “Appendix” for list of wells included in the well count and for individual decline curves for each well. 57Abbreviations
GAAP: Canadian generally accepted accounting principles as set out in the CPA Canada Handbook – Accounting.
IFRS: International Financial Reporting Standards as issued by the International Accounting Standards Board (“IASB’).
FFO: Funds from operations
WTI: West Texas Intermediate
MSW: Medium Sweet Blend
NYMEX: New York Mercantile Exchange
AECO: Alberta Energy Company “C” Meter Station of the NOVA Pipeline System
MRF: Modernized Royalty Framework (Alberta)
PDP: Proved developed producing reserves.
1P: Proved reserves.
2P or P+P: Proved plus probable reserves.
BOE/d: barrels of oil equivalent per day
bbls/d: barrels per day
Mcf/d: thousand cubic feet per day
GJ: gigajoules
LT: long tonnes
MM: million
LNG: liquefied natural gas
58Disclaimer
Forward Looking Statements
Certain statements included in this corporate presentation (the “Presentation”) constitute forward looking statements or forward looking information under applicable securities
legislation. Such forward looking statements or information are provided for the purpose of providing information about management's current expectations and plans relating to
the future. Readers are cautioned that reliance on such information may not be appropriate for other purposes, such as making investment decisions. Forward looking statements
or information typically contain statements with words such as “anticipate”, “believe”, “expect”, “plan”, “intend”, “estimate”, “propose”, “project“, “goal”, “objective”, “assume”,
“forecast” or similar words suggesting future outcomes or statements regarding an outlook.
Forward looking statements or information in this Presentation include, but are not limited to, statements or information with respect to: Kelt Exploration Ltd.'s (“Kelt” or the
“Company”) business strategy and objectives; statements with respect to the performance characteristics of Kelt’s oil and natural gas properties and wells; potential future drilling
locations; development plans, exploration plans, delineation drilling, in-fill drilling, optimization plans and effect on costs and production; the Company’s focus for 2019, including
capital expenditures, budgeted drilling and completion costs per well, drilling program, maintaining a strong balance sheet and cost reductions; anticipated production including
production mix; estimated recoverable resources; expansion of infrastructure; timing of drilling and completions; plans to investigate or participate in infrastructure projects; the
Company’s plan to continue to evaluate construction of processing facilities and sales pipelines; forecasted pricing; actual and estimated internal rates of return, which include
assumptions respecting production and other costs, pricing, well depths, royalty rates and taxes and 2019 budgeted activities, 2019 discretionary capital expenditures of $30.0
million that could be postponed or not incurred, 2019 Pro-forma financial and operating results with lower oil and NGL prices and higher gas prices compared to the 2019 Budget;
economic metrics including capital, IRR, net present values, EUR, netbacks, and production rates; that the estimated future production and operating income for the Doig
development wells will be sufficient to payback the drill and complete capital costs incurred for each respective well; the expectation that the Company’s gas market diversification
will limit exposure to single market risk.
In addition, the statements contained herein relating to “reserves” and “resources” are by their nature forward looking statements, as they involve the implied assessment, based
on certain estimates and assumptions that the reserves or resources described exist in the quantities predicted or estimated and that the reserves or resources can be profitably
produced in the future. Actual reserves or resources may be greater than or less than the estimates provided herein.
Future Oriented Financial Information
This Presentation contains Future Oriented Financial Information (“FOFI”) within the meaning of applicable securities laws. The FOFI has been prepared by Kelt’s management to
provide an outlook of the Company's activities and results. The FOFI has been prepared based on a number of assumptions including the assumptions discussed under the
heading “Forward Looking Statements” and assumptions with respect to the costs and expenditures to be incurred by the Company, capital equipment and operating costs, foreign
exchange rates, taxation rates for the Company, general and administrative expenses and the prices to be paid for the Company's production. Management does not have firm
commitments for all of the costs, expenditures, prices or other financial assumptions used to prepare the FOFI or assurance that such operating results will be achieved and,
accordingly, the complete financial effects of all of those costs, expenditures, prices and operating results are not objectively determinable.
59Disclaimer
The actual results of operations of the Company and the resulting financial results will likely vary from the amounts set forth in the analysis presented in this Presentation, and
such variation may be material. The Company and its management believe that the FOFI has been prepared on a reasonable basis, reflecting management’s best estimates and
judgments. However, because this information is highly subjective and subject to numerous risks including the risks discussed under the heading “Forward Looking Statements”, it
should not be relied on as necessarily indicative of future results.
Except as required by applicable securities laws, Kelt undertakes no obligation to update such FOFI and forward looking statements and information.
Assumptions
Forward looking statements or information are based on a number of factors and assumptions which have been used to develop such statements and information but which may
prove to be incorrect. Although the Company believes that the expectations reflected in such forward looking statements or information are reasonable, undue reliance should not
be placed on forward looking statements because the Company can give no assurance that such expectations will prove to be correct.
In addition to other factors and assumptions which may be identified in this Presentation, assumptions have been made regarding, among other things: commodity prices; the
accuracy of geological and geophysical data and its interpretations of that data; estimated decline rates; the impact of increasing competition; the general stability of the economic
and political environment in which the Company operates; the timely receipt of any required regulatory approvals; the ability of the Company to obtain qualified staff, equipment
and services in a timely and cost efficient manner; the ability of the Company to operate in a safe, efficient and effective manner; the ability of the Company to obtain financing on
acceptable terms; that the Company will have sufficient cash flow, debt or equity or other financial resources to fund its capital and operating expenditures as needed; field
production rates and decline rates; the ability to replace and expand oil and natural gas reserves through acquisition, development or exploration; the timing and costs of pipeline,
storage and facility construction and expansion and the ability of the Company to secure adequate product transportation; future oil and natural gas prices; currency, exchange and
interest rates; the regulatory framework regarding royalties, taxes and environmental matters in the jurisdictions in which the Company operates; that the estimates of the
Company’s reserve volumes and assumptions related thereto are accurate in all material respects; and the ability of the Company to successfully market its oil and natural gas
products.
Readers are cautioned that the foregoing list is not exhaustive of all factors and assumptions which have been used.
60Disclaimer
Risks and Uncertainties
Forward looking statements or information are based on current expectations, estimates and projections that involve a number of risks and uncertainties which could cause actual
results to differ materially from those anticipated by the Company and described in the forward looking statements or information. These risks and uncertainties which may cause
actual results to differ materially from the forward looking statements or information include, among other things: the ability of management to execute its business plan; general
economic and business conditions; the risk of instability affecting the jurisdictions in which the Company operates; the risks of the oil and gas industry, such as operational risks in
exploring for, developing and producing crude oil and natural gas and market demand; the possibility that government policies or laws may change or governmental approvals may
be delayed or withheld; risks and uncertainties involving geology of oil and gas deposits; the uncertainty of reserves estimates and reserves life; the ability of the Company to add
production and reserves through acquisition, development and exploration activities; the Company’s ability to enter into or renew leases; potential delays or changes in plans with
respect to exploration or development projects or capital expenditures; the uncertainty of estimates and projections relating to production (including decline rates), costs and
expenses; fluctuations in oil and gas prices, foreign currency exchange rates and interest rates; risks inherent in the Company's marketing operations, including credit risk;
uncertainty in amounts and timing of royalty payments; health, safety and environmental risks; risks associated with potential future lawsuits and regulatory actions against the
Company; uncertainties as to the availability and cost of financing; changes in income tax rates; changes in incentive programs related to the oil and gas industry; and financial
risks affecting the value of the Company’s investments.
Readers are cautioned that the foregoing list is not exhaustive of all possible risks and uncertainties.
No Obligation to Update
The forward looking statements or information contained in this Presentation are made as of the date hereof and the Company undertakes no obligation to update publicly or
revise any forward looking statements or information, whether as a result of new information, future events or otherwise unless required by applicable securities laws.
The forward looking statements or information contained in this Presentation are expressly qualified by this cautionary statement.
61Disclaimer
Oil and Gas Advisories
Barrel of Oil Equivalent Presentation
This Presentation contains various references to the abbreviation BOE which means barrels of oil equivalent. Where amounts are expressed on a BOE basis, natural gas volumes
have been converted to oil equivalence at six thousand cubic feet per barrel and sulphur volumes have been converted to oil equivalence at 0.6 long tons per barrel. The term
BOE may be misleading, particularly if used in isolation. A BOE conversion ratio of six thousand cubic feet per barrel is based on an energy equivalency conversion method
primarily applicable at the burner tip and does not represent a value equivalency at the wellhead and is significantly different than the value ratio based on the current price of
crude oil and natural gas. This conversion factor is an industry accepted norm and is not based on current prices. Such abbreviation may be misleading, particularly if used in
isolation.
References to “oil” in this Presentation include crude oil and field condensate.
References to “natural gas liquids” or “ngls” include pentane, butane, propane, and ethane.
References to “liquids” includes field condensate and ngls.
References to “gas” in this discussion include natural gas and sulphur.
Type Well Production and Economics
This Presentation contains references to type well, or “type curve”, production and economics, which are derived, at least in part, from available information respecting the well
economics of other companies and, as such, there is no guarantee that Kelt will achieve the stated or similar results, capital costs and return costs per well. Any references to peak
rates, test rates or initial production rates or declines are useful for confirming the presence of hydrocarbons, however, such rates and declines are not determinative of the rates at
which such wells will commence production and decline thereafter and are not indicative of long term performance or ultimate recovery. In addition, such rates or declines may
also include recovered fluids used in well completion stimulation.
Readers are cautioned not to place reliance on such rates in calculating aggregate production for the Company.
62You can also read