Sixt Leasing SE Capital Markets Day 2019 - 16 April 2019 - The site can't be ...
←
→
Page content transcription
If your browser does not render page correctly, please read the page content below
Sixt Leasing SE
Capital Markets Day 2019

                           16 April 2019
Disclaimer
    This presentation contains certain forward-looking statements relating to the business, financial performance and results of the Sixt Leasing SE (together with its
    subsidiaries, the “Company”) and/or the industry in which the Company operates. Forward-looking statements, regardless if made orally or in writing, concern future
    circumstances and results and other statements that are not historical facts, sometimes identified by the words “believes,” “expects,” “predicts,” “intends,” “projects,”
    “plans,” “estimates,” “aims,” “foresees,” “anticipates,” “targets,” and similar expressions. Forward-looking statements, including assumptions, opinions and views of
    the Company or cited from third party sources, are solely opinions and forecasts which are uncertain and subject to risks. Actual events may differ significantly from
    any anticipated development due to a number of factors, including without limitation, changes in general economic conditions, in particular economic conditions in
    the Company’s target markets, changes affecting interest rate levels, changes in competition levels, changes in laws and regulations, environmental damages, the
    potential impact of legal proceedings and actions and the Group’s ability to achieve operational synergies from past or future acquisitions. The Company does not
    guarantee that the assumptions underlying forward-looking statements, regardless if made orally or in writing, are free from errors nor does it accept any
    responsibility for the future accuracy of opinions or any obligation to update the statements in this presentation to reflect subsequent events. Forward-looking
    statements are made only as of the date hereof. Neither the delivery of this presentation nor any further discussions of the Company with any of the recipients
    thereof shall, under any circumstances, create any implication that there has been no change in the affairs of the Company since such date. Consequently, the
    Company does not undertake any obligation to review, update or confirm investors' expectations or estimates or to release publicly any revisions to any forward-
    looking statements to reflect events that occur or circumstances that arise in relation to the content of the presentation.
    Furthermore, a totally different performance can ensue from an unexpected slump in demand or economic stagnation in our key market Germany and/or in other
    Western European markets. The actual development can differ materially from the forecasts made in this presentation, in case one of the aforementioned risks or
    other risks not mentioned here should materialize and/or the assumption on which we have based our forecasts and prospects turn out to be wrong.
    This presentation contains summary information only and does not purport to be comprehensive and is not intended to be (and should not be used as) the basis of
    any analysis or other evaluation. In addition, the information in this presentation is subject to change. No representation or warranty (express or implied) is made as
    to, and no reliance should be placed on, any information, including projections, estimates, targets and opinions, contained herein, and no liability whatsoever is
    accepted as to any errors, omissions or misstatements contained herein.
    The presentation is furnished to you solely for your information and may not be reproduced or redistributed, in whole or in part, to any other person.
    By accepting this presentation you acknowledge the foregoing.

2                                                                                                                                                                             2
Introducing Michael Ruhl, CEO Sixt Leasing SE

                                ▪ Since 1 January 2019: CEO of Sixt Leasing SE
                                ▪ 2013 – 2018: Managing Director of Hannover Leasing
                                  GmbH & Co. KG
                                ▪ Hannover Leasing manages more than 200
                                  investments and mutual funds with a total asset value
                                  of around 10 billion euros
                                ▪ 1997 – 2013: DaimlerChrysler Services Structured
                                  Finance GmbH and DFH Deutsche Fonds Holding AG,
                                  among others as Member of the Board
                                ▪ Before 1997: Various positions at Commerzbank

3                                                                                         3
Agenda

    A   INTRODUCTION                                                 04

    B   HIGHLIGHTS & FINANCIALS FY 2018 // GUIDANCE – BJÖRN WALDOW   06

    C   GROUP STRATEGY & OUTLOOK – MICHAEL RUHL                      18

    D   FLEET LEASING – MICHAEL RUHL                                 27

    E   ONLINE RETAIL – DR. FELIX FRANK                              31

    F   FLEET MANAGEMENT – CHRISTOPH V. TSCHIRSCHNITZ                43

4                                                                         4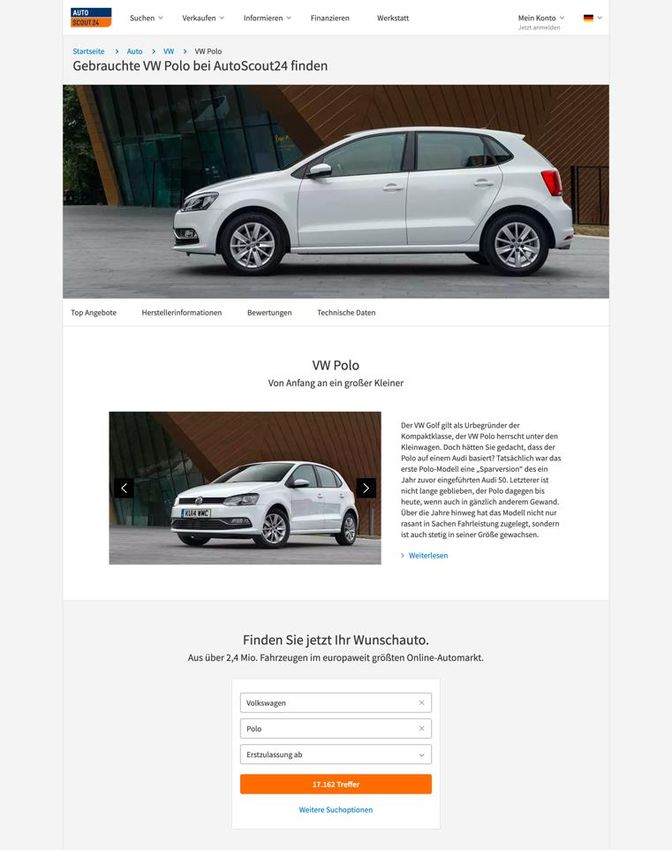
Agenda

    A   INTRODUCTION                                                 04

    B   HIGHLIGHTS & FINANCIALS FY 2018 // GUIDANCE – BJÖRN WALDOW   06

    C   GROUP STRATEGY & OUTLOOK – MICHAEL RUHL                      18

    D   FLEET LEASING – MICHAEL RUHL                                 27

    E   ONLINE RETAIL – DR. FELIX FRANK                              31

    F   FLEET MANAGEMENT – CHRISTOPH V. TSCHIRSCHNITZ                43

5                                                                         5
Introducing Björn Waldow, CFO Sixt Leasing SE

                                ▪ Since 1 April 2015: CFO of Sixt Leasing SE
                                ▪ 2010 – 2015: Sixt SE, Managing Director
                                   Corporate Development, Strategy,
                                   Mergers & Acquisitions, Sales Controlling and
                                   Corporate Risk Management
                                ▪ 2002 – 2010: Roland Berger Strategy Consultants,
                                   Principal
                                ▪ 1995 – 2001: Various positions at Deutsche Bank
                                ▪ Degree in Business Studies and training as a banker

6                                                                                       6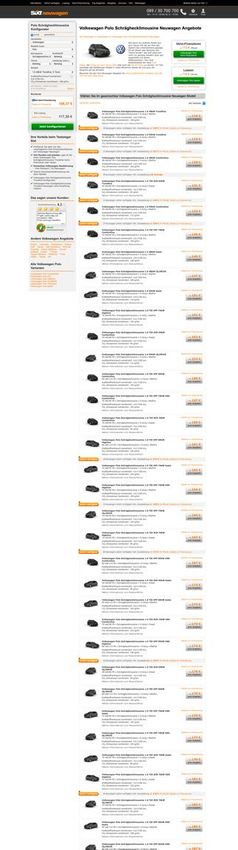
Online Retail became largest business field of Sixt Leasing Group in
    the financial year 2018
    STRONG CONTRACT GROWTH SINCE 2011                                                                         WELL DIVERSIFIED CONTRACT PORTFOLIO
    [# contracts in ‘000]
                                                                                                                    100%
                                                                                      132.9           129.7
        2011: Establishment of
                                                                         113.6                                                                                 – Online Retail
                                                           103.2                                                                     ▪ Private and commercial customers
                                               97.4
                                                                                                                     35%             ▪ Classic leasing and vario-financing + services
                                  76.2
                                                                                                                                     ▪ One-stop online shop with ~35 brands at choice
                    62.2
       56.3                                                                                                        44,700*
                                     2012: Establishment of
                                                                                                                                                          – Fleet Management
       2011         2012          2013         2014         2015          2016         2017           2018                           ▪   Mid-sized and large corporates
                                                                                                                     32%
                                                                                                                                     ▪   Fleet management and consulting
       INCREASING ONLINE SHARE IN NEW BUSINESS                                                                                       ▪   Optimisation of total cost of ownership
                                                                                                                   42,000*
                                                                                   54%
                                                    48%             49%
                     36%            39%                                                                                                                      – Fleet Leasing
                                                                                                                     33%             ▪   SMEs + large corporates
                                                                                                                                     ▪   Full-service leasing
                    2014            2015            2016            2017           2018
                                                                                                                                     ▪   Optimisation of total cost of ownership
                                                                                                                   43,000*
    [Share of Online Retail new contracts out of total Leasing new contracts; excluding 1&1/Peugeot           Portfolio Q4 2018
    campaign in 2017]
                                                                                                              *Number of contracts

7                                                                                                                                                                                       7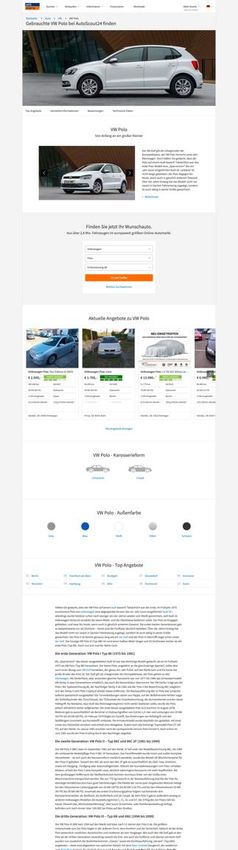
FY 2018: Growth of revenue and earnings – contract portfolio and
    operating return on revenue at around previous year’s levels
                                                                      2018         Change vs. 2017           Guidance
      Group contract portfolio                                       129,700            -2.4%          Around previous year

        ▪ Online Retail                                               44,7001)          -1.6%        10,000-12,000 new contracts

        ▪ Fleet Management                                            42,000            6.6%               Slight increase

        ▪ Fleet Leasing                                               43,000            -10.5%                ~43,000

      Financials

      Operating revenue                                            EUR 480.5 m          5.7%               Slight increase

      EBITDA                                                       EUR 240.8 m          2.8%               Slight increase

      EBT                                                          EUR 30.5 m           2.8%           Around previous year

      Operating return on revenue                                     6.4%              -0.1pp          In line with 6% target

      Equity ratio                                                    15.6%             1.4pp               At least 14%

      Dividend [pay-out ratio]2)                                  EUR 0.48 [45%]          -             30-60% pay-out ratio
    1) Slightly more than 10,000 new contracts
    2) Pay-out ratio based on consolidated profit of EUR 22.0 m

8                                                                                                                                  8
DRIVE>2021 highlights 2018: Focus on improving risk-return profile
    and enabling future growth

         DIGITALISATION               RISK REDUCTION                      DIESEL                REMARKETING

     Online Retail became          Number of Euro-5/4 non-       Proportion of NBB diesel   International used
     largest business field        buyback (NBB) diesel cars     cars in new business       car sales successfully
     of the Group                  in Germany halved             significantly reduced      established

           LOCATIONS                     EXPANSION                 GROWTH FUNDING                 FINANCING

     First own used car sales      Experienced Managing          EUR 1 bn debt issuance     Fully independent
     and delivery/return station   Directors for Online Retail   programme set up           financing structure
     opened near Frankfurt         and Fleet Mgmt. hired                                    achieved

9                                                                                                                    9
Robust risk profile through low stock of older diesel vehicles,
 significant buyback share and diversified remarketing approach
 DECREASING STOCK OF OLDER DIESEL CARS                                                DIVERSIFIED REMARKETING APPROACH
 [Number of Euro 5/4 diesel vehicles in Germany without buyback agreement in ‘000]    [Based on total remarketed vehicles in FY 2018 in Germany; including Fleet Management]

                                                                                                               TOTAL REMARKETED VEHICLES
                        12.2
                                           8.9                                                                 ~55%                                             ~45%

                                                            5.6
                                                                                               Buyback agreement                             No buyback agreement
                                                                               2.8
                                                                                                       ~85%
                                                                                                                                    ‘Cherrypicking’
                                                                                       1
                         2015             2016             2017                2018                                                     ~15%
                                                                                              Sale to
                                                                                             OEM/dealer
         SIGNIFICANT SHARE OF BUYBACK AGREEMENTS

                                                             Non-Buyback (NBB)                         ~20%                              ~30%                              ~50%
                                                                                       2                                 3                                  4
                                   42%
                                                                                                Sale to                        B2B auction                      B2C used car
               Buyback (BB)                             58%                                    customer                         platform                         locations

     [Based on number of vehicles of Sixt Leasing SE as of 31 December 2018]

10                                                                                                                                                                                10
Operating revenue and EBT increased in FY 2018 despite slow-down
in contract growth
Sixt Leasing Group – Key performance indicators 2014 – 20181)
CONTRACT PORTFOLIO [‘000]2) REVENUE [EUR m] EBT [EUR m]4)
Operating
return on 6.0 7.0 7.3 6.5 6.4
revenue [%]4)
CAGR
CAGR EBITDA5) 207.0 230.1 228.6 234.3 240.8
+7%
132.9 129.7 +9% 805.8
744.0
113.6 713.9
665.4 CAGR
103.2 48.1 43.0 +4%
97.4 325.3
575.0 289.6
47.5 235.6 283.9 31.6
Sales 30.3 29.7 30.5
48.3 revenue
147.1
50.2 25.6
39.4 42.0
Fleet
38.7 27.4 28.0 25.6 26.1
Leasing Operating 480.5
33.8 427.9 429.8 430.0 454.4 23.5
Fleet 31.4 Revenue3) Leasing
Mgmt. 45.4 44.7
21.1 27.4 Fleet
Online 15.8 Mgmt. 2.8 3.5 4.1 4.4
2.2
Retail
2014 2015 2016 2017 2018 2014 2015 2016 2017 2018 2014 2015 2016 2017 2018
1) 2014: Figures derived from combined financial statements; due to rounding, individual figures may not always add up to the total figure
2) Including leasing contracts, fleet management contracts, service contracts and order book (contracts for which the leased vehicle has not yet been delivered to the customer)
3) The sum of leasing revenue (i.e. the finance rate, being the financing portion, consisting of interest and depreciation, of the agreed lease instalment) and other revenue from leasing business of the
Leasing business unit as well as fleet management revenue from the Fleet Management business unit
4) The ratio of earnings before taxes (EBT) to operating revenue
5) Earnings before interest, taxes, depreciation and amortisation
11 11Both business units contributed to increase of EBT in FY 2018
EBT development of Sixt Leasing Group and business units 2014 – 20181)
GROUP [EUR m] LEASING [EUR m] FLEET MANAGEMENT [EUR m]
Operating Operating Operating
return on 6.0 7.0 7.3 6.5 6.4 return on 6.1 6.9 7.1 6.3 6.1 return on 5.3 8.7 9.4 8.6 8.0
revenue [%]2) revenue [%] revenue [%]
EBITDA3) 207.0 230.1 228.6 234.3 240.8 EBITDA 200.9 2019.9 224.8 230.0 236.4 EBITDA 2.5 3.1 3.8 4.3 4.5
CAGR
+4%
CAGR
31.6 +3%
30.3 29.7 30.5
25.6 27.4 28.0
25.6 26.1
23.5
CAGR
+19%
4.1 4.4
3.5
2.8
2.2
2014 2015 2016 2017 2018 2014 2015 2016 2017 2018 2014 2015 2016 2017 2018
1) 2014 figures derived from combined financial statements; due to rounding, individual figures may not always add up to the total figure
2) Ratio of EBT to operating revenue
3) EBITDA = Earnings before interest, taxes, depreciation and amortisation
12 12Lease assets of more than EUR 1.2 bn – Solid equity ratio of 16.4%
Sixt Leasing Group – Development of key balance sheet figures 2015 – Q1 20191)
TOTAL ASSETS [EUR m] FINANCIAL LIABILITIES [EUR m]2) EQUITY [EUR m]
Net debt Equity
[EUR m] 781 844 1,054 1,020 975 ratio [%] 16.0 16.6 14.2 15.6 16.4
1,443
1,393 1,359
224 188 1,060
1,172 207 1,026
1,113 976
151 848 201
Other 155 800 173
472
Current 32 222.6
207 216.8
194.7 205.1
178.3
1,219 1,204 1,152
Lease 1,021
assets
958 768 826 803
641 587
Non-
current
2015 2016 2017 2018 Q1/19 2015 2016 2017 2018 Q1/19 2015 2016 2017 2018 Q1/19
1) 2014 figures derived from combined financial statements; due to rounding, individual figures may not always add up to the total figure
2) Including liabilities to related parties until 2017
13 13Fully independent financing structure of Sixt Leasing Group after
repayment of EUR 190 m to Sixt SE achieved in June 2018
Sixt Leasing Group – Maturities of financial liabilities as of 31 December 2018 [EUR m]
FINANCIAL LIABILITIES1) 2019 2020 2021 2022 2023 Total FINANCING INSTRUMENTS
Asset backed securities
154 154 96 37 2 443 ▪ EUR 500 m ABS programme
(ABS) programme
Bank loans 37 - - - - 37 ▪ > EUR 400 m bilateral credit lines
Bonds2) - - 250 250 - 500 ▪ EUR 1 bn debt issuance programme
Borrower's note loans
- 30 - - - 30
(Schuldscheindarlehen)
Finance leases 4 8 3 - - 15 FINANCING STRATEGY
Total 195 192 349 287 2 1,026 ▪ Balancing out fleet growth and
equity ratio
Bank balances / cash 6
▪ Dividend pay-out ratio of 30-60%
Net debt 1,020 of consolidated profit
1) Nominal repayment amounts; excluding future accrued interest; due to rounding it is possible that individual figures may not exactly add up to the total amount
2) Bond 2017/2021 is a stand-alone bond; Bond 2018/22 is first bond under the debt issuance programme
14 14Attractive dividend policy supported by successful significant
reduction of average refinancing rate since IPO
DIVIDEND PER SHARE [IN EUR] AVERAGE REFINANCING RATE
Net interest
37% 40% 47% 45% Pay-out ratio 21.2 19.5 16.2 13.2 payments
[in EUR m]
4.2%
2.5%
2.4%
2.7% Dividend yield1)
2.5%
2.1%
1.7%
0.48 0.48 0.48 1.3%
0.40
Dividend policy:
Pay-out of 30-60%
of consolidated profit
2015 2016 2017 2018 2015 2016 2017 2018
[Calculated as net interest payments/average net debt; net interest payments = financial
result without result from at-equity measured investments]
1) Based on the Xetra year-end price
15 152019 forecast and medium-term outlook – Strong growth of contract
portfolio, operating revenue and EBT expected by FY 2021
2019 2021 Change 2021 vs. 2018
Contract portfolio
Group Slight increase ~ 200,000 ~ 50%
Financials
Operating revenue Around previous year ~ EUR 650 m ~ 35%
EBT Around previous year EUR 40-45 m ~ 40%
For H1-2019, business
development is expected to be
significantly weaker than in
H1-2018 as well as the expected
business development in
H2-2019.
16 16Agenda
A INTRODUCTION 04
B HIGHLIGHTS & FINANCIALS FY 2018 // GUIDANCE – BJÖRN WALDOW 06
C GROUP STRATEGY & OUTLOOK – MICHAEL RUHL 18
D FLEET LEASING – MICHAEL RUHL 27
E ONLINE RETAIL – DR. FELIX FRANK 31
F FLEET MANAGEMENT – CHRISTOPH V. TSCHIRSCHNITZ 43
17 17Sixt Leasing has a strong market position and crucial capabilities
inhouse to benefit from various megatrends
MEGATRENDS MARKET POSITION CAPABILITIES
▪ Mobility #1 mobility brand 2 well-known online platforms
for new vehicles
▪ Using instead of owning
#3 independent full-service car
▪ Car-as-a-service leasing provider in Germany 360°proprietary developed IT
platforms and products
▪ Digitalisation
3 unique business fields with
▪ E-commerce individual strengths, leveraging >70 in-house IT developers
on a common core and project managers
▪ Outsourcing
>4,000 service partners in Well diversified
▪ Smart data Germany customer base and contract
portfolio
18 18Rising demand for mobility – Cars will continue to play key role –
New mobility solutions will increase in importance
Development of mobility demand by transport mode (EU-28) [trillion passenger km]1)
FORECAST CAGR CAGR
HISTORICAL
‘10-‘16 ‘16-‘25
6.6 6.7 0.7% 1.3%
6.3 6.5
6.0 6.2
5.7 5.7 5.8 5.8 5.7 5.8 19% 19% 19% 0.8% 1.3%
5.4 5.5 19% 19%
19%
18% 18% 18% 18% 18% 18% 7% 9%
18% 2% 4% 5% 1.4% 21.9%
Public transport 19% 1% 2% 2%
1% 1% 1% 1%
Shared car 1% 1%
81% 81% 81% 81% 80% 79% 79% 77% 76% 74% 72% 0.7% 0.2%
Exclusive car 80% 81% 81%
2000 2002 2004 2006 2008 2010 2012 2014 2016 2018 2020 2022 2024 2025
1) Source: Roland Berger, Embracing the Car-as-a-Service model – The European leasing and fleet management market, 2018
19 19carefree
VISION multi-brand
flat rates
flexible offerings
usage models
We aim to become the automated
processes
convenient
online processes
full-service
packages
leading provider of digital
car sales
fast online
longer-term auto mobility autonomous
configuring and
ordering
driving AUTOMATED
in Europe. cost-saving
outsourcing of
fleet management
complex MISSION
offline
long-term
processes
ownership
We facilitate the
longer-term auto mobility
time-consuming analogue
purchasing car sales
traditional
cost-intensive
dealers of our customers with
internal fleet
management single-service
agreements
best-in-class individualised
brand
loyalty solutions.
20DRIVE>2021 programme continues to provide framework for
strategic progress over the coming years
D igitalisation R isk-return profile I nternationalisation V olume &
▪ Build scalable ▪ Further diversify ▪ Strengthen position ▪ Increase contract
platforms/back-ends customer structure in home market portfolio to
▪ Further digitalise via increasing share ▪ Better exploit ~ 200,000 contracts
internal, customer of smaller customers potential of existing ▪ Increase operating
and servicing ▪ Reduce share of Fleet Management revenue to
processes older diesel vehicles foreign subsidiaries ~ EUR 650 m
▪ Improve digital ▪ Open own used car ▪ Enter new markets
customer experience remarketing stations in Fleet
Management
▪ Develop digital
products
▪ Increase number of
international dealers ▪ Internationalise
E arnings growth
connected to B2B Online Retail
remarketing platform business beginning ▪ Increase EBT to
from 2020 EUR 40-45 m
21 21In 2019 we are addressing 10 action fields to further develop our
business model in line with our vision (I)
TODAY TOMORROW
Car leasing with fixed term & mileage Flexible car usage/subscription
PRODUCTS New cars only Used car leasing
Service products as part of leasing contract Service products stand-alone & on-demand
Customer service largely via call centre App-supported self-service functions
CUSTOMER
EXPERIENCE
Delivery/return via third party Delivery/return also via self-operated stations
22 22In 2019 we are addressing 10 action fields to further develop our
business model in line with our vision (II)
TODAY TOMORROW
Focus on mid-sized and large fleets Target smaller fleets with dedicated approach
SEGMENTS
Fleet management Corporate mobility management
& MARKETS
Focus on Germany Gradual international expansion
Still several manual and analogue processes Digital processes for customers and internally
PROCESSES
Business field-centric mentality Leverage more synergies across business fields
23 23Strategic measures intend to support domestic fleet and service
growth accompanied by international expansion
Schematic representation of operating revenue and contract bridge until 2021 ~ 200,000
contracts
INT.
~ EUR
GROWTH
650 m
▪ Better exploit potential
SERVICE
in existing foreign
GROWTH subsidiaries (sales
activities, knowledge
DOMESTIC ▪ Service penetration transfer)
▪ Stand-alone services ▪ Follow existing
129,700 FLEET ▪ On-demand service customers abroad
contracts GROWTH upselling ▪ Establish hubs
▪ New service products ▪ Enter new markets
▪ Sales & Marketing ▪ Fleet Management ▪ Opportunistic M&A
EUR ▪ New products ▪ New tools
481 m ▪ Customer experience ▪ Cooperations
▪ Retention rate
▪ Campaigns/
cooperations
▪ Opportunistic M&A
2018 2021
24 24Operational optimisation measures aim to complement fleet and
service growth to lift EBT to EUR 40-45 m until 2021
Schematic representation of EBT bridge until 2021
EUR 40-45 m
OPERATIONAL
OPTIMISATION
▪ Digitalisation
SERVICE ▪ Customer self-service
GROWTH ▪ Cost optimisation
▪ More efficient
processes
▪ Synergies across
EUR 30.5 m business fields
▪ Improved
FLEET time-to-market
MARKETING GROWTH ▪ Product and pricing
IT differentiation
PERSONNEL ▪ Economies of scale
2018 2021
25 25Agenda
A INTRODUCTION 04
B HIGHLIGHTS & FINANCIALS FY 2018 // GUIDANCE – BJÖRN WALDOW 06
C GROUP STRATEGY & OUTLOOK – MICHAEL RUHL 18
D FLEET LEASING – MICHAEL RUHL 27
E ONLINE RETAIL – DR. FELIX FRANK 31
F FLEET MANAGEMENT – CHRISTOPH V. TSCHIRSCHNITZ 43
26 26Future growth of full-service fleet market is expected to primarily
come from the smaller fleet segment
NEW VEHICLE REGISTRATIONS IN GERMANY1) RISING MARKET POTENTIAL IN SME SEGMENT
[Forecasted car-as-a-service market development in EU-18 in EUR bn]2)
Manufacturers Private
& car dealers customers CAGR
FORECAST ‘16-‘25
28% 34%
86.3 5.0%
3.7 m vehicles 79.6
14.1 7.4%
71.2 13.1
> EUR 100 bn
65.1 7.8 51.2%
market 60.4 11.7 5.1
11%
55.5 10.4 2.3
15% 9.0 1.0
Rental 12% Private 7.5 0.5 24.0 6.4%
22.8
cars Small Mobility providers 0.2 20.1
15.9 17.8
business SME 14.0
Corporate
fleets customers
35.9 37.1 38.7 39.8 1.8%
~ 450,000 vehicles p.a. Corporate 33.8 35.0
- thereof 47%: smaller fleets (100 vehicles)
2016 2018 2020 2022 2024 2025
1) Source: Dataforce 2018/2017, Statista.com
2) Source: Roland Berger, Embracing the Car-as-a-Service model – The European leasing and fleet management market, 2018
27 27Long-lasting relationships with key customers – moderate customer
concentration
FLEET LEASING CUSTOMER TYPE FLEET LEASING CUSTOMER STRUCTURE1)
[as of 31 December 2018]
Duration of relationship with top 10 customers
20 years
5% 18% 39% 38%
Multi Supply Single Supply Average length of relationship = 18 years
44% Customer concentration
47%
Top
Customers 2-10 Other customers
customer
42% 47%
11%
9% Top 10 customers = 53%
Dual Supply
Contract expiration
2019 2020 2021 2022+
42% 28% 22% 8%
Average term = 39 months
1) Based on Fleet Leasing contracts in Germany as of 31 December 2018 (except order book and service contracts); average term incl. foreign countries
28 28With the establishment of Sixt Leasing’s local sales activities a new
customer group with an attractive margin potential is targeted
CUSTOMERS WITH 20-80 VEHICLE FLEET
ANCHORING BUSINESS
BOOST SALES ▪ Further strong
contract growth
▪ Promising lead
SET UP TEAM pipeline ▪ Anchoring small fleet
customer segment as
▪ Local sales team set ▪ Ambitious new further mainstay and
PILOTING PHASE
up in five regions business targets growth area within
▪ Development of offer across Germany Fleet Leasing
▪ Substantial increase business field
calculator & technical
▪ Significant increase of contracts expected
standard profile
of customer base ▪ Further diversification
▪ Finalising of product of Sixt Leasing’s
▪ First customers won
standardisation customer portfolio
2017 2018 2019 2020+
29Agenda
A INTRODUCTION 04
B HIGHLIGHTS & FINANCIALS FY 2018 // GUIDANCE – BJÖRN WALDOW 06
C GROUP STRATEGY & OUTLOOK – MICHAEL RUHL 18
D FLEET LEASING – MICHAEL RUHL 27
E ONLINE RETAIL – DR. FELIX FRANK 31
F FLEET MANAGEMENT – CHRISTOPH V. TSCHIRSCHNITZ 43
30 30Introducing Dr. Felix Frank, Managing Director Online Retail
▪ Since 1 January 2019: Chief Digital Officer (CDO) and
Managing Director Online Retail
▪ 2012 – 2018: Vice President Customer Product and
Marketing at the Scout24 Group, heading the operational
management of the digital marketplace AutoScout24 as well
as the marketing and product strategy for the dealer,
manufacturer and private seller business
▪ More than ten years of professional experience in the fields of
e-business, innovation management and pricing
▪ 2006 – 2012: Boston Consulting Group, core member of
technology, media and telecommunication practice
▪ Doctorate in technology marketing and customer relationship
management
▪ Degree in international computer science
31 31Two important secular market trends in our favour
SHIFT TO ONLINE USING INSTEAD OF OWNING
[Online share of direct sales in selected industries; Germany]1) [Increasing demand for subscription models]
38%
29%
26%
16%
12%
2%
New Living/ Jewellery/ Fashion Consumer Travel
cars furniture watches Electronics
New car sales just at the beginning of (All-inclusive) subscriptions becoming
digitalisation wave preferred paradigm
1) Sources: DAT-Report 2019; own estimates; HDE, Online Monitor 2018; FUR, ReiseAnalyse 2018
32 32Significant pent-up potential for online sales
INFORMATION BEHAVIOUR DEALER VISITS ONLINE SALES DEMAND
[Share of new car buyers using the internet as [Average dealer visits of new car buyers; Germany]2) [Readiness to order a car online; Germany]3)
information source; Germany]1)
+29% -45%
81% 3.3 Online
ready
63% Not online 34%
ready
1.8
66%
2013 2018 2015 2018
Information phase already Almost two thirds of car
happening almost purely Only 0.8 additional dealers buyers are ready to order the
online visited for car purchases next car online
1) DAT-Report 2014; DAT-Report 2019
2) Sources: DAT-Report 2019; own estimates; HDE, Online Monitor 2018; FUR, ReiseAnalyse 2018
3) Source: MHP, Online Car Sales 2018
33 33Usage based models catalyst for online sales
NEW CAR COST IN COMPARISON DEMAND FOR CAR SUBSCRIPTION ROCKETING
[in EUR]1) [Google search volume ‘auto abo’]
Average
e-commerce basket
72
Skoda Citigo
(48/10 leasing rate)
75
Average maximum
online spend
1,353
Skoda Citigo
(Min leasing 1,414
commitment)
Skoda Citigo
(Cash purchase)
9,870
08/18 09/18 10/18 11/18 12/18 01/19 02/19 03/19
Leasing rate in line with typical Subscription category for cars seeing strong
e-commerce spending amounts demand growth
1) Sources: IntelliAd, E-Commerce Branchenindex; Skoda Citigo leasing rate and list price based on prices on sixt-neuwagen.de
34 34Sixt Neuwagen ideally positioned against these trends: #1 new car
sales and fully fledged fleet operations at scale
STRONG BRAND AWARENESS LARGE USER BASE FLEET OPERATIONS AT SCALE
[Supported brand awareness of online vehicle platforms]1) [Example: Sixt Leasing service & dealer network in Germany]
1,379,000
AutoScout24 87,3
mobile.de 85,5
Sixt-Neuwagen.de 53,7 260,700
Meinauto.de35 39,5
+ many other key
functions already
autohaus24.de 35,5
44,700 at scale:
- Procurement
12neuwagen.de 27,3 - Remarketing
Contract Registered Website - Customer service
carneoo.de 7,5 portfolio users visits/ -…
month Workshop/garage Dealer
Sixt Neuwagen is strongest Sixt Neuwagen has a very Sixt Neuwagen already has the
online new vehicles brand in large addressable user infrastructure to run an all-
Germany base inclusive subscription model
1) Own survey
35 35Our way forward
1
Establish a digital culture and organisation ▪ Time to market
Digital culture and as basis to effectively develop best-in-class ▪ Effectiveness
organisation digital products and services ▪ Talent acquisition
2
Step up website UX and operational ▪ Retention rate
Best customer experience processes in order to deliver a best-in-class ▪ Repurchase rate
customer experience both on- and offline 36 ▪ Cost per sale
3
More user group-specific differentiation in ▪ Addressable
Customer specific proposition and go-to-market to better audience
propositions address user needs ▪ Conversion rate
x Deep dive in following
36 362 Best customer experience: Ordering process with headroom for
improvement… and we already proved what is possible
LEADS PER FTE1) CREDIT CHECKS PER FTE1) CONVERSION TIME2)
+56% x4.5 -33%
Regular Fully digital Regular Fully digital Regular Fully digital
Fully digital sales and ordering Number of processed credit Time to close sales was
process and pre-defined product checks was increased significantly significantly reduced, leading to
enable handling of significantly due to pre-registration by the client higher customer satisfaction and
more leads per FTE and automated preliminary checks conversion rates
1) Regular: 2017 except March and April; Digital: March 2017 2) Regular: All 2017 new contracts without 1&1 campaign; Digital: 1&1 contracts
37 372 Best customer experience:
Significant improvement potential in UX
CURRENT SIXT-NEUWAGEN LANDING PAGES EXAMPLE: AUTOSCOUT24 LANDING PAGE
38 383 Customer group-specific propositions: clear user groups help to
build targeted propositions
Buying criteria importance
CHARACTERISTIC Choice Price Convenience OUR PROPOSITION
Emotional approach to ▪ Build-to-order cars with best-in-
car buying and very class configurator & competent
specific and detailed sales consultants
preferences on make, Detailed Flexible on Perfect
configu- budget for buying ▪ Leasing/ Vario-financing as
Car Fan model and extras ration dream car experience means to afford dream car
Classic smart shopper
who is triggered by Special campaign offers with no/
discounts rather than low customization at very
concrete models Flexible on Fully deal- Simplicity in attractive rates
model driven decision-
Deal Maker making key
Utilitarian view on cars; Worry free with all-inclusive
high aversion of package, potentially with lower
potential unplanned cost Brand as Flexible on Peace-of- commitment requirements
and long commitment ‘insurance‘ model to mind key (currently in development)
Security Seeker for quality match budget
39 393 Customer group-specific propositions: Sixt Leasing ideally
positioned for worry-free proposition (with growing demand)
OEMs Marketplaces Startups Captives Sixt Leasing
Strong brand, no
CONSUMER REACH ~ direct contact ✓ ✓
Car variety/ configuration ~ ✓ ~ 10-20 models ✓ ✓
PROPOSITION
Subscription pricing ✓ ✓ ~ Deferentfacto,positioning
but dif-
Flexibility/ low committment ✓
Several add-on
Worry-free package ✓ ✓ ~ services
Sourcing ✓ ✓ ✓ ✓
Handover logistics ✓ ~ Via 3rd party Potentially
dealers
via
✓ Already at
OPERATIONS
scale with
Service operations ✓ ~ Via 3rd party Potentially
dealers
via
✓ high margins
Customer service Potentially
dealers
via
✓ Not at scale ✓ ✓
Remarketing Potentially
dealers
via
~ Via 3rd party ✓ ✓
Financing Potentially
captives
via
~ Via 3rd party ✓ ✓
Sixt Leasing with fully fledged operations at scale –
and opportunity to expand service penetration as additional margin source
Analysis based on AIM group classified intelligence report Vol 19 No 23a, Dec 2018
40 40Our plan
3
Rocketing
2
Fixing
&
Innovating
1 ✓
Analysed
41 41Agenda
A INTRODUCTION 04
B HIGHLIGHTS & FINANCIALS FY 2018 // GUIDANCE – BJÖRN WALDOW 06
C GROUP STRATEGY & OUTLOOK – MICHAEL RUHL 18
D FLEET LEASING – MICHAEL RUHL 27
E ONLINE RETAIL – DR. FELIX FRANK 31
F FLEET MANAGEMENT – CHRISTOPH V. TSCHIRSCHNITZ 43
42 42Page 43
Introducing Christoph v. Tschirschnitz, Managing Director
Sixt Mobility Consulting
▪ Since 1 November 2018: Managing Director
Sixt Mobility Consulting GmbH
▪ 2014 – 2018: President and CEO of the BMW Group
Region Central & Southeastern Europe
▪ 2008-2014: Member of the BMW Group Germany
management, leading the Corporate & Direct Sales
business segment
▪ 2014 – 2008: Director Sales & Marketing for the BMW
sales region Asia, Pacific, Africa and Eastern Europe
▪ Further management positions at BMW Group in the
fields Corporate Control/M&A, Distribution Channels
Strategy and at BMW MotorradPage 44
Business model and scope of service
We manage corporate fleets on behalf of companies with a broad range
of services.
We add value to the business of our corporate customers by using
our vast experience & technologies in managing fleets and our
purchasing power to buy car-related technical services.
We consult companies on corporate mobility options with the aim
to provide attractive and efficient individual mobility for their employees.
Beyond managing the traditional company car we offer
innovative and more modular means of individual mobility to corporates.Page 45
Sixt Mobility Consulting acts as intermediary between its
corporate customers, their mobility users and suppliers
CORPORATE CUSTOMER
▪ Consulting ▪ Mandate for fleet
▪ Reporting management
▪ Invoicing ▪ Budget for employees
Full range of corporate mobility
solutions for employees
Employee 1 Employee 2 Employee 3
− Car sharing budget − Classic company car − Mobility budget
− Public transport allowance − Ride-hailing budget − Company bikePage 46
We do have a strong base for serving our corporate
customers across Europe
COMPANY STRENGTHS CUSTOMER PROPOSITION
✓ Very strong mobility brand ✓ Consulting based on decades-long
creates trust and attractiveness fleet management experience
✓ 42,000 vehicles under management ✓ Adding value for our customers through
optimisation of total cost of ownership
✓ Vast experience and knowledge
of fleet management ✓ We offer modular individual solutions
✓ Strong track record of cost-efficient ✓ Supplier-neutral sourcing and consulting
operations
✓ Simplification of fleet management processes
✓ We cooperate with any leasing
company or supplier ✓ Full-service car user support
✓ Comprehensive range of services 2 stakeholders
within company
✓ Deep integration with customer
(both in terms of mobility and IT) FLEET MANAGER CAR USERPage 47
Future growth is especially supported by three developments
1
MARKET 2
DIGITALISATION 3
▪ >12 million fleet cars in
INNOVATIONS
Europe
▪ We re-shape our business
▪ Strong trend to outsourcing model by digitalising of our
corporate fleets operations until the end of ▪ Rising demand for modular
▪ Growing demand for 2019 corporate mobility due to
additional types of changing customer needs
▪ Growing scalability of our
individual corporate mobility resources ▪ We have access to all kinds
▪ Our European scope and ▪ Company growth will of innovative modular
growing presence disconnect from labour mobility serviced by all
costs kinds of suppliers
▪ Rising profitabilityPage 48
1
Sixt Mobility Consulting targets a huge market in Europe
LARGE MARKET POTENTIAL HIGH CONCENTRATION ATTRACTIVENESS OF SME
[Cars under management in EU-18 in million]1) [Cars under management in EU-6]1) [Subdivision of vehicles in corporate fleets in DE]2)
3.1 1.000+
Light commercial
vehicles (LCV) LCV 0.6 16%
2.4 2.4 500-999
2.3 6% 20-99
0.5 Germany
0.8 300-499 6% 52%
1.7
>12m cars 0.2
20%
in Europe PV 2.5
0.9 100-299
1.9 0.1 0.7
1.6 1.5
10.4 0.1
0.8 0.6 ~ 450 fleets
Passenger
vehicles (PV) DE FR UK IT NE ES ~ 1,700 fleets
~ 17,500 fleets
More than 12 million company cars ~ 11 million serviced company cars in Large untapped potential in the
are serviced in Europe only six European countries < 300 vehicle fleet segment
1) Source: Roland Berger, Embracing the Car-as-a-Service model – The European leasing and fleet management market, 2018
2) Dataforce 2017Page 49
1
Sixt Mobility Consulting expands in Europe
WHY INTERNATIONALISING
▪ Making use of further large
market potential in Europe
▪ Serving transnationally
operating companies UK OUR EXPANSION PLAN
NL
demanding transnational fleet NL
management services DE ▪ Boost French business in a
▪ Leveraging synergies market with large fleets
across countries FR CH AT
AT ▪ Re-establish our Dutch
operations
▪ Expand our Swiss operations
IT
▪ Establish SMC Austria as hub
ES
for Eastern Europe
▪ Prepare new market entries
in UK, Italy and Spain
▪ Opportunistic M&A
Home market Existing foreign subsidiaries New target countries (acquire local competitors)Page 50
Sixt Mobility Consulting strengthens the operating model 2
with the aim to grow fast and profitably
TOMORROW
DIGITAL OPERATIONS
TODAY
SCALABILITY OF
CALL-CENTRE BASED RESOURCES
USER SERVICES DIGITALISING
▪ Labour-intensive services ATTRACTIVE SERVICES
THE OPERATING
24/7 TO USERS
▪ Costly MODEL OF SMC
▪ Analogue
IN 2019 REDUCE COST
▪ Cumbersome
PER SERVICE
INCREASING
PROFITABILITYPage 51
Our new app is the core of our future business operations – 2
starting in June 2019
Our All-New Fleet Management App
‘THE COMPANION’
Shifting service operations from employees to digital self-service
CORE FUNCTIONALITIES OF THE APP
▪ Fleet users are able to carry out entire company
car-related tasks by themselves
▪ Messenger service for communication between
fleet manager and car user
▪ The app is customizable to specific company
needs, e.g. car policy, sourcing, etc.
THE COMPANION will become the new all-in-one touch point for corporate car usersPage 52
Our new app aims to further improve service levels, user 2
experience and easy-of-use for corporate car users
TOP FEATURES OF 1.0 VERSION
▪ Dynamic start page reminds users
of upcoming tasks, e.g. book a
workshop appointment
▪ Workshop online appointment tool
to easily arrange online workshop
appointments
▪ Appointment overview
▪ Workshop finder map
▪ FAQ pages for accident and
breakdown situations
▪ ‘Click to Call’ function –
Sixt Assistance hotline numberPage 53
3
We shape the future of corporate mobility
TRADITIONAL CHANGING MOBILITY FUTURE OF
CORPORATE MOBILITY CORPORATE MOBILITY
NEEDS OF EMPLOYEES
Employee receives or demands ▪ Especially employees working in Mobility demands of employees
company car larger cities increasingly use vary significantly
alternative mobility solutions
instead of a car
▪ Company car loses motivational
Employer provides company car to character for some employees Employer wants to keep pace with
employee ▪ Alternative and innovative mobility talent requirements
concepts (like mobility budgets, car
sharing, ride-hailing, company
bikes, etc.) find their way into
Car is managed by internal or corporations Companies look for a full-range
external fleet manager corporate mobility provider/manager
with digital servicesPage 54
Summary
1
MARKET 2
DIGITALISATION 3
✓ >12 million serviced INNOVATIONS
company cars in Europe
✓ Introduction of
✓ Increasing market ‘THE COMPANION’ app
potential ✓ We address the changing
✓ User self-service adds customer needs
✓ Clear international value for customers and
expansion roadmap investors ✓ SMC is best positioned to
benefit from this trend
✓ Scalable platform will
support further growth ✓ Product innovations will
support growthHighlights
Ten action fields identified on the Group level to achieve significant
1 growth of contract portfolio, operating revenue and EBT until 2021
Favourable market trends and customer segmentation open up
2 further potential on top of underlying growth in Online Retail
Digitalisation and internationalisation deliver substantial value and
3 growth upsides in Fleet Management
Smaller fleets present attractive margin potential within competitive
4 Fleet Leasing market and support diversified customer base
Attractive dividend policy backed by resilient risk-return profile
5 and significant reduction of refinancing rate since IPO
55 55Q&A 56 56
Contact details

     ADDRESS             INVESTOR RELATIONS

     Sixt Leasing SE     Stefan Kraus
     Zugspitzstrasse 1   Sixt Leasing SE
     82049 Pullach       T: +49 89 74444 4518
     Germany             F: +49 89 74444 84518
                         Email: stefan.kraus@sixt-leasing.com

57                                                              57
Appendix 58 58
Sixt Leasing Group: Revenue and earnings performance FY 2018
     in EUR million                               2018    2017     Change in %

          Operating revenue                      480.5    454.4             5.7
          Sales revenue                          325.3    289.6            12.3
     Consolidated revenue                        805.8    744.0             8.3
          thereof Leasing business unit          705.0    637.8            10.5
        thereof Fleet Management business unit   100.8    106.1            -5.0
     Fleet expenses and cost of lease assets     -508.0   -460.7           10.3
     Personnel expenses                           -36.5    -33.0           10.4
     Net other operating income/expense           -20.4    -16.0          -28.0
     EBITDA                                       240.8    234.3            2.8
     Depreciation and amortisation               -197.1   -188.3            4.7
     Net finance costs                            -13.2    -16.2           18.6
     EBT                                          30.5     29.7              2.8
     Operating return on revenue1)                 6.4      6.5      -0.1 points
     Income tax                                   -8.6     -8.8            -2.6
     Consolidated profit                          22.0     20.9             5.1
     Earnings per share (in EUR)                  1.07     1.01               -

     1) Ratio of EBT to operating revenue

59                                                                             59
Sixt Leasing Group: Further KPIs FY 2018
31 Dec 2018 31 Dec 2017 Change in %
Group contract portfolio 129,700 132,900 -2.4
thereof Online Retail 44,700 45,400 -1.6
thereof Fleet Leasing 43,000 48,100 -10.5
thereof Fleet Management 42,000 39,400 6.6
in EUR million
Total equity and liabilities 1,392.7 1,442.8 -3.5
Lease assets 1,204.4 1,219.2 -1.2
Financial liabilities1) 1,026.1 1,059.8 -3.2
Equity 216.8 205.1 5.7
Equity ratio (%) 15.6 14.2 1.4 points
2018 2017
Gross cash flow 247.8 216.7 14.3
Investments in lease assets 475.7 619.2 -23.2
1) Current and non-current financial liabilities; as of 31 December 2017 including EUR 190.0 m Core Loan and EUR 3.9 million other liabilities to related parties
60 60You can also read