ONE STRATEGY ALL FOR AND FORALL - SIXT Group
←
→
Page content transcription
If your browser does not render page correctly, please read the page content below
ONE
STRATEGY
             ALL FOR
             AND     FOR ALL

SIXT SE
INVESTOR PRESENTATION
JUNE 2021                      1
This presentation (together with the presenters’         further discussions of the Company with any of       Presentation contains summary information only
             speeches and any other related verbal or written         the recipients thereof shall, under any              and does not purport to be comprehensive and is
             communications the “Presentation”) contains              circumstances, create any implication that there     not intended to be (and should not be used as)
             forward-looking statements relating to the               has been no change in the affairs of the             the basis of any analysis or other evaluation. In
             business, financial performance and results of           Company since such date. Consequently, the           addition, the information in the Presentation is
             Sixt SE (together with its subsidiaries, the             Company does not undertake any obligation to         subject to change. No representation or warranty
             “Company”) and/or the industry in which the              review, update or confirm expectations or            (express or implied) is made as to, and no
             Company operates. Forward-looking statements             estimates or to release publicly any revisions to    reliance should be placed on, any information,
             concern future circumstances and results and             any forward-looking statements to reflect events     including projections, estimates, targets and
             other statements that are not historical facts,          that occur or circumstances that arise in relation   opinions, contained herein, and no liability
             sometimes identified by the words “believes,”            to the content of the Presentation. Furthermore,     whatsoever is accepted as to any errors,
             “expects,” “predicts,” “intends,” “projects,” “plans,”   a totally different performance can ensue from an    omissions or misstatements contained herein.
             “estimates,” “aims,” “foresees,” “anticipates,”          unexpected slump in demand or economic               Due to rounding it is possible that figures may
             “targets,” and similar expressions. Forward-             stagnation in our key markets. The actual            not add up exactly and that half or full year
             looking statements, including assumptions,               development can differ materially from the           figures do not correspond to added quarterly
             opinions and views of the Company or cited from          forecasts made in this Presentation, in case one     figures. For the same reason, percentages may
DISCLAIMER   third party sources, are solely opinions and             of the aforementioned risks or other risks not       not exactly match absolute numbers they
             forecasts which are uncertain and subject to             mentioned here should materialize and/or the         correspond to.
             risks. Actual events may differ significantly from       assumption on which we have based our
             any anticipated development due to a number of           forecasts and prospects turn out to be wrong.        The Presentation does not constitute or form part
             factors, including without limitation, changes in                                                             of, and should not be construed as, an offer,
             general economic conditions, in particular in the        Certain industry and market information in the       solicitation or invitation to subscribe for,
             Company’s target markets and changes in                  Presentation and/or related materials has been       underwrite or otherwise acquire, any securities of
             competition levels. The Company does not                 obtained by the Company from third party             the Company nor should it or any part of it form
             guarantee that the assumptions underlying                sources. The Company has not independently           the basis of, or be relied on in connection with,
             forward-looking statements are free from errors          verified such information and neither the            any contract to purchase or subscribe for any
             nor does it accept any responsibility for the future     Company nor any of its directors provides any        securities of the Company, nor shall it or any part
             accuracy of opinions or any obligation to update         assurance as to the accuracy, fairness or            of it form the basis of or be relied on in
             the statements in the Presentation to reflect            completeness of such information or opinions         connection with any other investment
             subsequent events. Forward-looking statements            contained in this document and neither the           whatsoever.
             are made only as of the date of the Presentation.        Company nor any of its directors takes any
             Neither the delivery of the Presentation nor any         responsibility for such information. This                                                                  2
We don‘t want to be the
 largest mobility player
  on the planet, but the
 most profitable one,
thereby creating above
  average returns for
      our stakeholders.
                  ERICH SIXT

                               3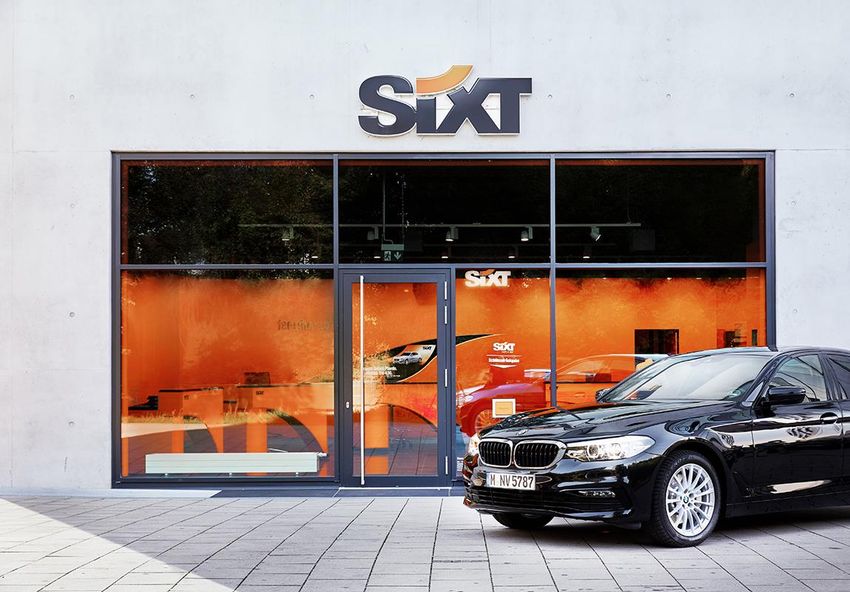
SIXT share
                                                                         price development

1960s                                                                                                     2008
one of the first car-leasing        1976                              1986                                SIXT is the first car rental                               2015                                2020
companies is created by              Regine Sixt joins                the initial public offering of      company in the world that      2011                        SIXT leasing initial public         SIXT sells its stake in Sixt
Erich Sixt                          the company                       SIXT AG                             enables booking via iPhone     SIXT enters the USA         offering                            Leasing for EUR 163 m

                      1970                               1977                                 1990                                        June 9th 2011              2015                  2019
                      SIXT adds vans and                 the company has                      SIXT is Germanys biggest                    foundation of DriveNow –   Alexander &           ONE Launch: SIXT
                      trucks to the fleet                branches at every major              car rental with more than                   a joint venture with BMW   Konstantin SIXT       becomes an integrated
                                                         German airport                       1,500 employees and over                                               join Managing         mobility service provider
                                                                                              1,000 branches                                                         Board of Sixt SE                                            4
EXPERIENCE & CONTINUITY                                                                                                                       TECH

THROUGH FAMILY OWNERSHIP
SIXT MANAGEMENT TEAM years with SIXT

                                                                                                              James                 Klaus
                                                                                                              Adams                 Kolitz
                                            16                12                                        President eCommerce &        CTO
                                                                                                            Revenue Mgmt.
                                     Konstantin         Alexander                                               former               former
                                                                                                            booking.com &           Trivago
                                        Sixt               Sixt                                             rentalcars.com
                                             Co-CEOs

                                                                                                                                 OPERATIONS
                                     17                 1              1
                              Nico             Kai              Daniel
                             G abriel      Andrejewski         Marasch
                               COO                CFO         VAN & TRUCK

                                                                                                   13                 31                      13
VOTING RIGHT DISTRIBUTION %                                                             Estanislao            Dirk                Michael
                                                                                         de Mata             Hünten               Meissner
                                                                                       EVP SIXT Spain    VP Region South        President & COO
                                                                                                                                   SIXT USA

                                          58.3%                                     COMBINING LONG TERM
                                                  SIXT FAMILY
                                                                            OPERATIONAL EXPERIENCE WITH
                                                                             INNOVATIVE DIGITAL KNOW-HOW
                                                  PUBLIC
                                                                                                                                                     5

Source: Annual Report 2020
OUR VISION: EXCITE OUR CUSTOMERS WITH
 THE FREEDOM OF GLOBAL MOBILITY WITHOUT
 OWNING A CAR               FACTS ABOUT DEVELOPMENT OF CAR OWNERSHIP
  DEVELOPMENT OF RELEVANT MOBILITY MARKETS                                                                                                                  LIKELY TO PUSH RENTAL AND SUBSCRIPTION BUSINESS

                                                                                                      2030                                                                                           41% of global car owners
                                                   2025                                                                                                                                              reconsider ownership

          2021                                                                                                                                                                                       >20% of consumers in countries like USA
                                                                                                                                                                                                     and Germany rate flexibility and >15%
                                                                                                                                                                                                     rate all-in rates very high”

                                                                                                                                                                                                     >20% of consumers in countries like USA,
                                                                                                                                                                                                     Germany or China are interested or very
                                                                                                                                                                                                     interested in car subscriptions
     USD ~65 bn                               USD ~510 bn                                       USD ~6,700 bn

      RENTAL                            CAR RENTAL,                                      TOTAL MARKET
                                                                                                                                                                                                     >50% of US and German citizens are
      MARKET                         RIDE HAILING, TAXI                                INCL. PRIVATE CARS                                                                                            willing to pay a premium for the flexibility
                                      & CAR SHARING

                  UNLIMITED SCALABILITY IN A USD 6,700 BN MARKET                                                                                                                                                                                    6

Source: Market Sizes: McKinsey & Company: Automotive revolution – perspective towards 2030, Statista.com; Facts: Deloitte: Automotive Study 2021, Arthur D. Little: The Future of Automotive Mobility (Feb 2021)
SIXT’S BUSINESS MODEL: SCALABLE, VARIABLE,
FINANCIALLY SOLID, DIVERSIFIED
                                                ONE APP                                                                                                                              21%
                                                                                                                                                                                               47%
                                                ONE                                                -3 months       6 MONTHS AVERAGE                 +3 months
                                                PRODUCT                                                              HOLDING PERIOD                                                  32%
                                                PORTFOLIO
                                                              PLATFORM                                                                                                                                  VARIABLE
                                                                                                                                                                                                        COST BASE
                   LARGE SIXT VEHICLE POOL
                                                ONE FLEET   SCALABILITY                      VARIABILITY                                                     Fleet (e.g. depreciation, vehicle insurance, repair)
                                                           State-of-the art technology       About 80% of our cost base                                      Variable (e.g. provisions, sales and marketing)
                                                            platform and large vehicle       is variable as we can extend                                    Fixed (e.g. personnel and other overhead costs)
     TECHNOLOGY PLATFORM                        ONE
                                                TECHNOLOGY  platform allow us to scale
                                                                     our business fast
                                                                                             or shorten our vehicle
                                                                                             holding periods
                                                PLATFORM

    94% Share of Buyback                                    FINANCIALLY                      DIVERSIFIED                                       2020                                                   Airport
    Agreements with OEMs1                                                                                                                  REVENUE
                                                                  SOLID                      A diversified customer                           SPLIT
                                                                                                                                                                                39%                   Downtown &
                                                                                                                                                                                                      Railway
                                                                                             and location mix                                        [%]       61%
    Platform model for non-core                              We have a risk-averse and       minimize our market
    products                                                  financially solid business     risks
                                                              model building on a high
                                                                              equity ratio
                                                                                             CUSTOMER                                               62                62             63
    Equity ratio of 31.5%                                                                    MIX    51                  55            58
                                                                                             [%]                                                                                                       Corporate
                                                                                                      40           36            34            31                32             30                     Retail
    Mainly fleet debt: 100% of net
    debt used for fleet assets                                                                                 9             9             8             7                                7
                                                                                                                                                                                                       Others
                                                                                                                                                                                                                    7
                                                                                                                                                                           6
1 buyback agreements includeoperating leases
Source: Annual Report 2020 and previous years                                                           2014          2015        2016          2017               2018           2019
GROUP REVENUE EUR m                                                                                       GROUP EBT EUR m
      4000                                                                                                      400
                                                                                                                                                                    337
                                                                                       3,306                    350

                                                 +106%
                                                                                                                300
                                                                                                                                         +2,132%
                                                                                                                                                                             SIXT HAS A STRONG
                                                                                                                                                                             LONG-TERM
      3000
                                                                                                                250

                                                                                                                                                                             GROWTH STORY
                                                                                                                200
                                                                                                                150
      2000
                                                                                                                100                                                          PRIOR TO COVID-19
                                                                                                                 50

                                                                                                                                                                             THE COMPANY HAS
      1000                                                                                                         0
          2009 2010 2011 2012 2013 2014 2015 2016 2017 2018 2019                                                    2009 2010 2011 2012 2013 2014 2015 2016 2017 2018 2019

                                                                                                                                                                             DOUBLED ITS
     1700%
     1500%
                                                                                                                20%
                                                                                                                                                                             REVENUE BETWEEN
                    OUTPERFORMING
     1300%
                    THE COMPETITION                                                                                                                                          2009 AND 2019, AT
     1100%                                                                                                                                                        12.4       THE SAME TIME
                                                                                                                                                                             INCREASING
      900%
                                                                                                                10%
      700%
      500%                                                                                                                                                                   PROFITABILITY BY
      300%
      100%
                                                                                                                                                                             >2,000%
                                                                                                                 0%
     -100%
                                                                                                                   2009 2010 2011 2012 2013 2014 2015 2016 2017 2018 2019
          2010 2011 2012 2013 2014 2015 2016 2017 2018 2019 2020 2021

                                                                      SHARE PRICE %1                                                                OP. EBT MARGIN % 2

                                                                                                                                                                                                 8
2018 Group EBT without one-off effect of DriveNow sale; Total EBT sums up to EUR 535m Source: Annual Reports Sixt ;
1 Bloomberg, development of share price based on values as of 4th Jan 2010 and IPO of Europcar
2 Represented as operating return on revenue. From 2017 to 2019 numbers are adjusted for the sale of Sixt Leasing SE
CONSISTENT LONG-TERM REVENUE GROWTH AND
MARGINS – QUICK ADAPTABILITY IN TIMES OF CRISIS
                                                                                                                       FLEET LEVEL DURING CORONA                                                 EBT MARGIN DURING
                                                                                                                       PANDEMIC 2019-2021                                                        COVID-19 RECESSION
GROUP REVENUE GROWTH YoY [in %]                                                                                        [Fleet % Change YoY]                                                      [EBT Margin in %]

                                                21.3%
                                                                                                                                                                                                                        14.4%

                                                                                   12.6% 12.8%
                                                           10.7%
                                    8.7%                                7.9%
                      3.6%                                                                                                      Nov.      Jan. März         Mai    Juli   Sept. Nov.   Jan.
            1.7% 2.0%
                                                                                                                               2019                               2020                    2021
                                                                                                                                                                                                     -1.1%
-4.0%
 2010 2011 2012 2013 2014 2015 2016 2017 2018 2019                                                                                                                                                                               -7.1%

OPERATING EBT MARGIN 1 [in %]
                                                                                                                                                                                                               -52.2%
 Target-Margin of 10%                                                              12.4% 12.4%                                                                                                       Q1 20     Q2 20    Q3 20    Q4 20

           10.1%                              10.3% 10.3%
                               9.1% 9.5% 9.6%
 7.7%                   8.3%
                                                                                                                                                                                                              WAVE 1                      WAVE 2
                                                                                                                                                                                                                           Loosening
                                                                                                                                                                                                                           Restrictions
                                                                                                                                 Fleet           Rental Days

 2010 2011 2012 2013 2014 2015 2016 2017 2018 2019                                                                                                                                                                                                 9

Source: Sixt Annual Reports        1 EBT   Margin = EBT / Group Operating Revenue, From 2017 to 2019 numbers are adjusted for the sale of Sixt Leasing SE
SNAPSHOT 2020: STRONG COST MEASURES TO
RESPOND TO COVID-19 CRISIS
   COST AND LIQUIDITY MEASURES                                                                                                                                                              GROWTH INITIATIVES

  SELECTED MEASURES                                                          Cost savings program [EUR m]                                           GROWTH INITIATIVES
  ▪ Financing secured: EUR 1.5 bn                                                                 -344                             GOAL OF          ▪ USA airport expansion with acquisition of 10 strategically
    syndicated loan (incl. KfW) and EUR                                               1,219
                                                                                                              875
                                                                                                                                   EUR 100m
                                                                                                                                                      important Advantage-EZ locations out of Chapter 11
                                                                                       462
    300 m bond lifted the Group’s                                                                             339
                                                                                       757                    536                 Personnel costs   ▪ Launch and scaling of SIXT+ to stabilise future revenue streams
    financial headroom to c. EUR 3 bn
                                                                                      2019                   2020                 Material costs      through recurring cashflows
    at the end of 2020
                                                                                                                                                    ▪ Investment into Van & Truck division by hiring a new dedicated
  ▪ Prudent spending behavior in all                                          Fleet costs1 [EUR m]                                                    Board member
    overhead cost categories strongly
    overachieving goal of EUR 100 m                                                                        -300                                     ▪ New strategic partnerships with Google and Lyft to further scale
                                                                                          1,023
                                                                                                                            724                       our business
  ▪ Strong reduction of fleet levels by
    25% compared to 2019                                                                                                                            ▪ SIXT share growth with expansion to the Netherlands and
                                                                                           2019                            2020
                                                                                                                                                      piloting of merging rental and sharing activities
  ▪ Salary cut of Board
                                                                             Liquidity / Free cash flow impact2
    members and no dividend                                                  [EUR m]
                                                                                                                                                    ▪ Clear growth story for replacement business through
    payments                                                                                                                                          dedicated partnerships with huge leasing companies
                                                                                                           +843
  ▪ Selected branch closures                                                                                                                        ▪ Orange roll-out to boost incremental sales after Corona
                                                                                                                            658
    and reduction of opening hours                                                         -185
  ▪ Usage of short-time work                                                               2019                            2020                                                                                          10

1 Fleet   costs incl. depreciation on rental vehicles 2Cash flows from continuing operations; 2019 figures adjusted accordingly
SNAPSHOT 2020: RESULTS PROVE RESILIENCE OF SIXT
BUSINESS MODEL
OVERALL RESULTS REGIONAL RESULTS
GROUP REVENUE [EUR bn] 2020 GROUP REVENUE [EUR m]
3.31 2.50 1.53 688 580 264
2019 2019 adj. 2020
NET INCOME [EUR m] 2020 CORPORATE EBITDA1 [EUR m]
247 247 2 79
49
2019 2019 adj. 2020 -52
▪ SIXT kept the drop in Group revenue at -38.8% to EUR 1.53 ▪ Corporate EBITDA1 sees SIXT clearly in the positive range at
billion and thus well below the average drop in international EUR 75.6 million for the Mobility segment
air traffic of -74% ▪ Adaptability of business model enabled positive results in
▪ SIXT managed to realize a positive net income of EUR 2 German and European business
million despite COVID-19 crisis ▪ Negative results in the USA due to strong investment into
expansion of US business and difficult 2nd quarter
11
1CorporateEBITDA stands for earnings before interest, taxes, decpreciation and amortisation (EBITDA), but with additional consideration of depreciation on rental vehicles and the interest results of the Mobility Business Unit
Source: Annual Report 2020 Note: Europe = excl. Germany 2019 adj. = 2019 revenue after elimination of Sixt LeasingSNAPSHOT Q1/21: REVENUE DECLINE COMPENSATED BY
STRICT COST MANAGEMENT
OVERALL RESULTS REGIONAL RESULTS
GROUP REVENUE [EUR m] Q1/21 GROUP REVENUE [EUR m]
488 330 137 111 82
Q1/20 Q1/21
NET INCOME1 [EUR m] Q1/21 CORPORATE EBITDA2 [EUR m]
6 17
-10 -10 -5
Q1/20 Q1/21
▪ Continued or even intensified pandemic-related travel ▪ Corporate EBITDA2 clearly positive at EUR 17.1 m for the
restrictions led to 32.5% drop in Group revenue Mobility segment thanks to consistent cost management
▪ Positive business development at the end of Q1/21, ▪ Personnel and material costs declined by 33%, fleet costs
particularly in the USA, but also in other European countries were reduced by 31% in Q1 2021 compared to the same
quarter of the previous year
12
1Net
Income from continuing operations; 2Corporate EBITDA stands for earnings before interest, taxes, decpreciation and amortisation (EBITDA), but with additional consideration of depreciation on rental vehicles and the interest results of the Mobility Business Unit
Source: Group Quarterly Statement as at 31 March 2021; Note: Europe = excl. GermanyWHAT'S THE SECRET
OF SUCCESS?
WHAT'S THE SECRET
OF SIXT?
13TRUST &
FOLLOW PERFORMANCE
PREMIUM DRIVEN
STRATEGY LEADERSHIP
BUSINESS
STRATEGY WACHSTUMS
EXCITE OUR
CUSTOMERS WITH FAMILY
CULTURE
EXCITED EXCITED
WILLE
& INTER
NATIONALI
THE FREEDOM OF VALUES
SATION GLOBAL MOBILITY
CUSTOMER WITHOUT OWNING
A CAR PEOPLE
ONE DIGITISED WE DON`T
MOBILITY JUST TALK.
PLATFORM WE ACT!
14FOLLOW
PREMIUM
STRATEGY
BUSINESS STRATEGY EXCITE OUR
CUSTOMERS WITH
FOLLOW PREMIUM THE FREEDOM OF
GLOBAL MOBILITY
STRATEGY WITHOUT OWNING
A CAR
15BUSINESS OBJECTIVES | 01 Follow Premium Strategy
FOLLOW A
PREMIUM
STRATEGY
PREMIUM PREMIUM PREMIUM
PRODUCTS SERVICE FLEET
through through through
TECH INNOVATION CUSTOMER CENTRICITY STRONG OEM PARTNERSHIPS
16FROM A RENTAL AND LEASING FOCUS TO UNLIMITED
BUSINESS OBJECTIVES | 01 Follow Premium Strategy | Products
MOBILITY THROUGH VARIOUS MOBILITY PRODUCTS
EXPECTED GLOBAL MARKET SIZE 2021
2008 TODAY AND EXPECTED CAGR UNTIL 2025 1 USD bn
DRIVE
Rent & Share
RENT A CAR TRUCK RENT 65 +14% p.a.
Car Rental Global Van & Truck
Rental
LEASING RIDE SHARE 10 +9% p.a.
Leasing & Ride hailing services
New Car Sales
SUBSCRIPTION RIDE
Long-term rentals, Flatrate HAILING & +10% p.a.
RENT A TRUCK TAXI 260
Truck Rental
MOBILITY PLATFORM
Multimodal solutions
SUBSCRIPTION & Car Sales ’21:
REVENUE 2008 CAR SALES 6 +>40% p.a.
1,650
EUR 1.8 BN
REVENUE 2019
+86% REVENUE >>> EUR 3.3 BN 17
1 Source: Statista.com for Car Rental, Car Sharing; Ride Hailing & Taxi, Passenger Car Sales; Global Market Insight for SubscriptionBUSINESS OBJECTIVES | 01 Follow Premium Strategy | Products
CAR DIGITAL RENT & SHARING FLEXIBLE CAR VAN AND TRUCK TAXI
RENTAL SERVICES SUBSCRIPTION RENTAL SERVICES
▪ >200,000 vehicles – ▪ Combining advantages of ▪ Launched in 2020, now ▪ Division launched in 2021 ▪ SIXT ride is a global platform
even in 2020 despite car rental and sharing with already available in 8 ▪ >800 stations based mobility provider
Covid-19 1 free movements in inner- countries ▪ Among Van & Truck rental operating since 2012
▪ >2,050 branches1 cities and to other German ▪ Flexible all-inclusive market leaders up to 7.5t ▪ Currently available in almost
▪ High share of cities offering, on a monthly basis in DACH region 50 countries worldwide
telematics fleet ▪ Share currently available in ▪ Highly digitised process ▪ International growth in ▪ >1,850 partners
enabling for digital 3 German and 3 Dutch ▪ Stable monthly cash-flows EU & US ▪ >1.5m drivers
check-out (Fastlane) cities for SIXT ▪ Digitising offerings ▪ Commission-based
and process efficiency ▪ Almost 2,500,000 trips in through connected vehicle partnerships
2020 experience ▪ Marketing efficiency by
▪ Expected >10bn USD leveraging existing customer
global market size base
▪ On demand and pre-booked 18
in >400 cities1
1Data as of 2020 for corporate (DE, US, ES, UK, FR, IT, BE, NL, LU, AT, CH, MC) and franchise countriesHIGH FOCUS ON PREMIUM
BUSINESS OBJECTIVES | 01 Follow Premium Strategy | Service
CUSTOMER SERVICE AND
LOCATION EXPERIENCE
▪ Customer excitement: 71% of Sixt customers
give 5 out of 5 stars
▪ 360° customer view at every customer
touchpoint
▪ CES (customer excitement score) is part of
the variable compensation and in 2020 with
4.4 on an all-time high
▪ Numerous customer service awards
71 LOYAL & EXCITED
% CUSTOMERS
4.4 CUSTOMER EXCITEMENT
SCORE 2020
19
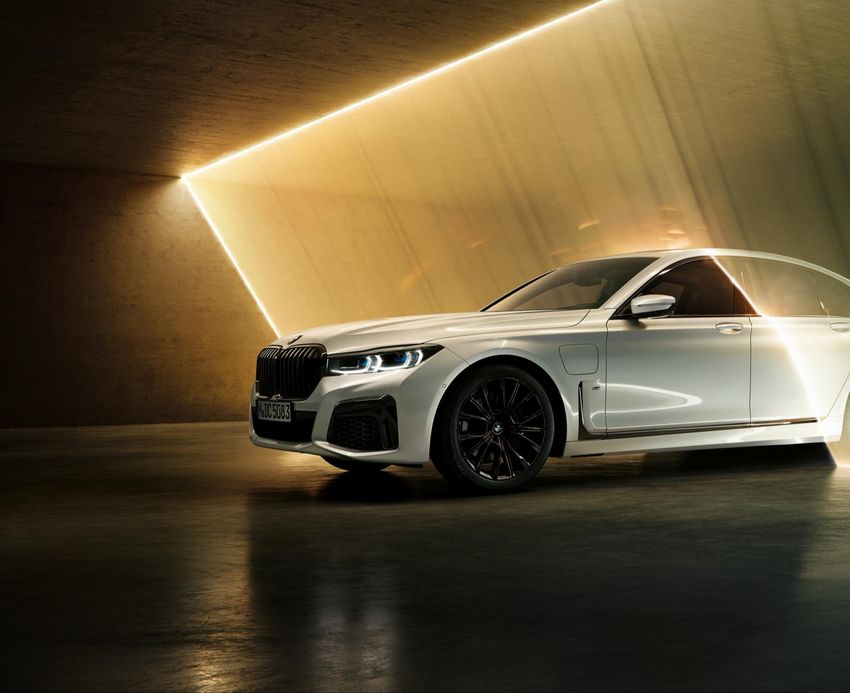
Source: Internal Sixt DataWORLDS BIGGEST
BUSINESS OBJECTIVES | 01 Follow Premium Strategy | Fleet
PREMIUM FLEET
▪ >200,000 vehicles in fleet in 2020
▪ Premium share of 55%1,2
▪ Largest purchaser of Mercedes & BMW vehicles
▪ Newest vehicles in the market average holding period
of 6 months2
▪ EUR 5,500,000,000 fleet investment in 2020
Corporate
Franchise
+120% 270
216 205
131
139 153
108 114
123
AVERAGE 77 85
66
FLEET 139
SIZE 108 91
57 62 69
[# in k]
2010 2012 2014 2016 2018 2020
94% BUYBACK AGREEMENTS
WITH OEMS3 – HENCE LIMITED
RESIDUAL VALUE RISK 20
1Audi, BMW, Mercedes based on value of fleet 2Based on vehicle fleets in Sixt corporate countries; 3Buyback agreements include operate leases, only reflects corporate countriesSIXT IS A STRONG STRATEGIC PARTNER
BUSINESS OBJECTIVES | 01 Follow Premium Strategy | Fleet
FOR OEMs
Support by joined
AWARENESS marketing activities and
high visibility (e.g. airport)
SALES
PUSH
FOR OEMs +OEMs SIXT IS PROVIDING UNIQUE
CUSTOMER ACCESS,
AWARENESS & NEW
MOBILITY SOLUTIONS TO
+
x OEMS
The use of the rental car had a
positive influence on the TEST MOBILITY
purchase decision for almost DRIVE SOLUTIONS
60% of all drivers.1
21
1Source: TNS SIXT customer survey, All respondents in the relevant target group, that previously used a premium brand as a rental carBUSINESS STRATEGY WACHSTUMS EXCITE OUR
CUSTOMERS WITH
WACHSTUMSWILLE WILLE
& INTER
NATIONALI THE FREEDOM OF
GLOBAL MOBILITY
& INTERNATIONALISATION SATION
WITHOUT OWNING
A CAR
22WACHSTUMS
BUSINESS OBJECTIVES | 02 Wachstumswille & Internationalisation
WILLE REVENUE
1.8
3.3
2.5 1.5
EUR bn
x2
SIXT IS THE
3371
308
FASTEST
EBT
EUR m
87
-82 SCALING & MOST
x4
PROFITABLE
LISTED PLAYER IN
CORPORATE
EBITDA
EUR m
421 83
THE INDUSTRY
3.8 3.9
MARKET
CAPITALISATION2 0.3
EUR bn
x14
2008 2019 2019 2020
23
adjusted 1
Sources: Annual report 2008, Bloomberg, Annual Report 2020 1 2019 value adjusted for sale of Sixt LeasingFROM A GERMAN CAR RENTAL COMPANY
BUSINESS OBJECTIVES | 02 Wachstumswille & Internationalisation
TO A GLOBAL MOBILITY PROVIDER
20081
GLOBAL 20201
28% REVENUE
28%
SHARE1 43% 57%
72% 57%
+>100%
INTERNATIONAL
NATIONAL
24
1Calculations of
revenue shares are based on rental revenues
Source: Annual ReportsBUSINESS OBJECTIVES | 02 Wachstumswille & Internationalisation
SNAPSHOT EUROPE
CONSISTENT MARKET
SHARE GAINS IN A
GROWING MARKET
MARKET SIZE DEVELOPMENT MARKET SHARE DEVELOPMENT
EUROPEAN CORPORATE COUNTRIES 2 [EUR m] MARKET SHARE DEVELOPMENT IN EUROPE 2020 vs. 20191
Europe incl. Franchisees1 Europe corporate countries2
3.0%
+1.6% 41%
Germany2 39%
11.0 11.0 11.5
34% 36%
10.2 Europcar -0.3%
10.1 31% 31%
30%
27% 17% 17%
24% 15% Avis -0,8%
13% 14%
11% 11% 11% 11% 12%
7% 8% 9% 9% Hertz -1.4%
6%
Enterprise -0.6%
2011 2013 2015 2017 2019 2005 2007 2009 2011 2013 2015 2017 2019 2020
Other 0.1%
25
1Figures 2005-2014 according to Jefferies (Research Report as of 1 April 2020) and figures 2015-2020 according to J.P. Morgan; 2According to Euromonitor and own estimatesBUSINESS OBJECTIVES | 02 Wachstumswille & Internationalisation
SNAPSHOT USA
ALREADY #4
IN THE MARKET &
PRESENT AT 25 OF
THE TOP 30 AIRPORTS TARGETED
AVERAGE AIRPORT
MARKET SHARE OF
US RENTAL MARKET SIZE 2019 USD bn EXAMPLE: MIAMI AIRPORT SIXT MARKET SHARE
10%
~31%
of total rental
market
32 12.7%
MID-TERM
10.5% TARGET OF
13 10 6.5%
USD 1 BN
EU CORPORATE US MARKET TOP 30 2015 2017 2019
COUNTRIES AIRPORTS 26
Sources: Euromonitor 2019 Studies, AutoRental News, US Market Data and own estimatesSTRATEGIC GROWTH INITIATIVES FOR OUR ONE
BUSINESS OBJECTIVES | 02 Wachstumswille & Internationalisation
INTERNATIONALISATION STRATEGY
GROWTH IN DIGITAL GROWTH IN THE USA GROWTH IN VAN & GROWTH IN SIXT+ /
RENTAL TRUCK SUBSCRIPTION
▪ Expansion in downtown network ▪ Further expansion of airport ▪ Significant market potential in ▪ Operating SIXT+ in all Sixt
through physical and digital presence to cover most of the Top Europe and the US given Corporate Countries
locations 50 US airports expected >10bn USD global ▪ Expanding the SIXT+
▪ Enable fully digital and ▪ Expansion of downtown network market size offering to additional
contactless rental experience through physical and digital ▪ Highly fragmented market customer groups, like for
(digital pick up) branches without clear market leader example SMEs
▪ Merging Rental and Sharing ▪ Leveraging enhanced branch ▪ Competitive advantage offering ▪ Leveraging best solutions
business network for penetration of purely digital, manufacturer- for both the SIXT+ and long-
corporate customer segment independent and highly flexible term product offering
▪ Strengthening of strategic rentals
partnerships e.g. with Lyft 27BUSINESS STRATEGY EXCITE OUR
DIGITISED MOBILITY CUSTOMERS WITH
THE FREEDOM OF
PLATFORM ONE GLOBAL MOBILITY
WITHOUT OWNING
A CAR
ONE
DIGITALISED
MOBILITY
PLATFORM
28OUR SIXT APP – POWERED BY THE ONE PLATFORM –
BUSINESS OBJECTIVES | 03 ONE digitalised platform
COMBINES OWN AND THIRD PARTY CONTENT
Upward integration with Google, Etihad, etc.
Digitisation of rental process and stations
SIXT APP enables merging of fleet and enables more
flexibility and efficiency
ONE platform provides one-stop-shop and
PLATFORM integrates all SIXT products
3rd party product integration provides
more frequent interaction, greater reach
and more stickiness
EST. CUSTOMER-TOUCHPOINTS PER MONTH
3RD PARTY PRODUCTS
10
PLATFORM INTEGRATION LAYER 29LOWER COSTS
BUSINESS OBJECTIVES | 03 ONE digitalised platform
FOR SIXT &
LOWER
PRICES FOR
CUSTOMERS
More selection of own products
and 3rd party products on ONE
FLYWHEEL platform
DIGITISATION OF Creating
RENT AND SHARE more
PROCESSES relevance Better
for our customer
customers experience
and
partners
TECHNOLOGY PLATFORM
More Traffic:
ENABLES TRAFFIC INCREASE & More customers and higher
CROSS-PRODUCT USAGE AND stickiness on the platform
HENCE DECREASES UNIT COSTS
30BUSINESS OBJECTIVES | 03 ONE digitalised platform
UNLIMITED 100,000 500,000 1,000,000
SCALABILITY
ON ONE
PLATFORM
31BUSINESS OBJECTIVES | 03 ONE digitalised platform
INVESTORS CUSTOMERS
FEB19 vs. APR19 Status January 2020, App Store
4.2 +21% IN MARKET
3.5
CAPITALISATION1 APP RATING TRAVEL APP RANKING
2.7 2.7 4.8 SIXT 19 SIXT
4.4 Avis 66 Europcar
1.6 1.5 1.4 Hertz 102 DriveNow
WE HAVE
1.2 1.2 4.5 Uber 134 Avis
3.9 Europcar >200 Hertz
DELIVERED AVIS
Budget Hertz Europcar
4.8 / 5 CUSTOMER RATING
REACTIONS IN APP STORE2 AND >2M
ON LAUNCH DOWNLOADS
IN 2019
MEDIA >10.000 ARTICLES IN REVENUE
PRINT & ONLINE AND
GREAT AWARDS
THE GAME-
CHANGING LEADERS +60% bookings and
!
SIXT ATTACK ON
OF THE 2019 DIGITAL BMW & DAIMLER
REVOLUTION
Born2Invest
WITH NEW APP
BILD
SIXT WANTS > EUR 1,000,000
TO TAKE ON
GIANTS LIKE
BMW OR
revenue per day via
SIXT AIMS TO REVOLUTIONISE URBAN MOBILITY
WITH ITS NEW APP
UBER
Handelsblatt
app 3 32
WeRSM
1 Market capitalisation as of 28th Feb 2019 and 30th Apr 2019 2 4.8 / 5 rating is based on over 29,000 individual customer ratings (Status April 2020, App Store) 3 Reservations 2019 vs. 2018; own estimates.TECH PROVES TO
BUSINESS OBJECTIVES | 03 ONE digitalised platform
REALISE IMMEDIATE HIGHER MARGINS THROUGH
AI PRICES
MARGIN IMPACT
SCALING THE LOW-RISK
MOBILITY PLATFORM
LOWER COSTS THROUGH
DIGITISATION OF BRANCHES (VIRTUAL
BRANCHES, DIGITAL LOCATIONS)
▪ > 500 colleagues
+253% BETTER UTILISATION THROUGH
▪ Three locations: Pullach, AI BASED FLEET FORECAST
Kiev and Bangalore
▪ State-of-the-art
microservices-based cloud
GLOBAL architecture LOWER COSTS THROUGH OPTIMISATION
IT TEAM ▪ Consistent AI first strategy OF TRANSFERS/TURNAROUNDS
2010: 150 2020: 530 33
Source: Sixt Internal DataTRUST &
PERFORMANCE
DRIVEN
LEADERSHIP
EXCITE OUR
CUSTOMERS WITH FAMILY
CULTURE
THE FREEDOM OF
GLOBAL MOBILITY
VALUES
EXCITED
WITHOUT OWNING
A CAR PEOPLE
WE DON`T
JUST TALK.
WE ACT!
34We are not a
car rental business
serving people.
We are a
people business
renting cars.
ALEXANDER SIXT
35TRUST & PERFORMANCE
CULTURE | 01 invest & trust in people
DRIVEN LEADERSHIP
OUR LEADERS WE INVEST IN OUR WORKFORCE WE VALUE
STAY WITH SIXT AND PAY TOP-OF-THE MARKET 2 PERFORMANCE
FOR A LONG TIME OPERATING REVENUE EUR m
PERSONNEL EXPENSES EUR m & % of Revenue ▪ Salary increases based on
EBT EUR m individual performance
337 337
AVERAGE TENURE 1 instead of tenure
3000 287 2,946 ▪ No limits on variable
compensation of Rental
>10 2500
2,599
Sales Agents – some earning
YEARS 2,309
9.5 218 2,124 >EUR 100k p.a.
8
YEARS
YEARS
2000
185
1,939 ▪ Top 10 performers earned
3,5 times more bonus than
1500 their fixed salary
14.2% 15.8% 15.8% 16.2% 17.1%
▪ Average Rental Sales Agent
BRANCH REGIONAL 1000 Salary incl. commission 25%
LEADERSHIP MANAGERS MANAGERS
420 503 above competition
500 274 335 365
EMPLOYEES
STAYING 0
WITH SIXT 2015 2016 2017 2018 2019 36
1 Sources: Internal Sixt Data 2 Source: Annual Reports Sixt Annual Reports and own assessmentsSHARE SAVING
CULTURE | 02 we don`t just talk. we act!
FLEET ECONOMY ENERGY DIVERSITY CHARITY
State-of-the-art vehicles SIXT share a flexible, Reduction of water Women make up approx. Projects in the areas of
in terms of resource environmentally friendly consumption per 50% of the workforce education, health, care
efficiency, CO2 emissions carsharing product employee in corporate and emergency aid
and safety systems headquarters by 58% Initiatives e.g. Female
Holding period of six One carsharing vehicle is (2017-2020) Career Tandem or Feel Supported by >7,000 Sixt
months said to replace up to twenty Good Managers; employees in 115
private cars Usage of 100% Green involvement in numerous countries on an honorary
100% electrical fleet in energy for all locations in associations active in the basis
SIXT share in the SIXT is part of the shared in Germany, provided Sixt promotion of women
Netherlands and one economy and therefore is responsible for "Drying Little Tears Day“:
third electric vehicles in contributes to a more purchasing Employees can spend an
SIXT share overall sustainable and efficient entire day once a year
use of resources Increasing energy >300 supporters &
Successful reduction of efficiency in corporate members to promote Has so far supported >200
average CO2 emissions of Integrated mobility offers headquarter significantly diversity and a culture of projects in >50 countries
European rental fleet for ▪ Shared mobility as real (up to 50%) by respect, acceptance,
over ten years in a row alternative to own car modernisation measures openness and equal
(since 2008 -19% from 160 ▪ Animate to use a mix of (e.g. Geothermal power) opportunities
g/km to 129 g/km in 2020) different mobility
solutions
Investments into ▪ Reduction of urban
innovative e-mobility traffic, along with
concepts (e.g. Chargery, a emission reduction
mobile charging service
based in Berlin / Axilion,
company to increase traffic
using AI)
37
Sources: Annual Report of Sixt, Drying Little Tears, Bundesverband CarSharing e.VTRUST &
FOLLOW PERFORMANCE
PREMIUM DRIVEN
STRATEGY LEADERSHIP
BUSINESS
STRATEGY WACHSTUMS
EXCITE OUR
CUSTOMERS WITH FAMILY
CULTURE
EXCITED EXCITED
WILLE
& INTER
NATIONALI
THE FREEDOM OF VALUES
SATION GLOBAL MOBILITY
CUSTOMER WITHOUT OWNING
A CAR PEOPLE
ONE DIGITSED WE DON`T
MOBILITY JUST TALK.
PLATFORM WE ACT!
38EXCITE
THE CUSTOMER
WITH OUR BRAND
39UNCONVENTIONAL
& EXCITING
ADVERTISING
40EXTRAORDINARY BRAND PERFORMANCE
BRAND | Sixt Excitement
BRAND
AIDED BRAND AWARENESS1 Growth in % CONSIDERATION2
+159
94% % +132
%
+64%
+333
%
+460
%
+166%
2014 / 2019 2014 / 2019 2014 / 2019 2010 / 2020 2015 / 2020 2013 / 2020 2013 2020
DE UK ES FR BE NL EUROPE
SIXT SHARE NL Q2 20201
MORE THAN 80% OF
46%
BRAND AWARENESS
OUR TARGET GROUP
HAS SEEN OUR AD
WITHIN 5 MONTHS3 ▪ customer touchpoints multiplied by 5
▪ July 2020 already within Top-5 car sharing
provider (in just 3 months)
41
Sources: 1SIXT Data 2SIXT Data 2013 to 2020 combined: UK (2014/2019), ES (2014/2019), FR (2017/2019), BE (2016/2020), NL (2013/2020), growth in % 3BDK puls study 11-2020, n = 1,046Branding matters
because
branding sells.
KONSTANTIN SIXT
42BRANDING SELLS
BRAND | Sixt Excitement
REVENUE DEVELOPMENT [EUR m] ONLINE REVENUE SHARE1
3,306
72%
2,930
67% 70%
2,603 64%
2,413 59% 62%
2,179
1,796
1,622 1,602 1,596 1,653
1,560
2009 2010 2011 2012 2013 2014 2015 2016 2017 2018 2019 2015 2016 2017 2018 2019 2020
CUMULATED APP DOWNLOADS 01/19 – 12/20 SIXT GLOBAL CUSTOMERS
SIXT APP
DOWNLOADS ~4,000,000 26,000,000 GLOBAL SIXT
CUSTOMERS
43
Sources: SIXT Data and Sixt Annual ReportsIf you are not a
brand you are a
commodity.
ERICH SIXT
44SIXT FOCUS ON HIGH
BRAND | Sixt Excitement
MARGINS AND HIGH PRICES
LOW VOLUME HIGH VOLUME
HIGH PRICE LOW PRICE
HIGH TECH LOW TECH
PEER
LOW M&A HIGH M&A
GROUP1
HIGH BUYBACK LOW BUYBACK
45
1US players with low buyback ratiosPERFORMANCE
BRAND | Sixt Excitement
GLOBAL REVENUE SHARE 20202,3 % IMPACT CUMULATED EBT2,3 Cum. EBT 2006-2020, EUR bn.
Europcar 11%
REVENUE
Hertz
SHARE >50% 2.5
OF PROFITS
[2019] 1;4
-0.8
~100%
AVIS -1.4
Budget
-2.2
AVIS
OF PROFITS Budget Europcar Hertz
[2006-2020]1
EQUITY RATIOS2 2020, % GOODWILL & INTANGIBLE ASSETS2,3 2020, EUR
3,298
31.5 2,054
1,561
3.0
BALANCE 39
-0.9 -0.03 SHEET
AVIS
Budget Europcar Hertz IMPACT AVIS
Budget Europcar Hertz 46
1of top 4 listed car rental companies; 2Financial data based on annual reports of SIXT and competitors; 3Based on USD/EUR exchange rate as of 31.12.2020; 4Based on USD/EUR exchange rate as of 31.12.2019PERFORMANCE REVIEW &
FINANCIAL TRACK RECORD
47PERFORMANCE REVIEW &
PERFORMANCE REVIEW AND FINANCIAL TRACK RECORD | 01 Financial Performance
FINANCIAL TRACK RECORD
FINANCIAL FINANCIAL
PERFORMANCE LIQUIDITY
Track record of long-term Well-funded company with
profitable growth and fast high availability of liquid
reaction to Covid-19 crisis FINANCIAL funds to grow the
business out of the crisis
STABILITY
Conservative financial
management with low-risk balance
sheet and high equity share
48PERFORMANCE REVIEW AND FINANCIAL TRACK RECORD | 01 Financial Performance
GROUP REVENUE EUR m GROUP EBT EUR m
4000 400
337
3,306 350
+106%
300
+2,132%
SIXT HAS A STRONG
LONG-TERM
3000
250
GROWTH STORY
200
150
2000
100 PRIOR TO COVID-19
50
THE COMPANY HAS
1000 0
2009 2010 2011 2012 2013 2014 2015 2016 2017 2018 2019 2009 2010 2011 2012 2013 2014 2015 2016 2017 2018 2019
DOUBLED ITS
1700%
1500%
20%
REVENUE BETWEEN
OUTPERFORMING
1300%
THE COMPETITION 2009 AND 2019, AT
1100% 12.4 THE SAME TIME
INCREASING
900%
10%
700%
500% PROFITABILITY BY
300%
100%
>2,000%
0%
-100%
2009 2010 2011 2012 2013 2014 2015 2016 2017 2018 2019
2010 2011 2012 2013 2014 2015 2016 2017 2018 2019 2020 2021
SHARE PRICE %1 OP. EBT MARGIN % 2
49
2018 Group EBT without one-off effect of DriveNow sale; Total EBT sums up to EUR 535m Source: Annual Reports Sixt ;
1 Bloomberg, development of share price based on values as of 4th Jan 2010 and IPO of Europcar
2 Represented as operating return on revenue. From 2017 to 2019 numbers are adjusted for the sale of Sixt Leasing SESNAPSHOT 2020: POSITIVE NET INCOME & EBT IN EUROPE
PERFORMANCE REVIEW AND FINANCIAL TRACK RECORD | 01 Financial Performance
SIXT GROUP RESULTS [EUR m] SIXT GROUP PER REGION [EUR m]
2,494
Operating 1,520 ▪ Revenue drop only half of drop 2020
of international airline Operating 680
Revenue 577
[EUR m] passenger volume Revenue 264
20191 2020 (-74%2) due to stabilizing [EUR m]
downtown and long-term
revenues
Corporate 421 ▪ Positive Group net income 2020
EBITDA despite impact of Corona crisis Corporate 79
83 49
[EUR m] EBITDA
▪ Adaptability of business model -52
20191 2020 [EUR m]
enabled positive results in
German and European
business
247 ▪ Negative results in the USA 7
Net Income due to strong investment into 2020
2 expansion of US business EBT 3 -90
[EUR m]
20191 2020 with ramp-up of newly [EUR m]
acquired airport locations
1 Source: Annual Report 2020; The
50
prior-year comparative figures have been adjusted accordingly to account for the reporting of discontinued operations
2 Source: icao.int
3 Total EBT of -82m EUR, additionally “Other” with +1m EUR of EBTSNAPSHOT 2020: RESULTS PROVE ADAPTABILITY OF SIXT
PERFORMANCE REVIEW AND FINANCIAL TRACK RECORD | 01 Financial Performance
BUSINESS MODEL
QUARTERLY SIXT GROUP REVENUE & EBT [EUR m] ▪ Negative EBT in 2020 mainly stems from second
489 463 quarter
353 ▪ First Corona wave caused serious challenges in the
229 USA as the used car market was temporarily closed
Revenue and hence no quick fleet downsizing was possible
66 ▪ Fleet adjustments in Europe happened more
EBT
proactively
-5 -25
-118 ▪ Especially SIXT could benefit from the rebound of
business during the summer months with immediate
Q1 2020 Q2 2020 Q3 2020 Q4 2020
ramp-up of fleet and strong profits during Q3
QUARTERLY CORPORATE EBITDA PER REGION [EUR m]
77
Germany
35 Rest of Europe
27
15 11
5 5 USA
-12 -12 -6
-30
-40
51
Q1 2020 Q2 2020 Q3 2020 Q4 2020
Note: Europe excl. Germany Source: Annual Report 2020 and Internal Sixt DataSNAPSHOT 2020: STRONG COST MEASURES TO
PERFORMANCE REVIEW AND FINANCIAL TRACK RECORD | 01 Financial Performance
RESPOND TO COVID-19 CRISIS
COST AND LIQUIDITY MEASURES GROWTH INITIATIVES
SELECTED MEASURES Cost savings program [EUR m] GROWTH INITIATIVES
▪ Financing secured: EUR 1.5 bn -344 GOAL OF ▪ USA airport expansion with acquisition of 10 strategically
syndicated loan (incl. KfW) and EUR 1,219
875
EUR 100m
important Advantage-EZ locations out of Chapter 11
462
300 m bond lifted the Group’s 339
757 536 Personnel costs ▪ Launch and scaling of SIXT+ to stabilise future revenue streams
financial headroom to c. EUR 3 bn
2019 2020 Material costs through recurring cashflows
at the end of 2020
▪ Investment into Van & Truck division by hiring a new dedicated
▪ Prudent spending behavior in all Fleet costs1 [EUR m] Board member
overhead cost categories strongly
overachieving goal of EUR 100 m -300 ▪ New strategic partnerships with Google and Lyft to further scale
1,023
724 our business
▪ Strong reduction of fleet levels by
25% compared to 2019 ▪ SIXT share growth with expansion to the Netherlands and
2019 2020
piloting of merging rental and sharing activities
▪ Salary cut of Board
Liquidity / Free cash flow impact2
members and no dividend [EUR m]
▪ Clear growth story for replacement business through
payments dedicated partnerships with huge leasing companies
+843
▪ Selected branch closures ▪ Orange roll-out to boost incremental sales after Corona
658
and reduction of opening hours -185
▪ Usage of short-time work 2019 2020 52
1 Fleet costs incl. depreciation on rental vehicles 2Cash flows from continuing operations; 2019 figures adjusted accordinglyHIGH EQUITY RATIO AND
PERFORMANCE REVIEW AND FINANCIAL TRACK RECORD | 02 Financial Stability
LOW NET FINANCIAL DEBT
EQUITY RATIO [%] NET FINANCIAL DEBT [EUR bn ]
Positive impact of sale of Sixt Leasing:
▪ Strong reduction of assets on the
balance sheet and hence financial liability
requirements
▪ Significant improvement of Equity Ratio
31.5%, far above target ratio of 20%
31.5 3.3
26.8 27.8 ▪ Improvement of pre-Corona EBT margin
26.2 25.5 2.6
2.2 by c. 1pp
2.1
1.6
2016 2017 2018 2019 2020 2016 2017 2018 2019 2020
53
Source: Annual ReportsSIXT INVESTS IN EARNING ASSETS AND 86% OF THE
PERFORMANCE REVIEW AND FINANCIAL TRACK RECORD | 02 Financial Stability
BALANCE SHEET COMPRISE EARNING ASSETS
SIXT BALANCE SHEET [EUR m]
4,428 4,428
39
Goodwill & Intangibles
Other Non-Current Assets1 602
HIGH EQUITY RATIO OF
1,395 Equity 31.5% 31.5% - FAR ABOVE
COMPETITION
VERY CLEAN
BALANCE SHEET
AS 86% OF
ASSETS ARE
CASH OR Rental Vehicles 2,205
INVESTMENTS IN FINANCIAL LIABILITIES
VEHICLES AND OF EUR 2.5 BN MAINLY
WORKING
CAPITAL 86% 1,937 Non-current Liabilities USED TO FINANCE
VEHICLES – NO
GOODWILL OR
INTANGIBLE ASSETS TO
94% OF BE FINANCED
INFLEETED Working Capital / Other Assets 830
VEHICLES
SECURED VIA 566 Current Liabilities
BUYBACK
AGREEMENTS Cash & Bank Balances 753
530 Trade Payables / Other Liabilities
Assets Equity and 54
Liabilities
Source: Sixt Annual Report 2020; 1Other non-current assets mainly property & equipment of EUR 544 mWELL-BALANCED
PERFORMANCE REVIEW AND FINANCIAL TRACK RECORD | 03 Financial Liquidity
FINANCING MIX
MIX OF FINANCING INSTRUMENTS as at 31 March 20211 [%] MATURITY PROFILE1 [EUR m]
6% 839
0%
43% 5503
EUR
1,8672 m
51% 311
274
213
250
156 271 286 96
83
51
5 58 80 93
52
3 3 3 3 3
Bonds Commercial papers 2021 2022 2023 2024 2025 2026 >2026
Borrower’s note loans Utilisation of bilateral credit lines
55
1Financial liabilities
as of 31 March 2021, Repayment amounts excluding accrued and in future payable interest; 2Lease liabilities resulting from leases recognised in accordance with IFRS 16 are not included
3Two bonds due in 2024: EUR 250 m in February and EUR 300 m in DecemberHIGH LIQUIDITY RESERVES
PERFORMANCE REVIEW AND FINANCIAL TRACK RECORD | 03 Financial Liquidity
PAVING THE WAY FOR FUTURE GROWTH
FINANCIAL HEADROOM [EUR m] ▪ Measures like fleet reductions, a successful bond
placement, additional credit lines, cost cutting and dividend
>2,000 waiver result in significantly increased financial headroom
▪ Substantial cash inflow driven by defleeting of
vehicles
▪ EUR 753 m Cash on hand as of end of 2020
POTENTIAL ▪ Placement of a bond with a volume of EUR 300 m in
FOR RAMP- Dec. 2020 (4-year term and interest coupon of
750 UP OF FLEET 1.75% p.a.)
BY 70,000 –
▪ Replacement of previously unused syndicated loan with the
753 80,000 participation of KfW by a new long-term syndicated loan
VEHICLES 1 agreement in the amount of EUR 750 m with a renowned
bank consortium
▪ Liquidity is used to finance the operating business,
particularly the fleet – hence as an investment in earning
Cash and Long-term Other Total
Cash Syndicated unused Liquidity assets
Equivalents Credit Line Credit Lines
as of 31. ▪ Sixt currently has significantly more than EUR 2 bn in
Dec. 20 financial funds available
56
1 Calculated with average vehicle purchase price of EUR 25,000 – 30,000100%
300%
500%
700%
900%
1100%
1300%
1700%
-100%
1500%
2010
2010
2010
2010
2011
2011
2011
2011
2012
2012
2012
2012
2013
2013
ALL COMPETITORS
2013
2013
SIXT OUTPERFORMS
2014
2014
2014
2014
2015
2015
2015
2015
2016
2016
2016
2016
2017
2017
2017
2017
2018
2018
2018
2018
2019
2019
2019
2019
2020
2020
2020
2020
2021
2021
PERFORMANCE REVIEW AND FINANCIAL TRACK RECORD
57SELECTED KEY FIGURES
FOR THE SIXT GROUP
APPENDIX
58SIXT GROUP’S TRACK RECORD OF PROFITABLE GROWTH
SELECTED KEY FIGURES FOR THE SIXT GROUP
PRE-CORONA
OPERATING REVENUE [EUR m] EBITDA [EUR m]
CAGR CAGR
+12.9% 2,945 -39.1% +14.2% 1,089
241 -52.3%
2,599 2,494
Other 2,310 912
191 835 858
revenue 242
from rental 179
business 709
Depreciation and 539
2,248 1,520 510 519
1,940 158 amortisation expense 409
Rental
revenue 1,687 2,252
1,362 Earnings before 458
interest and taxes 325 373 380 339
Leasing (EBIT)
revenue 444 468 456
-49
2017 2018 2019 2019 2020 2017 2018 2019 2019
restated1 2020
restated1
59
1The prior-year comparative figure has been adjusted accordingly to account for the reporting of discontinued operationsSIXT GROUP’S TRACK RECORD OF
SELECTED KEY FIGURES FOR THE SIXT GROUP
PROFITABLE GROWTH PRE-CORONA
GROUP EBT2 [EUR m] MOBILITY BUSINESS UNIT CORPORATE EBITDA1 [EUR m]
CAGR
CAGR
+8.4%
336.7 337.4 +22.4% 414.7
308.2
287.3
324.0
276.9
12.4 13.0 11.5 12.4
EBT
75.6
margin3,4 2020
[%]
2017 2018 2019 2019 -5.4 2017 2018 2019 2020
restated1
-81.5 60
1The prior-year comparative figure(s) has/have been adjusted accordingly to account for the reporting of discontinued operations; 2Segment Other with EBT of EUR 1.5 m in 2020 (2019: EUR -1.0 m); 3Related to operating revenue; 4In 2018 excluding the non-recurring income from the sale of the
DriveNow stakeQ1/21 UPDATE: POSITIVE CORPORATE EBITDA DESPITE
SELECTED KEY FIGURES FOR THE SIXT GROUP
ONGOING TRAVEL RESTRICTIONS
OPERATING MOBILITY BUS. UNIT
REVENUE [EUR m] EBITDA [EUR m] GROUP EBT [EUR m] CORPORATE EBITDA [EUR m]
-32.6% -38.7%
>+100% -39.1%
486 122
Other 57 28.1
revenue EBT
from rental -1.1 -4.2
business margin1
327 75 [%]
38 -5.1 17.1
Depreciation and
amortisation expense 117
Rental
revenue 429
79
289
Earnings before
interest and taxes
(EBIT) 4 -5 -13.7
Q1/20 Q1/21 Q1/20 Q1/21 Q1/20 Q1/21 Q1/20 Q1/21 61
1Related to operating revenueDECREASE IN TOTAL ASSETS TO EUR 4.43 BN
SELECTED KEY FIGURES FOR THE SIXT GROUP
DUE TO SALE OF SIXT LEASING SE –
EQUITY RATIO REACHED 31.5%
TOTAL ASSETS [EUR m] FINANCIAL LIABILITIES [EUR m] EQUITY [EUR m]
6,249
670
5,193
4,491 263 1,426
Corporate assets1 4,429 3,437
229 1,121 592
Others incl. 967 2,740
working capital 1,120 2,379
1,204 2,291 1,592
1,632 1,442
Lease assets 1,219 2,653 1,395
0 1,178
Non-current 1,700 2,291 1,929
2,605 3,033 Equity
Rental vehicles 2,076 2,205 ratio2 26.2 27.8 25.5 31.5
Current 591 449 785 450 [%]
2017 2018 2019 2020 2017 2018 2019 2020 2017 2018 2019 2020
62
1Corporate assets consist of tangible and intangible non-current assets, financial assets and at-equity measured investments; corporate assets amounted to 13.4% of total assets in 2020 (2019: 10.7%); 2Ratio of equity to total assetsQ1/21 UPDATE: TOTAL ASSETS OF EUR 4.42 BN –
SELECTED KEY FIGURES FOR THE SIXT GROUP
EQUITY RATIO REACHED 31.7%
TOTAL ASSETS [EUR m] FINANCIAL LIABILITIES [EUR m] EQUITY [EUR m]
-0.1%
-6.6%
4,429 4,423 +0.4%
Corporate assets1 592 579 2,378
2,221 1,395 1,400
Others incl. Working capital 1,632 1,517
Non-current 1,929 Equity
1,912
ratio2 31.5 31.7
2,326 [%]
Rental vehicles 2,205
Current 450 309
12/20 03/21 12/20 03/21 12/20 03/21 63
1Corporate assets consist of tangible and intangible non-current assets, financial assets and property investments; corporate assets amounted to 13.1% of total assets as of 31 March 2021 (31 Dec 2020: 13.4%); 2Ratio of equity to total assetsSEGMENT REPORTING IN MOBILITY
SELECTED KEY FIGURES FOR THE SIXT GROUP
PROFITABILITY REPRESENTED BY CORPORATE EBITDA
OPERATING REVENUE OPERATING REVENUE OPERATING REVENUE
GERMANY2 [EUR m] EUROPE2 [EUR m] NORTH AMERICA2 [EUR m]
-30.6% -45.3%
-44.2%
978.4 1,032.7 483.3
679.5 576.6 264.2
20192 2020 20192 2020 20192 2020
CORPORATE EBITDA GERMANY [EUR m] CORPORATE EBITDA EUROPE [EUR m] CORP. EBITDA NORTH AMERICA [EUR m]
-72.4% -62.4% >-100.0%
176.3 209.8
48.7 78.9 28.5
2020
20192 2020 20192 2020 20192
64
1Share of
-52.0
consolidated operating revenue generated in the respective regional segment; 2The prior-year comparative figure has been adjusted accordingly to account for the reporting of discontinued operationsQ1/21 UPDATE: POSITIVE EARNINGS CONTRIBUTION FROM
SELECTED KEY FIGURES FOR THE SIXT GROUP
THE US AND EUROPE1
OPERATING REVENUE OPERATING REVENUE OPERATING REVENUE
GERMANY2 [EUR m] EUROPE2 [EUR m] NORTH AMERICA2 [EUR m]
-35.0%
208.1 -36.1%
171.9 -22.0%
135.2
109.9 105.5 82.3
Q1/20 Q1/21 Q1/20 Q1/21 Q1/20 Q1/21
CORPORATE EBITDA GERMANY [EUR m] CORPORATE EBITDA EUROPE [EUR m] CORP. EBITDA NORTH AMERICA [EUR m]
>-100% >+100%
34.7 +10.0%
16.5
5.0 5.5
-5.0
Q1/20 Q1/21 -11.5
Q1/20 Q1/21 65
1Europe = excluding Germany 2Share of Group operating revenue generated in the respective regional segment
Q1/20 Q1/21SIXT’S FREE CASH FLOW STRONGLY INFLUENCED BY
SELECTED KEY FIGURES FOR THE SIXT GROUP
FLEET DIVESTMENT(S)
CASH FLOW ANALYSIS [EUR m]
Cash flow analysis 2015 2016 2017 2018 20192 20202
+843
Gross cash flow
566 638 715 818 706 320
+1,370
658
Fleet investment 534
cash flow, net1 -946 -732 -805 -1,043 -836 534
Other cash flow,
net -194 -101 54 27 -55 -196
-185
Free cash flow -574 -195 -36 -198 -185 658
-836
20192 20202
Fleet investment cash flow, net1
66
Free cash flow
1Rental fleet: Net change in vehicles; Leasing fleet: Proceeds from disposal less payments to acquire lease assets; since 2019 rental fleet only; 2Cash flows from continuing operations; 2019 figures adjusted accordinglyCONTACT DETAILS
SIXT SE
Investor Relations
Zugspitzstrasse 1
82049 Pullach
+49 (0)89 74444 – 5104
investorrelations@sixt.com
67You can also read