Macro Allocation Fund - Investment Review Q3 2021 Portfolio Managers
←
→
Page content transcription
If your browser does not render page correctly, please read the page content below
Macro Allocation Fund

      Investment Review

          Q3 2021

                          Brian D. Singer, CFA, Partner
                               Thomas Clarke, Partner
                                    Portfolio Managers

                                                          13722794
Macro Allocation Disclosure Q3 2021
Performance cited represents past performance. Past performance does not guarantee future results and current performance may be lower
or higher than the data quoted. Returns shown assume reinvestment of dividends and capital gains. Investment returns and principal will
fluctuate with market and economic conditions and you may have a gain or loss when you sell shares. Class N shares are available to the
general public. Class I and Class R6 shares are available only to investors who meet certain eligibility requirements. For the most current
month-end performance information, please call +1 800 742 7272, or visit our Web site at www.williamblairfunds.com.
The information about the William Blair Fund’s holdings contained in this presentation are as of the date specified on the holdings page and are subject
to change thereafter. Information about the Fund’s holdings should not be considered investment advice. There is no guarantee that the Fund will
continue to hold any one particular security or stay invested in any one particular sector. Holdings are subject to change at any time.
This content is for informational and educational purposes only and not intended as investment advice or a recommendation to buy or sell any security.
Investment advice and recommendations can be provided only after careful consideration of an investor’s objectives, guidelines, and restrictions.
Risk
The Fund involves a high level of risk and may not be appropriate for everyone. You could lose money by investing in the Fund. There can be no
assurance that the Fund’s investment objective will be achieved. The Fund holds equity exposures, which may decline in value due to both real and
perceived general market, economic, and industry conditions. Investing in bond markets is subject to certain risks including market, interest-rate,
issuer, credit, and inflation risk; investments may be worth more or less than the original cost when redeemed. Derivatives may involve certain costs
and risks such as liquidity, interest rate, market, credit, management and the risk that a position could not be closed when most advantageous. Investing
in derivatives could lose more than the amount invested. Investment return, principal value, and yields of an investment will fluctuate so that an
investor’s shares, when redeemed, may be worth more or less than their original cost. Investments are subject to a number of types of risk, including
counterparty and contractual default risk. For a more detailed explanation and discussion of these and other risks, please read the Fund’s Prospectus.
The Fund is designed for long-term investors.
Benchmark
The ICE BofAML 3-Month U.S. Treasury Bill Index is comprised of a single issue purchased at the beginning of the month and held for a full month. The
issue selected at each month-end rebalancing is the outstanding U.S. Treasury bill that matures closest to, buy not beyond, three months from the
rebalancing date. The Index is unmanaged and does not incur fees or expenses. It is not possible to directly invest in an unmanaged index.
Please carefully consider the Fund’s investment objectives, risks, charges, and expenses before investing. This and other information is contained
in the Fund’s prospectus and summary prospectus, which you may obtain by calling +1 800 742 7272. Read the prospectus and summary
prospectus carefully before investing. Investing includes the risk of loss.
Copyright © 2021 William Blair & Company L.L.C. William Blair is a registered trademark of William Blair & Company, L.L.C.
Funds distributed by William Blair & Company, L.L.C., member FINRA/SIPC.
2 13722794Summary & Outlook Q3 2021
emerging debt. Within currencies, short exposures to Australian
• Consumer price increases generally gathered pace dollar, euro and Thai baht helped performance, while long exposure
across the world (with Japan and a few other Asian to the Brazilian real, Philippine peso and Singapore dollar detracted.
countries being exceptions), and the annual inflation
rate is above the respective central bank target mid-
point almost everywhere. Strategy Positioning
• No developed country increased policy interest rates,
although expectations for central banks’ first move in The market segment remains long of equities, with an effective
this direction were brought forward in many markets. exposure of +38%. The market segment’s largest country exposures
Rates were raised in several emerging countries as a sign are U.S. and U.K. equities. Markets are net long of fixed income with
of less tolerance for higher inflation. exposure of +9% with primary long exposures in emerging debt.
• We modestly reduced our equity exposure in the
quarter, though overall exposure at quarter end remains Within currencies, the largest long exposures are the Singapore
slightly above its typical average in our portfolios. We dollar, Japanese yen, Russian ruble, and Brazilian real, while the
also have some non-linear exposure to eurozone equity largest short exposures are to the New Zealand dollar, euro, and U.S.
via a long option position, which has caused our overall dollar.
equity weight in portfolios to increase during rising
markets and decrease in market declines.
• For the last two years our fixed income exposure has Strategy Review and Outlook
been held at a higher level than the significant
overvaluation of bonds would warrant because of the Global equities recorded flat overall performance in the third
dominant central bank interference in this market, but quarter (as measured by the MSCI All-Country World Index), with a
during the third quarter we decreased exposure. few bouts of worry-induced volatility. Some positive returns were
• Our largest emerging currency exposures continue to be concentrated in developed markets, and most emerging market
in currencies where the respective central banks have indices finished lower for the quarter. Bond yields moved
been most aggressively hiking policy rates, namely moderately higher in developed markets, and more significantly
Brazil and Russia. higher in some emerging markets where interest rates continued to
be increased quite aggressively. Most currencies depreciated
Performance Summary against the U.S. dollar in the quarter. No developed country
increased policy interest rates, although expectations for central
Macro Allocation completed the quarter with negative performance, banks’ first move in this direction were brought forward in many
with the market segment contributing and currency detracting. markets. Rates were raised in several emerging countries as a sign
Within markets, long exposures to U.S., U.K., Chile, and global energy of less tolerance for higher inflation. Turkey, which has for some
sector equities contributed. Detracting from performance were long time been on its own trajectory, defied the norm and cut interest
exposures to Brazil and Germany equities and long exposure to rates for the first time since the first half of 2020. Turkish interest
3 13722794Summary & Outlook Q3 2021
rates remain the highest in our investment universe, but inflation is Given the very high levels of indebtedness on the part of most
higher still. governments following their unprecedented stimulus efforts to
support economies through the pandemic, above-target inflation is
Consumer price increases generally gathered pace across the world favorable in their eyes, as it works over time to deflate the real value
(with Japan and a few other Asian countries being exceptions), and of their outstanding debt. But this is only the case if inflation does
the annual inflation rate is above the respective central bank target not translate into higher interest rates and yields on the same debt
midpoint almost everywhere. Higher inflation is partly due to the because then the cost of issuing new debt (and rolling that which
recovery of economic growth from the slump induced by the COVID- matures) would rise in line with inflation. This is, of course, why
19 pandemic, and part of it reflects myriad supply bottlenecks, most monetary policy is delegated to independent central banks that are
of which can similarly be traced back to dislocations that were ostensibly not influenced by governments’ fiscal concerns; but it
caused by the prolonged lockdowns that governments implemented also means that those central banks have to continuously convince
as the coronavirus struck in 2020. In major economies, monetary market participants of their autonomy, which has become much
policy makers have continued to emphasize a belief that above- more of a challenge as they have extended their sphere of influence
target price rises will not be permanent, and none have raised into direct asset buying. Therefore, the ability of central banks to
interest rates. Most have also continued with their programs of reassure markets both that price rises are transitory and that they
buying large quantities of sovereign debt to hold bond yields low. will respond if this appears to become no longer true, is becoming
Markets have been giving stronger signals, however, that bond- an ever-greater challenge as more and more “idiosyncratic” and/or
buying plans will soon be scaled back even if policy rate rises will in “temporary” sources of inflation (such as semiconductors and
most cases be delayed until 2022. New Zealand is expected to be the natural gas) are revealed. Against this background, reduced bond
first central bank in the developed world to raise rates, though a market exposure is appropriate in our view.
move in August was put off at the last minute partly because the
country’s defenses against imported infections of COVID-19— We modestly reduced our equity exposure in the quarter, though
successful in keeping the pandemic out of New Zealand for some overall exposure at quarter-end remains slightly above its typical
time—appeared to have been breached. This triggered a nationwide average in our portfolios. We did increase exposure in China, which
lockdown that lasted for several weeks in its largest city. Developed is a market whose fundamental attractiveness had been improved
world bond yields traded higher as both reported inflation and as a result of various regulatory actions by the authorities to rein in
improving growth increased confidence that monetary leverage. Further actions, most recently in China’s property sector,
accommodation is set to wind down, though yields remain have continued to weigh on sentiment, but we believe the bottom
extremely low. We sold bonds, reducing exposure, early in the line is that the curbing of excesses is a long-run beneficial
quarter in the United States, Germany, and China. Our fixed income development for China’s markets and is being wrought by
exposure has for the last two years been held at a higher level than leadership whose interests lie in facilitating China’s continued
the significant overvaluation of bonds would warrant because of the emergence as an economic power. Our valuation assumptions
dominant central bank interference in this market, but we are now associated with the equity market have incorporated significantly
decreasing exposure. slower growth expectations (relative to China’s history) for some
time.
4 13722794Summary & Outlook Q3 2021
We also have some nonlinear exposure to eurozone equity via a each early in the quarter. We also moved long of the Chilean peso—
long option position, which has caused our overall equity weight in which we had held previously in 2020 but removed—as Chile’s
portfolios to increase during rising markets and decrease in market central bank also began to raise interest rates in response to a quite
declines. This is known as convex equity exposure, and we have vigorous economic growth rebound. Another modest change in
reset and rolled the option position going forward. Late in the currency strategy was a response to weaker European currencies
quarter, we reduced our long position in Chile, which had relative to North American—this was manifested in the euro-U.S.
outperformed other emerging markets in recent months. dollar rate and some others, and the change we made was to buy
Norwegian krone against Canadian dollar.
In currencies, we also have a long option position, which is a call on
Japanese yen (JPY) and a put on New Zealand dollar (NZD). In a We have retained a small exposure to the Turkish lira (TRY) since
similar way, the option increases our JPY exposure (and decreases March—when we significantly cut the position in response to a
our NZD exposure) if the JPY appreciates (versus the NZD), and it shock dismissal of a market-friendly central bank head who was
does the reverse if the JPY falls. In valuation terms, the NZD is highly replaced with another, more amenable to President Erdogan’s
overvalued relative to the JPY so the exposure inherent in the option unique desire to cut interest rates in the face of rising inflation.
trade is aligned with our valuation view. In addition, this particular Although the credibility of monetary policy in Turkey has been
exchange rate is often negatively correlated with global equities severely curtailed since then, the new governor kept Turkey’s
(the JPY tends to rise and the NZD tends to fall when equities go interest rate at 19% (the highest in our investment universe) until
down), so as well as it having valuation support, the option can have September, at which point it was cut to 18% even though inflation
the effect of slightly hedging equity exposure elsewhere in our has not fallen. The scarcely credible monetary regime has weakened
portfolios. Another factor in the attractiveness of options as the TRY but has not yet tempted us to re-increase this exposure.
investments is the forward-looking expectation of volatility of the However, the very high nominal carry offered by Turkish interest
underlying market prices. During the period, we have held the rates means that a material amount of TRY depreciation remains
NZDJPY and eurozone equity options, these implied volatilities have compensated, and in total return terms, TRY exposure has had a
been unusually low, making options more compelling to buy in view positive performance effect in the last six months.
of their other advantageous (convex) feature.
Our long-term investment objective is to deliver positive investment
Elsewhere in our currency strategy, our largest emerging currency returns through a market cycle. We remain grounded in
exposures continue to be in currencies where the respective central fundamental valuation as our first stage—we strive to take only
banks have been most aggressively hiking policy rates, namely compensated risk and are unwilling to extend exposures unduly in a
Brazil and Russia. In contrast to developed world central banks, reach for yield that would be dictated not by opportunities and risks
those in Brazil and Russia do not consider themselves to have the but by very low real interest rates. There will be environments in
same luxury of presuming domestic inflation is temporary (and which we conclude that macro markets do not provide returns and
indeed, inflation is higher in these countries than in the United risks compatible with portfolio objectives, alongside other periods
States and Europe). Monetary tightness is positive for the Brazilian where compensation is abnormally high. During the last decade, the
real and the Russian ruble, and both currencies remain very challenge of navigating these evolving environments has remained a
fundamentally attractive in our view. We increased our exposure to significant component in the investment landscape, but we find our
5 13722794Summary & Outlook Q3 2021
investment process, dialogue, and decision-making well-equipped
to meet this challenge in an appropriate way. We remain vigilant as
we assess new and relevant information to capture future
investment opportunities in a timely manner and will continue
balancing the relationship between risk taken and compensation
expected.
6 13722794Performance Q3 2021
Investment Performance for Periods ended
3 Months YTD 1 Year 3 Year 5 Year 7 Year SI* SI**
9/30/2021
Macro Allocation Fund (WMCJX)
-0.18% 3.87% 10.66% 2.61% 2.02% 0.52% 1.31% --
Institutional Class R6
Macro Allocation Fund (WMCIX) Class I -0.09% 3.87% 10.64% 2.54% 1.93% 0.44% -- 3.77%
Macro Allocation Fund (WMCNX) Class N -0.18% 3.66% 10.26% 2.28% 1.66% 0.17% -- 3.50%
BofA Merrill Lynch 3-Month U.S. Treasury
0.01% 0.04% 0.07% 1.18% 1.16% 0.87% 0.77% 0.64%
Bill Index
HFRI Macro Discretionary Thematic
-4.11% 4.52% 12.20% 7.52% 4.84% 3.12% 2.78% 2.55%
Index
* Inception: 10/21/2013
**Inception: 11/29/2011
Expense Ratios:
Gross Net
Class R6 Shares 1.04%
Class I Shares 1.15% 1.12%
Class N Shares 1.47% 1.37%
Expenses shown are as of the most recent prospectus and include acquired fund fees and expenses. The net expense ratio reflects that the Fund's Adviser has
contractually agreed to waive fees and/or reimburse expenses to limit fund expenses until 4/30/2022.
Performance cited represents past performance. Past performance does not guarantee future results and current performance may be lower or higher than
the data quoted. Returns shown are since inception total returns, which assume reinvestment of dividends and capital gains. Investment returns and
principal will fluctuate with market and economic conditions and you may have a gain or loss when you sell shares. For the most current month-end
performance information, please call 1-800-742-7272, or visit our Web site at www.williamblairfunds.com. Class N shares are available to the general public
without a sales load. Class R6 and Class I shares are available to certain institutional investors.
The BofA Merrill Lynch 3-Month U.S. Treasury Bill Index measures total return on cash, including price and interest income, based on short-term government Treasury
Bills of about 90-day maturity. The index is unmanaged, does not incur fees or expenses, and cannot be invested in directly. The HFRI Macro Discretionary Thematic
Index includes hedge fund strategies primarily reliant on the evaluation of market data, relationships and influences, as interpreted by an individual or group of
individuals who make decisions on portfolio positions; strategies employ an investment process most heavily influenced by top down analysis of macroeconomic
variables. Constituents are equally weighted and returns are reported net of underlying manager fees. The index is unmanaged and cannot be invested in directly.
7 13722794Performance Analysis Q3 2021
The below table shows the calculated regional performance attribution of the Macro Allocation Fund by asset segment for the
quarter.
Total (%) -0.2
Equity 0.5
North America 0.1
Europe 0.0
Asia 0.0
Emerging 0.3
Other 0.1
Fixed Income -0.2
North America Rates 0.0
Europe Rates 0.0
Asia Rates 0.0
Emerging -0.4
Credit 0.0
Low Duration 0.1
Currency -0.1
North America 0.1
Europe 0.2
Asia 0.3
Emerging -0.9
Residual -0.3
Past performance does not guarantee future results. Portfolio exposures and attribution are based on the Macro Allocation Fund (Class N). Performance
attribution is sourced from Cloud Attribution Ltd. Using the Karnosky-Singer performance attribution methodology.
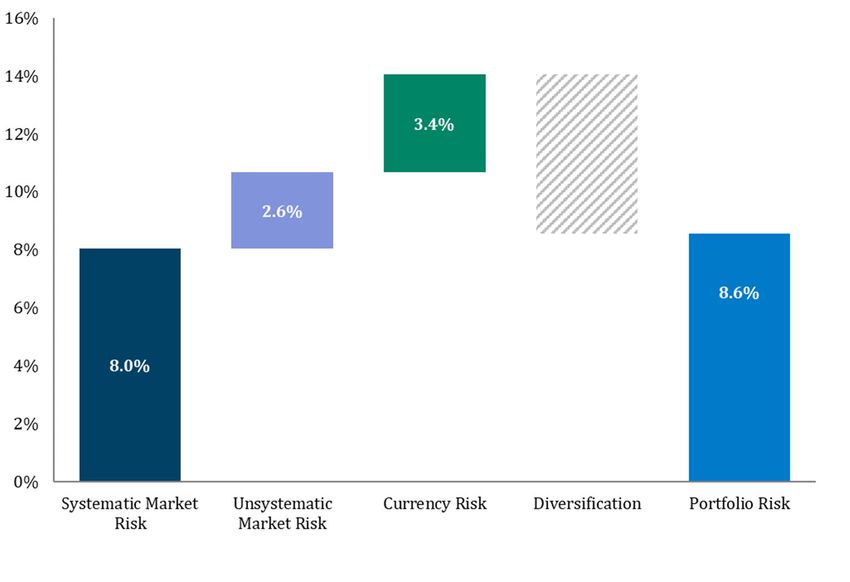
8 13722794Forward-Looking Risk Q3 2021
The below chart shows the expected sources of investment risk* for the Macro Allocation Fund.
Source: William Blair
*The DAS team’s expectation of the portfolio’s volatility as viewed through the team’s proprietary Outlook risk model, in which the team’s near-term risk assumptions
are quantified.
9 13722794Selected Exposures Q3 2021
The detail below shows selected market and currency strategy exposures of the Macro Allocation Fund as of quarter-end.
Equity 38.1% Active Currency
U.S. 6.6% U.S. Dollar (USD) -18.9%
Canada 0.4% Canada Dollar (CAD) -10.2%
Europe (ex-U.K.) 2.7% Other Americas 27.6%
UK 8.7% Euro (EUR) -9.2%
Asia Developed 5.5% Switzerland Franc (CHF) -5.5%
Emerging 14.2% Great Britain Pound (GBP) 2.5%
Other Europe 0.5%
Fixed Income 9.2% Australia Dollar (AUD) and New Zealand Dollar (NZD) -23.2%
1,*
U.S. Treasury & Credit 3.2% Japan Yen (JPY) 11.1%
1,*
Non-U.S. Treasury & Credit -4.4% China Yuan (CNY) 0.0%
Emerging 10.4% Asia (Excluding JPY and CNY) 16.8%
Other 8.6%
Cash & Other 52.7%
2
*Credit Detail Select Exposures Detail
U.S. Investment Grade Spread 3.1% Russian Ruble (RUB) 11.5%
U.S. High Yield Spread 1.1% Brazilian Real (BRL) 11.5%
U.S. MBS Spread 0.0% Colombian Peso (COP) 8.2%
European Investment Grade Spread 2.2%
European High Yield Spread 0.0%
1
Reflected as 10-year exposures
2
Select currency exposures by largest expected contribution to portfolio risk
Not intended as investment advice. Allocations are subject to change without notice.
10 13722794Additional Details Q3 2021
This section provides additional commentary relating to the strategy changes within the Macro Allocation Fund during the
quarter.
8 July 2021: Increasing Brazilian real (BRL) and Russian ruble (RUB), and decreasing U.S. dollar (USD)
Based on our valuation framework, the BRL and the RUB are both fundamentally undervalued currencies. This strategy change increases existing
long BRL and long RUB exposures and is a continued response to the valuation opportunities in these currencies. Non-valuation influences have
weighed against these currencies, but we believe they are adequately factored into their current levels. Inflation has increased in Brazil and
Russia, and in both cases the central banks have responded by embarking on policy interest rate increases after a lengthy cycle of earlier
reductions that brought interest rates to historic lows. Conventional wisdom expects additional monetary tightening looking forward.
13 July 2021: Decreasing U.S. fixed income
Based on our valuation framework, most developed bond markets score unattractive on an absolute basis. Over the last few months, long-end
rates have fallen globally, especially in the U.S., making the 10-yr bonds more unattractive. Conventional wisdom continues to wax and wane
around medium-term inflation and real rate expectations (captured in our Reflation macro theme), while realized inflation has generally
continued to come in above expectations. Fed rate hike expectations have clearly moved closer, while expectations on the timing of tapering of
bond purchases remain quite varied.
29 July 2021: Increasing China equity
Based on our valuation framework, China equity is attractive and has gotten more attractive on a relative basis during the past several months.
The underperformance that has occurred since February has been primarily due to a rolling series of domestic regulations. These have increased
uncertainty for a significant share of the China index that is geared toward fintech/shadow banking, data and security, concerns over
monopolistic behavior, and, most recently, education technology. At the same time, our medium-term assessment of Why stage considerations are
broadly neutral with respect to economic growth and monetary policy.
29 July 2021: Decreasing China fixed income
Based on our valuation framework, China fixed income is unattractive on an absolute basis. Yields have returned to similar levels as when we first
initiated exposure in early 2020, yet the Why assessment is less compelling today. Despite relatively benign inflation, conventional wisdom for an
underlying mild tightening cycle has persisted for several quarters. Yet, most recently that has given way to a resumption of reserve requirement
ratio (RRR) cuts (which were already underway), as well as a flight to safety from a weak equity market. While longer-term considerations
around slowing growth and inflows are supportive, the near-term assessment is more neutral now.
9 August 2021: Decreasing Germany fixed income
11 13722794Additional Details Q3 2021
Based on our valuation framework, Germany sovereign bonds remain unattractive. More specifically, after last buying back 5-year (short)
exposure to flat in late February, yields have since fallen by about 20 bps. In responding to COVID, the ECB has been forceful in its policy of
keeping sovereign bond rates down in the eurozone, and conventional wisdom generally regards the removal of accommodation to be slower
than in other developed markets. Its bond purchases especially have helped push German rates down to levels rarely seen before except for a
brief period in 2019 and very momentarily in the extreme stress of Q1 2020. We continue to anticipate forces that can ultimately increase
German bond yields. For one, the economic recovery should eventually encourage the ECB to decrease some of its monetary support, thus
increasing real yields. In addition, Germany may eventually see a rise in inflation on the back of loose monetary policy and economic recovery.
11 August 2021: Increasing Thai baht (THB), and decreasing Indonesian rupiah (IDR) and U.S. dollar (USD)
These changes are primarily motivated by fundamental value versus price. Although both the THB and the IDR are overvalued currencies, in the
last 12 months the IDR has appreciated significantly versus the THB such that the situation now justifies a larger short in IDR than in THB. In the
near term, both Thailand and Indonesia have experienced a renewed climb in cases of COVID and vaccination rates are relatively low so far in
both countries. This is negative for growth in both economies as some restrictions on activity are reimposed and revenue from tourism is
significantly curtailed. In the case of Thailand, conventional wisdom has begun to discount the possibility that central bank interest rates (which
are already very low at 0.5%) may be reduced again. In Indonesia, policy interest rates remain at post-pandemic lows (3.5%) but are unlikely to
be reduced again. As a consequence, the THB has been affected worse by these developments, which we are using to adjust our exposures in this
strategy change.
13 August 2021: Increasing Australian dollar (AUD) and decreasing New Zealand dollar (NZD)
The strategy change is mainly driven by the relative performance of this correlated currency pair. From a conventional wisdom standpoint, the
recent AUD weakness has been attributed to a divergence in rate expectations between the two countries. The market is pricing in a rate increase
in New Zealand at the meeting next week, with a total of four increases priced in over the next year. In Australia, the market expects no rate
increases during the next year.
17 August 2021: Partially closing JPY call / NZD put option
We initiated a JPY call / NZD put option in June as a means of providing downside convexity at a low cost. The implied volatility of the NZD/JPY
exchange rate (representing the cost of option exposure relative to linear exposure) was close to the lowest level at which it has historically
traded, but since then we have seen the implied volatility increase moderately, which has benefitted the exposure. The currency pair has also
moved in favor of the option price despite a lack of risk-off sentiment. Given these conditions we are partially removing part of the option
strategy.
20 August 2021: Increasing Chilean peso (CLP) and decreasing Mexican peso (MXN)
12 13722794Additional Details Q3 2021
The strategy change is mainly driven by the relative performance of this currency pair. The Chilean peso has been relatively weak compared to
the Mexican peso, and the broader currency universe, year-to-date. This takes the strategy from flat to long in the CLP while reducing a long
exposure to MXN.
23 August 2021: Increasing Norwegian krone (NOK) and decreasing Canadian dollar (CAD)
These changes to strategy are in line with valuation opportunities and push us closer to our valuation-based allocations. The NOK has steadily
depreciated relative to the CAD year-to-date. Both CAD and NOK are sensitive to oil prices, with the NOKCAD cross-rate having a somewhat-
positive beta to oil prices.
24 August 2021: Increasing Korean won (KRW) and decreasing Indian rupee (INR)
These changes to strategy are in line with valuation opportunities. We last bought INR on 11 May 2021 and since that time it has appreciated 3%
versus the KRW. On valuation grounds, we are no longer justified keeping the prevailing size of INR long exposure. We have been short KRW for
some time, our last trade was to reduce the short exposure in August 2020. A combination of reassessment of fundamental value and recent
depreciation of KRW has been such that a short exposure is no longer warranted, and a small long exposure is justified.
26 August 2021: Increasing Malaysia and Vietnam equity, and decreasing ACWI ex-U.S. equity
This strategy change increases exposure to attractive equity markets in Malaysia and Vietnam while keeping overall equity exposure unchanged
by decreasing broad ACWI ex-U.S. exposure. The opportunity in Malaysia has been steadily widening throughout this year, and in Vietnam over
just the past couple months. In both cases, the apparent primary source of relative weakness has been near-term conventional wisdom that
economic activity is being subdued by limitations imposed on the back of elevated COVID cases in combination with low vaccination rates. In both
countries, the willingness of the population to receive vaccines is quite high. Malaysia has, in fact, after some initial delay rolled out one of the
quickest paces of vaccination administration to date, and will in short order be among the countries with the highest vaccination rates, which will
allow them to finally begin to roll back some of their movement control orders. Vietnam’s strategy is more nuanced as they still have a limited
near-term supply of vaccines. They are prioritizing distributing those in areas where economic activity is most robust and specifically will soon
have vaccinated most of its population in Ho Chi Minh City, allowing for “re-opening” in the coming weeks or months after a period of significant
lockdown.
2 September 2021: Increasing Chilean peso (CLP) and decreasing U.S. dollar (USD)
These changes to strategy are in line with valuation opportunities. The CLP has become attractive in the last four months as it has generally
depreciated against other currencies. In contrast, the USD is highly overvalued based on our valuation framework and a bigger short exposure is
warranted. Since we last bought CLP, the central bank surprised market expectations with a larger than expected interest rate increase on 31
August, in response to a strengthening growth outlook and rising inflation. The aggressiveness of the interest rate change has altered market
expectations to now expect several further increases in the coming months. Although interest rates are currently low, we anticipate that the
reintroduction of positive carry will be a short-term positive backdrop to the CLP’s undervaluation looking ahead.
13 13722794Additional Details Q3 2021
17 September 2021: Increasing China large cap equity and decreasing China small cap equity
While there continue to be several evolving A-share indices capturing different levels of investability, one proxy for relative price changes has
been the Stock Connect AH Premium Index. Currently, this index indicates that A-shares are trading somewhat above their median premium level.
This guidance, along with other estimates of fundamental value, suggest the A-share small cap market is somewhat less attractive than MSCI
China. While fundamental valuation is the primary reason for the relative shift here, it is also of note that the divergence in performance has been
primarily due to a rolling series of domestic regulations. These have increased uncertainty for a significant share of the MSCI China index geared
toward fintech/shadow banking, data and security, concerns over monopolistic behavior, and, most recently, several social-oriented priorities
around education, gaming, and gambling. At the same time, our medium-term assessment of Why stage considerations are broadly neutral with
respect to economic growth and monetary policy.
24 September 2021: Decreasing Chile equity
Based on our valuation framework, Chile equity remains attractive on an absolute basis. However, after a strong rally from its lows a few months
ago, it is now less attractive on an absolute and relative basis. From a conventional wisdom standpoint, short-term economic activity has been
strong, but that coincides with the central bank initiating rate hikes. Much focus continues to be on the policy backdrop, especially on the lead up
to the first round of elections coming up in November.
14 13722794Glossary - Terms
Beta: A quantitative measure of the volatility of the portfolio relative to the overall market, represented by a comparable benchmark. A beta greater
than 1 is more volatile than the overall market, while a beta less than 1 is less volatile, and could be expected to rise and fall more slowly than the
market.
Risk (Standard Deviation): A measure of the portfolio’s risk. A higher standard deviation represents a greater dispersion of returns, and thus a
greater amount of risk. The annualized standard deviation is calculated using monthly returns.
Sharpe Ratio: A risk-adjusted measure calculated using standard deviation and excess return (Portfolio return – Risk Free Rate) to determine reward
per unit of risk. The higher the Sharpe ratio, the better the portfolio’s historic risk-adjusted performance.
15 13722794You can also read