Property Times Baltic Retail H2 2012 New projects in the pipeline
←
→
Page content transcription
If your browser does not render page correctly, please read the page content below
Property Times
Baltic Retail H2 2012
New projects in the pipeline

8 February 2013                          Consumer confidence strengthened and household consumption expanded
                                         during 2012. The turnover of retail trade is expected to continue its growth
                                         also in 2013.
Contents
Macro-economic trends in Baltics 2       Most of the development projects completed in 2012 were medium-scale
Retail Market in Estonia        4        (mainly hyper- and supermarkets); several large-scale retail projects are in the
                                         pipeline for the upcoming years, but only a few of them have the construction
Retail Market in Latvia         8
                                         process already initiated.
Retail Market in Lithuania     12
                                         Vacancy rate is close to 0% in the shopping centres with successful
Author                                   management. However, shopping centres with ineffective organisation or less
                                         favourable locations still struggle over their occupancy rates.
Aivar Tomson
Baltic Head of Research                  Improving retail trade turnover and increased occupancy has upward pressure
+ 372 6 264 250                          on rents in prime shopping schemes. There are no notable rental rate changes
aivar.tomson@dtz.ee                      in secondary cities and secondary locations in capital cities.

Contacts                                 The retail investment market saw an increased interest from foreign property
                                         investors. Several investment transactions in retail segment were in process in
Magali Marton                            2012, with two of them being closed by the end of the year (Gedimino 9 SC in
Head of CEMEA Research                   Vilnius and Mustika SC in Tallinn). Retail investment prospects for 2013 are
+ 33 (0)1 49 64 49 54                    also promising.
magali.marton@dtz.com                Figure 1

                                     Retail confidence index
Hans Vrensen
Global Head of Research
+ 44 (0)20 3296 2159
hans.vrensen@dtz.com

                                     Source: National Statistics, Estonian Institute of Economic Research

DTZ Research
Baltic Retail H2 2012

Macroeconomic Trends in the Baltic States                         Annual inflation meanwhile has reached its historical
                                                                  minimum ever since autumn 2010, and averaged at about
Estonia                                                           1.6% at the end of 2012, coming primarily from globally
Estonian economy is in quite a good health, with                  evident increase in fuel and food prices.
strengthened domestic demand playing the major role in
economic development. Nonetheless, despite promising              The problems that still persist are those of high
GDP growth, the uncertainty towards surrounding                   unemployment rate (although it is almost twice as low as in
environment is still evident.                                     Greece or Spain, the rate of 13.5% is still too large) and
                                                                  social inequality. It is worth mentioning that unemployment
Based on the information presented by the Bank of Estonia         was relatively high in Latvia ever since the re-establishment
and Statistics Estonia, in Q3 2012, GDP increase was 3.5%         of independence; yet during the last eight years (and thus
on a year-on-year basis and 1.6% on a quarterly basis, with       also during the economic boom) it was also higher than that
construction sector being the largest contributor to the          experienced by the closest neighbours, Lithuania and
economic growth. According to the Bank of Estonia                 Estonia.
forecasts (published in December 2012), GDP growth shall
round up to 2.9% in 2012, is expected to reach 3.0% in 2013       The commonly held opinion however is that the hardest
and 4.0% in 2014.                                                 times are behind. 2013 therefore is expected to be marked
                                                                  with slower, but still one of the highest GDP growth rates in
The year-on-year CPI change meanwhile was 3.7% in Q3              Europe (3-3.8% per year). The average income level, which
2012. Inflation was mainly caused by the increase in food,        currently stands at about 60% of EU average (as compared
housing and fuel prices. According to the Bank of Estonia         to 30% in 1995), is expected to grow slowly and reach its
forecasts, the annual CPI change in 2012 would round up to        pre-crisis level, about 711 EUR before taxes. As usual, the
4.3%, and is expected to slow down in the upcoming two            income in Riga will be about 15% higher than that in the
years, with the forecasted change of 3.6% in 2013 and 2.4%        rest of the country; heavily pronounced segmentation in
in 2014. Such a deceleration however is only possible with        employment sector will still persist.
no substantial upward changes in the global fuel prices;
another underlying assumption is that global food prices          The government meanwhile has set the target of meeting
that have heavily increased in 2012 will exhibit a decline        Maastricht criteria (inflation not exceeding 2.7%, budget
within the upcoming two years.                                    deficit up to 3.0%, debt-to-GDP ratio up to 41.9%) and thus
                                                                  to receive an invitation to join Eurozone in 2013, with the
Statistics Estonia informs that the unemployment rate             subsequent Euro introduction in early 2014.
within the population group aged 15-74 years dropped from
10.2% in Q2 2012 to 9.7% in Q3 2012. More than one third          Lithuania
of these officially registered unemployed have been               Statistics Lithuania informs that in Q3 2012, the real GDP
unoccupied for more than two years already. Most of the           growth was 4.4% on a year-on-year basis. At the same time,
unemployed workforce finds occupancy in construction and          the GDP that was produced within the three quarters of
industrial sectors, as well as in the sector of seasonal works.   2012 outperformed the same period of 2011 by 3.5%.
Latvia                                                            Central Bank of the Republic of Lithuania meanwhile goes
                                                                  more moderate in its forecasts, and predicts a 3.0% annual
In 2012, Latvia, the country famous for its austerity             GDP growth by the end of 2012, along with the 3.1%
measures, has managed to accomplish something                     increase forecast for 2013 (down from the previous forecast
unattained by any other country severely affected by the          of 3.4%).
recent crisis, namely, to maintain its currency exchange rate
fixed. On top of that, Latvia’s economy, after shrivelling by     Average annual inflation meanwhile stood at 3.2% as of
more than 20% from its peak, remarkably outperformed the          November 2012 (calculated on the basis of HICP, the
cautious government forecasts for 2012 of 1-2% growth and         harmonised index of consumer prices), and is 0.4% down as
rose by more than 5% instead, making it the best performer        compared to the annual inflation figure a year ago. The year
in the 27-nation European Union.                                  2012 is expected to round up with the 3.1% annual inflation
                                                                  rate, as compared to 4.1% figure at the end of 2011. In
The budget deficit is also down sharply (1.7% from GDP as         2013, the forecasted inflation rate is 2.8%.
compared to 4% at the end of 2011); both manufacturing
(10.5% growth within a year, more than 35% growth from            The unemployment rate, which stood at 13.3% in Q2 2012,
December 2009) and exports (22.6% growth within a year,           decreased by 1% within a single quarter (12.3% in Q3 2012).
as compared to 12.1% annual growth in import rate) are            The forecasts for the upcoming year are more moderate; by
soaring, and already exceed pre-crisis levels.                    the end of 2013 the unemployment is expected to reach
                                                                  11.6% figure.

www.dtz.com                                                                                                    Property Times   2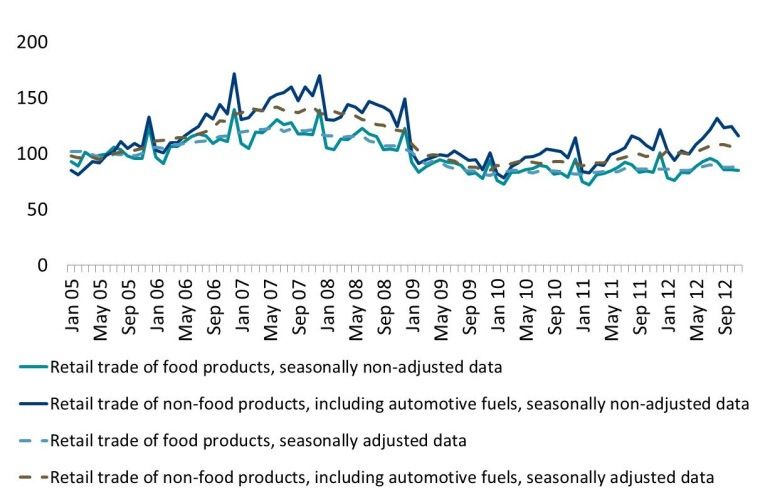
Baltic Retail H2 2012

Table 1

Key Macroeconomic Indicators
                                                           Estonia   Latvia   Lithuania
Population (in thousands)                                  1,340     2,033     3,008
Urban population                                            65%       68%       67%
Area (thousand km²)                                          45       65         65
Population density (per km²)                                 30       31         46
Capital city                                               Tallinn    Riga     Vilnius
Population in capital cities (thousand)                     401       649       534
Currency                                                    EUR       LVL       LTL
Exchange rate (€)                                            X       0.7028    3.4528
GDP at current prices (bn €, 4Q 2011 - 3Q 2012)             16.8      21.6       32
GDP per capita, at current prices (€, 4Q 2011 - 3Q 2012)   12,503    10,618    10,701
GDP growth (%, 3Q 2012)                                      3.5      5.3        3.5
Inflation rate (%, 3Q 2012)                                  3.7      1.7        3.2
Unemployment rate (%, 3Q 2012)                               9.7      13.8      12.3
Source: National Statistics, Oxford Economics

www.dtz.com                                                                       Property Times   3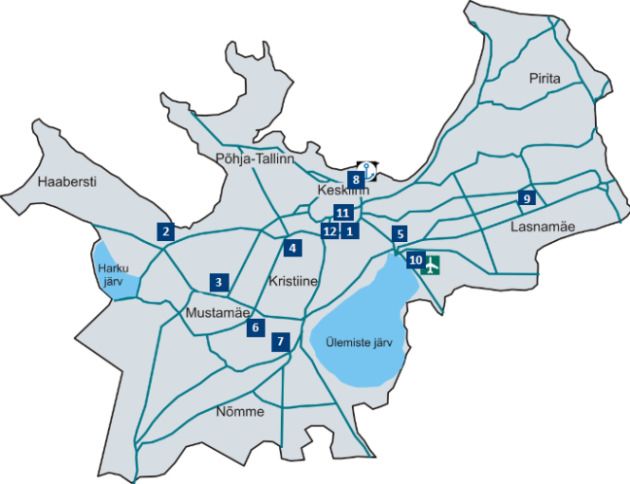
Baltic Retail H2 2012
Retail Market in Estonia New Supply
Most of the development projects that were completed in
Retail Trade Turnover
2012 were small- to medium-scale properties sized 2,400–
Retail market started to show stable signs of recovery 6,500 sq m.
already in 2010. Within the first 11 months of 2012, total Hence in the beginning of 2012, Bauhof DIY store, located in
retail trade turnover (at constant prices) increased by 7%, as close vicinity to Tallinn, Laagri hamlet, finished its
compared to the same period in 2011. expansion. In May 2012, Magistral Shopping Centre (owned
Figure 2 by Citycon) that was closed in September 2011 for
renovation and expansion, re-opened with 3,000 sq m of
Retail sales volume in Estonia
additional retail space and improved parking possibilities in
extra parking area developed on the centre’s roof. In
September 2012, Konsum retail store called Raudalu
Konsum with 2,000 sq m of leasable area was completed
next to Viljandi road (a major road that leads to Tallinn). In
November 2012, the largest Maxima shopping centre (XX
format) was introduced, offering 5,000 sq m of shopping
space on J. Smuuli Road. The total development costs for
this centre exceeded 5 M EUR.
The last large-scale development was the 12,000 sq m
expansion of Kristiine SC back in 2010. By the end of 2012,
however, most of the prime shopping centres were fully let,
with demand for prime retail space already exceeding the
Source: DTZ Research
supply available on the market. Therefore, the most popular
shopping schemes, such as Rocca al Mare and Ülemiste, are
Regional View not only planning, but also already initiating their
The first large modern shopping centres in Tallinn were expansions.
developed already in 1998. Ever since then, the tendency of In addition, two new large-scale retail projects have a high
major retail brands gathering to large shopping centres has probability of being completed in 2013-2014 and thus
only strengthened. Although many cities have preserved bringing additional 64,000 sq m of retail space into the
their central high streets along with small retail districts, market; three more large-scale projects with the total
their market share is continuously decreasing, as people leasable area 315,900 sq m are in the pipeline for the
prefer large centres where most shopping and service upcoming 4-5 years. It should be dully noted, however, that
needs can be satisfied with a single visit. The largest amount such a substantial amount of new shopping space can be a
of retail space as well as the highest number of shopping serious threat for the market becoming oversaturated.
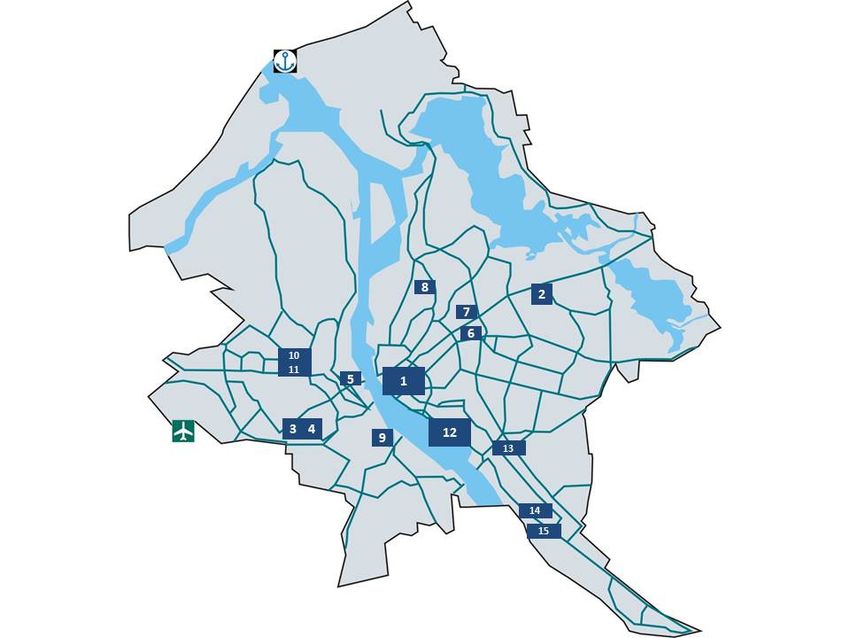
centres is located in Tallinn, the capital of Estonia. Large Map 1
scale shopping centres were also developed in Tartu and
Pärnu, whereas smaller scale modern shopping schemes Major retail centres in Tallinn
can also be found in smaller cities such as Viljandi, Narva,
Jõhvi, Rakvere and Paide.
Tallinn
The lion share of retail activity in Tallinn is gathered to
twelve major shopping centres and department stores. The
Old Town and city centre can be considered as a separate
st
retail area, with different businesses operating on the 1
floors along the streets.
By the end of 2012, the total retail stock in Tallinn
(accounting for the premises larger than 5,000 sq m) was
approximately 495,000 sq m; 62% of this stock falls under
the category of shopping centres, the most demanded of
which are Viru Centre, Kristiine Centre, Ülemiste Centre and Source: Google Map, DTZ Research
Rocca al Mare Centre.
www.dtz.com Property Times 4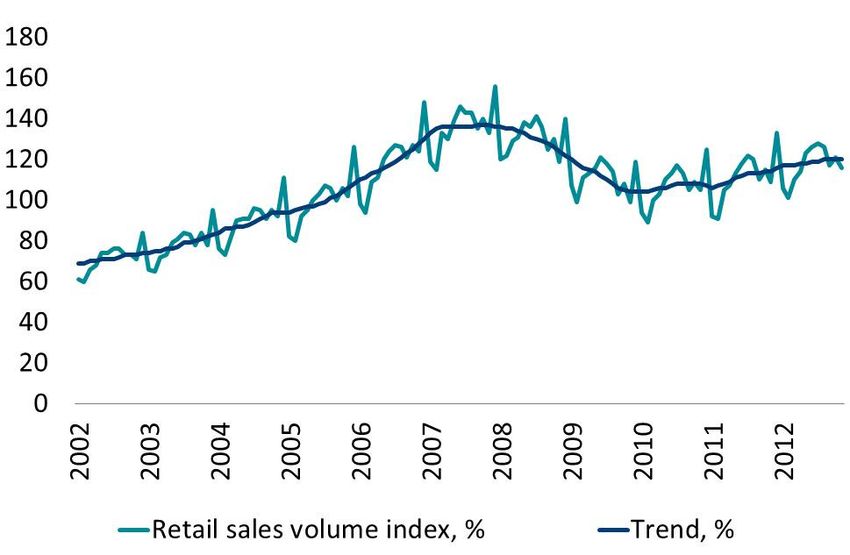
Baltic Retail H2 2012

Rental Rates                                                        Figure 3

The last significant change in rentals shook the market in          Shopping centre stock in Tallinn, 000 GLA sq m
2009, with the rates dropping by 10-15% in shopping
                                                                     350 000
centres outside city centre and street retail premises in city
centre; in some of the cases, the downward adjustment was            300 000
as high as 20-30%. While the rates were mostly reduced on
                                                                     250 000
a temporary basis, additional incentive for tenants was the
release from the annual rental rate indexation.                      200 000
The years 2011 and 2012 brought no remarkable changes in             150 000
rental fees, including the rates of anchor tenants. In many
cases, the rent discounts negotiated during the economic             100 000
decrease were prolonged for a few years.                              50 000
Nonetheless, given the current non-existence of vacant
                                                                               0
spaces in successful retail schemes, the rents are expected                        2004 2005 2006 2007 2008 2009 2010 2011 2012
to exhibit a moderate growth in 2013.                                                by beginning of year     new deliveries
                                                                    Source: DTZ Research

Table 2

Retail projects in pipeline for 2013-2017 in Tallinn
 Retail object                   Address                         Total area, sq m            GLA, sq m       Year of completion
 Postal Office                 1 Narva Road                                                    7,000                2013
 Panorama City                 1 J. Smuuli Road                      77,000                   57,000                2014
 Ülemiste Keskus               2 and 4 Suur-Sõjamäe Str.             53,000                   31,000                2015
 Tallinn Europa                2 Peterburi Road                       n/a                     55,000                 n/a
 Retail Park of Tallinn
                               Rae Parish                               n/a                   20,000                n/a
 (former American Corner)
 Gate Tallinn                  Saue Parish                           240,900                    n/a                 n/a
Source: DTZ Research

Table 3

Main shopping centres in Tallinn
 No. on    Main shopping                                                                                          Year of
                                             Address               Total area, sq m           GLA, sq m
 the map centres                                                                                                construction
     1     Stockmann                53 Liivalaia Str.                    24,520                 14,500             1996
     2     Rocca al Mare            102 Paldiski Rd.                     64,640                 53,300             1998
     3     Mustika Keskus           116 A. H. Tammsaare Rd.              20,300                 16,970             1998
     4     Kristiine Keskus         45 Endla Str.                        53,000                 42,600             1999
     5     Sikupilli Keskus         87 Tartu Rd.                         27,300                 15,100             2000
     6     Magistral                201/203 Sõpruse Ave.                 15,300                 11,900             2000
     7     Järve Keskus             238 Pärnu Rd.                        62,100                 41,800             2000
     8     Norde Centrum            7 Lootsi Str.                        14,200                 10,600             2002
     9     Lasnamäe Centrum         13 Mustakivi Str.                    23,600                 19,600             2003
    10     Ülemiste Keskus          4 Suur-Sõjamäe Str.                  49,700                 37,500             2004
    11     Viru Keskus              4/6 Viru Square                      32,000                 26,300             2004
    12     Solaris                  9 Estonia Ave.                       42,900                 12,800             2009
  Source: DTZ Research

www.dtz.com                                                                                                       Property Times   5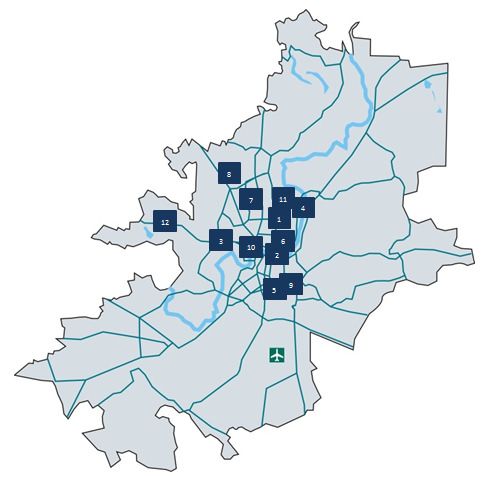
Baltic Retail H2 2012

Table 4                                                         Port Artur 3 next to Pärnu River (79,000 sq m) and a
Rental fees in shopping centres in Tallinn                      shopping centre on Via Baltica road (100,000 sq m), on
                                  Rent, €/sq                    the plot of the former Pärnu dairy plant, are expected to
 Type of tenants                                    2013        be introduced into the market within the upcoming few
                                  m/month
                                                                years.
 Anchor tenants                   7,5 – 10          →
                                                    →           Rental rates in Pärnu experienced a major downward
 Old Town                         14 – 25
                                                                adjustment of 20-30% in the years 2008-2009.
 At pedestrian flow in city                         ↗
                                  10 – 25                       Throughout 2010, the fees remained mainly stable,
 centre
                                                                whereas the beginning of 2011 brought slight increase to
 In shopping centres in city                        →           be followed by a stable period in terms of rental rates up
                                  12 – 45
 centre                                                         till the end of 2012.
 In shopping centres outside                        →
                                  12 – 32                       By the end of 2012, the vacancies in successful retail
 the city centre
                                                                schemes, such as Kaubamajakas, Port Artur 2 and Pärnu
Source: DTZ Research
                                                                Keskus, are as low as 5%. Vacancy rates in shopping
Vacancy                                                         centres with lower customer flow, as well as vacancy
Vacancies in popular shopping centres have reached their        rates in commercial premises outside shopping centres,
natural rate; the overall average was below 1% by the end       stand at around 10-15%.
of 2012. The only centres still suffering from a low level of
demand and high vacancy are Mustika SC and Sikupilli SC.        Table 6
At the same time, given recent change in the ownership,
                                                                Rental fees in Pärnu
Mustika SC might be subject to change in overall concept
                                                                                                        Rent, €/sq
and design and, as a result, decreasing vacancy.                  Type of tenants                                        2013
                                                                                                        m/month
                                                                  In shopping centres in city                            →
                                                                                                        8 – 14
Table 5                                                           centre
                                                                  In shopping centres outside                            →
Vacancy rates in shopping centres in Tallinn                                                            4 –10
                                                                  the city centre
 Type of tenants                 Vacancy, %         2013          Old town and city centre at                            →
                                                                                                        3–8
 Prime retail schemes                ›1             →             the pedestrian flow
 Secondary shopping centres          5 – 15         →             Business districts in suburbs         2.5 – 7.5        →
Source: DTZ Research                                            Source: DTZ Research

                                                                Tartu
Pärnu                                                           With the majority of the modern shopping centres in
The most successful commercial areas in Pärnu are:              Tartu being located outside city centre, in terms of retail
                                                                landscape, the city as such can be subdivided into the
       The city centre area;
                                                                following areas:
       Area around Jannseni Street and Tallinna Road;
                                                                     Retail area on Ringtee Street. Rental fees fall within
       Ülejõe area;                                                  the wide range of 5-19 €/sq m/month, whereas
       Area at Papiniidu crossing.                                   vacancy for modern schemes does not exceed 5%.
During the last couple of years, several new commercial              Vacancy in older buildings is considerably higher,
buildings were completed in Pärnu, such as buildings on 5            approximately 15%; average rental fees for such
and 7 Aida Street and Port Artur 2 expansion. Most of the            buildings fall within the range of 4-6.5 €/sq m/month.
retail and service premises find their occupiers in due              Retail area in Annelinn district. Average rental fees in
time, whereas office premises struggle with vacancy for              shopping centres range between 5 -19 €/sq m/month,
rather prolonged periods of time.                                    whereas street retail premises come at 3- 6 €/sq
During the last few years, Papiniidu commercial area was             m/month. Average vacancy rate for shopping centres
rapidly expanding; in total, there were nine buildings               is approximately 5-10%; in secondary locations, it goes
completed, with 27,000 sq m of commercial leasable                   up to 20%.
space.                                                               City centre retail area, further subdivided into:
Future pipeline is also quite extensive, with two new                o       Tartu Department Store, Kaubahall and Zeppelin,
shopping centres undergoing the planning phase. Hence                        Tasku centre. In general, rental fees vary from 13

www.dtz.com                                                                                                      Property Times   6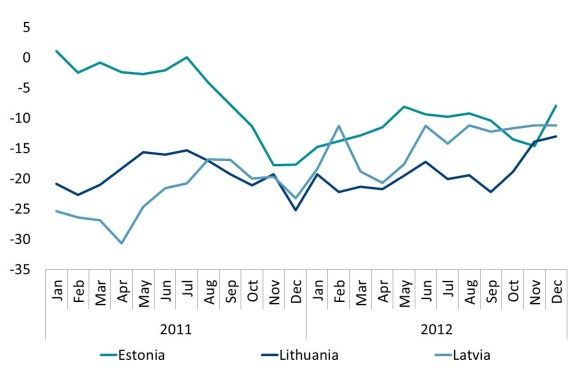
Baltic Retail H2 2012

          to 32 €/sq m/month, however for smaller retail                                            Rent, €/sq
                                                                 Type of tenants                                       2013
          schemes, such as former Tartu Department Store,                                           m/month
          GMP-centre, Kapitali House, the rental fees are        In shopping centres in city                           →
          lower.                                                                                    15 – 32
                                                                 centre
    o     Old Town mainly offers service, entertainment,         In shopping centres outside                           →
                                                                                                    5 –20
          accommodation and catering options for visitors        the city centre
          and locals alike. Although within the last few         Separate premises outside                             →
                                                                                                    3 – 6.5
          years, the number of retailers decreased, there        the city centre
          are still approximately 50 stores operating in the     Old twn and city centre at the                        →
          Old Town; the average rent is between 5-14 €/sq                                           5.5 – 15
                                                                 pedestrian flow
          m/month.                                               Business districts in suburbs      4 – 20             →
2012 was marked by the expansion of grocery retailers.         Source: DTZ Research

Hence three new hypermarkets were completed:
                                                               Forecasts for 2013
Annelinna Prisma (the leasable area of the hypermarket is
almost 11,000 sq m, which makes it the largest store in             Healthy economic recovery has made a positive
Tartu), Maxima XX hypermarket in Raadi area (2,600 sq               impact on both consumers’ confidence and their
m), and Vahi Selver in Vahi Village close to Tartu city             buying behaviour; during the year 2013, the retail
(1,900 sq m). Additional new retail stock comes from                trade turnover is expected to continue its growth.
residential developments (for example, on Fortuuna and              Rental rates have firmly stabilized within the last few
Raatuse Streets), since in quite many cases the ground              years; in 2013 therefore there is a slight pressure for
floors in apartment buildings are intended for retail               them to increase, and yet the change will be only
purposes.                                                           modest.
                                                                    With strengthening economy and improving retail
While major downward adjustment in rental fees hit the
                                                                    indices, yields are subject to a slight decrease during
city in the second half of 2009 (total decrease averaged at
                                                                    the upcoming year.
around 20%), to be followed by quiet year 2010, year
2011 has already brought moderate upwards adjustment,               Vacancy in popular shopping centres will remain
especially for the premises located in shopping centres. In         within its natural limits; secondary locations
2012 nonetheless rents remained stable.                             meanwhile will struggle to increase their occupancy
By the end of 2012, the major Tartu shopping schemes                rates.
has already reached their natural vacancy levels; in some           Moderate to high new development activity will be
of the cases, demand for retail premises already exceeds            evident in the sub-segments of hypermarkets and
available supply. Therefore, Tasku SC was the first one to          shopping centres.
expand, whereas Tartu Kaubamaja has announced
potential expansion (detailed planning already in process)
that is expected to bring additional 3,600 sq m of retail
space. At the same time, given quite large existing
provision per capita, no new developments are in the
pipeline.

Table 7

Rental fees in shopping centres in Tartu

www.dtz.com                                                                                                    Property Times   7
Baltic Retail H2 2012

                                                                 Figure 4
Retail Market in Latvia
Retail Trade Turnover                                            Retail Trade Turnover Indices at Constant Prices
                                                                 (2005=100)
The data on retail trade turnover from Q3-Q4 2012 conveys
a rather mixed message with respect to private
consumption dynamics in Latvia. The growth dynamics on a
month-on-month and on a year-on-year basis present us
with quite diverse development scenarios; therefore, any
definite conclusions on significant trend reversals in the
medium term are too early to judge.
On one hand, for the first time since the year 2010, retail
trade turnover (in seasonally adjusted constant prices) on a
month-on-month basis dropped for two consecutive
months, namely September-October 2012 (-0.1% and -1.4%
correspondingly), yet picked up again with a 1.4% increase
in November 2012. On the other hand, the annual growth
rate (at constant prices) although remaining quite sizeable
                                                                 Source: National Statistics, DTZ Research
(8.7% in November 2012) plunged from 9.5% annual change
in Q3 2012. The increase itself mainly affects non-food
group of products (in November, 11.9% increase as                Development pipeline in 2012 therefore consisted solely
compared to 2.1% increase in the food group of products).        from new additions coming from the opening of new
At the same time, in November 2012, European                     grocery superstores and reconstruction of already existing
Commission confidence indicators reassured once again            ones all around the country. Within a year, Swedish Rimi
that business and consumer confidence sentiments in Latvia       added three new stores to its chain, of which only one is
are currently among the highest ones in European Union           located in Riga; Lithuanian Maxima expanded by opening
member states. Economic Sentiment Indicator shows                four new supermarkets, of which one is in Riga. Finnish
prolonged sustainable trends and within the recent months,       Prisma meanwhile substantially strengthened its position in
stabilized on the level of the beginning of 2008; Retail Trade   Riga market by adding two new hypermarkets (11,500 sq m
Confidence Indicator remains on a positive side ever since       and 8,000 sq m of GLA) to the three already existing
April 2010. Consumer Sentiment Indicator with regard to          (opened in 2006, 2009, and 2011).
the general economic situation in Latvia within the              Within the segment of the shopping centres, given the
upcoming 12 months can be characterized as optimistic for        above average shopping centre floor space provision (0.7 sq
the first time since August 2007.                                m of GLA per capita in Riga) that is coupled with above
All in all, given the marginal downward changes in personal      European average retail sales growth forecasts, Latvia in
income tax (decreased by 1% as of 1 January 2013), as well       general and Riga in particular can be characterized as a
as positive forecasts with regard to average wages in Latvia,    stable market, where existing schemes will benefit greatly
retail trade turnover year-on-year changes in 2013 are           from the robust retail turnover growth, whereas potential
expected to continue to grow at a rate comparable to that        future developments have to be measured carefully against
of the end of 2012; at the same time, sudden large               higher than average risks coming from evident signs of
fluctuations on a month-on-month basis can hardly be             market saturation in terms of shopping space provision.
expected.                                                        The forecast of new deliveries for the next two years
                                                                 therefore comes primarily from potential expansion and
New supply                                                       upgrade plans of already established retail schemes; one
                                                                 large-scale new development, Akropolis (more than 60,000
Although 2012 was still a struggle for Latvian economy with
                                                                 sq m of GLA) by Lithuanian holding VP Market nonetheless
strict austerity measures, low wage growth and high
                                                                 is also in the pipeline ever since 2006, with the construction
unemployment rate, grocery retail chains were confident
                                                                 works being gradually initiated, and expected completion
enough to take further advantage of lower development
                                                                 announced for 2014.
costs and, similarly as in year 2011, continued to optimize
on their market shares.

www.dtz.com                                                                                                    Property Times   8
Baltic Retail H2 2012

                                                                Table 8

Demand, Vacancy and Rental Rates                                Rental fees in shopping centres in Riga
In 2012, although improving, but still uncertain market           Type of tenants        Rent, €/sq m/month        2013
conditions created subdued and highly selective occupier          Anchor tenants         4 – 12                    →
demand, with retailers being still cautious and thus
                                                                  >100 sq m              15 – 25                   →
favouring prime space in prime schemes. This even further
reinforced the polarization between prime and secondary
Baltic Retail H2 2012
Map 2 Figure 5
Major shopping centres in in Riga Shopping Centres Stock in Riga, 000s GLA sq m
Source: DTZ Research
Source: DTZ Research
Table 10
Main shopping centres in Riga
No. on Shopping Year of construction/
Type of shopping centre GBA, sq m GLA, sq m
the map centres in Riga reconstruction (expansion)
1. THE OLD TOWN and CITY CENTER, includes all of the following:
Galerija Centrs Medium, traditional 23,800 23,000 1936/2006
Galerija RIGA Medium, traditional 41,000 29,700 2010
Stockmann Department store 14,000 14,000 2003
ORIGO Medium, traditional 35,300 27,000 2004
Barona Centrs Small, traditional, choice 7,000 5,200 2001
2. ALFA Big, traditional 62,000 56,500 2000/2005/2009
3. SPICE Big, traditional 77,000 40,000 2000/2006
4. SPICE HOME Non-leisure oriented, special 30,000 22,000 2007
5. OLYMPIA Medium, traditional 25,200 18,500 2003
6. DOMINA
Big, traditional 110,000 42,000 2003
Shopping
7. ELKOR PLAZA Department store 9,000 9,000 2006
8. SKY&MORE Medium, traditional 16,900 12,000 2007
9. RIGA PLAZA Big, traditional 67,000 47,000 2009
10. DAMME Small, traditional, choice 16,000 13,000 2011
11. Imanta Retail
Small, traditional, choice 9,500 8,000 2011
Park
12. KRASTA STREET AREA, includes all of the following (and a number of other small retail and leisure units):
MOLS Medium, traditional 32,800 29,000 1999
MC2 Non-leisure oriented, special 13,500 9,500 2002
13. Galerija AZUR Medium, traditional 25,000 20,500 2006
14. DOLE Small, convenience, traditional 17,000 9,600 1982/2002
15. ZOOM Small, convenience, traditional 7,500 7,000 2006
www.dtz.com Property Times 10Baltic Retail H2 2012
Forecasts for 2013 the future, securing a durable revenue stream for the
owner.
Higher than Euro-zone average sustained growth in
retail sales;
Optimistic consumer sentiments can be jeopardized by
the prospects of introducing Euro;
Potential of new deliveries coming only from the
extensions and upgrades of already existing retail
schemes;
Upward pressure on rents in prime shopping schemes;
Further strengthening of prime assets in terms of tenant
mix, with downward pressure on potential disposal
yields;
Downward pressure on vacancies in the secondary
shopping centres, with only marginal upward potential
in rental rates and stabilization in potential disposal
yields;
In 2013, there are windows of opportunity for the
tenants already present on the market and ready to
expand through facing certain risks intrinsic to the
secondary retail schemes, as well as for the international
tenants that are still not present on the market, yet are
ready to test their brands in the dynamic context of a
small country with high retail sales growth;
2013 is also a window of opportunity for the acquisition
of retail assets that while still in an uncertain position
today, have positive prospects of being strengthened in
www.dtz.com Property Times 11Baltic Retail H2 2012
Retail Market in Lithuania The property sold is situated on the major Vilnius high
street, Gedimino Avenue. The area stretches for nearly 2 km
Retail trade turnover
alongside Vilnius Old Town, hosts one more major retail
The first signs of recovery on Lithuanian retail market were scheme, Flagman, and a substantial amount of street retail
already evident in 2010, followed by 4.1% increase in the spots.
retail turnover of food, beverage, and tobacco products and
The rest of the major retail schemes are scattered
7.5% increase in the retail turnover of non-food products
throughout Vilnius sleeping districts, such as Šeškinė,
(including fuel) in 2011. As far as 2012 is concerned, the
Šiaurės miestelis, Viršuliškės, Pilaitė, Žvėrynas,
provisional data from Statistics Lithuania indicates 4.9%
Perkūnkiemis.
overall increase on a year-on-year basis as of October 2012.
New supply
Figure 6 By the end of 2012, the total modern retail space stock in
Vilnius was 500,000 sq m. The year was mostly populated
Retail trade turnover in Lithuania, millions €
with the introduction of new hypermarkets; hence
2 000 Lithuanian chains Iki, Norfa, and Maxima opened new
1 500 stores. At the same time, the construction of the franchise
1 000
agreement based Ikea store commenced in 2012 (to open in
autumn 2013), next to Vilnius International Airport. The
500
development is being undertaken by Iceland’s Felit.
0 The pipeline for the upcoming two years meanwhile
1Q 2002
4Q 2002
3Q 2003
2Q 2004
1Q 2005
4Q 2005
3Q 2006
2Q 2007
1Q 2008
4Q 2008
3Q 2009
2Q 2010
1Q 2011
4Q 2011
3Q 2012
promises two more major retail schemes for Vilnius. The
first is Olinda shopping centre (GLA 22,000 sq m) to be
Retail sale of food, beverages or tobacco developed by Finnish Vicus and anchored by Finnish Prisma.
Retail trade of non - food products, including automotive… The second is Domus Pro Retail Park (GLA 13,600 sq m), to
Source: DTZ Research be developed by Danish TK Development and targeted
towards offering interior and household goods.
Retail stock in Lithuania
By the end of 2012, the total stock of modern retail stock in
Lithuania was 892,000 sq m (accounting for the buildings
that exceed 5,000 sq m), distributed among five largest Map 3
cities, Vilnius, Kaunas, Klaipeda, Siauliai, and Panevezys. Major retail centres in Vilnius
In terms of shopping floor space provision, Klaipeda (more
than 1.0 sq m of GLA per capita) and Siauliai (close to 1.0 sq
m of GLA per capita) fall into stagnating category, where the
performance of existing schemes or future growth
prospects are hampered by moderate economic
development. Vilnius and Kaunas (approximately 0.7 sq m
per capita in each) are stable markets, where existing
provision can benefit from strong retail growth, yet new
developments are at risk due to market saturation in terms
of total shopping space. Panevezys (ca 0.5 sq m per capita)
is still emerging, whilst offering potential as it is under-
supplied in terms of shopping space provision, and yet
display rather weak retail sales growth forecast figures.
Vilnius
Swedbank subsidiary Ektornet Lithuania SPV 1 sold the
shopping center Gediminas 9 (GLA ca 16,000 sq m) in
November 2012. The shopping center was bought by East
Capital investment fund East Capital Baltic Property II.
Source: Google Map, DTZ Research
www.dtz.com Property Times 12Baltic Retail H2 2012
Figure 7 Figure 8
Shopping centre stock in Vilnius, 000s GLA sq m Dynamics of vacancy rate (%) in Vilnius Shopping Centres
Source: DTZ Research
Source: DTZ Research
Table 11
Main shopping centres in Vilnius
No. on Main shopping centres in Year of
Address GBA, sq m GLA, sq m
the map Vilnius construction
1. Akropolis 24 Ozo Street 109,000 91,200 2002
2. VCUP 16 Konstitucijos Avenue 19,800 19,800 2003
3. Mada 40 Virsuliskiu Street 18,500 16,000 2003
4. Domus Galerija 32 P. Lukšio Street 14,000 14,000 2003
5. Flagman 16 Gedimino Street 7,000 5,600 2004
6. Europa 7A Konstitucijos Avenue 22,600 17,400 2004
7. Mandarinas 91 Ateities Street 9,300 7,900 2005
8. BIG 369 Ukmergės Street 18,800 15,600 2006
9. Gedimino 9 9 Gedimino Avenue 16,600 10,200 2007
10. Panorama 9 Saltoniskiu Street 65,000 49,500 2008
11. Ozas 18 Ozo Street 93,000 62,000 2009
12. Pupa 1 Priegliaus Street 6,300 5,300 2009
Source: DTZ Research
Rental levels and vacancy Type of tenants Rent, €/sq m/month 2013
In major Vilnius retail schemes, rental rates remained quite Anchor tenants 3-8 →
stable throughout 2012, and no significant changes are >100 sq m 9 - 23 →
forecasted for H1 2013. →Baltic Retail H2 2012
Kaunas Panevezys and Siauliai
The total stock of modern retail premises in Kaunas In terms of shopping space provision, Siauliai, similarly as
amounts to 215,000 sq m, one fourth of which is single the Klaipeda, is among the most saturated cities in Lithuania.
most popular retail scheme, Akropolis (60,000 sq m). The total stock here amounts to 106,000 sq m GLA, which is
The city saw one new delivery at the end of 2012, Prisma close to 1.0 sq m per capita; this geographical sub-market
hypermarket with 7,000 sq m GLA. therefore is in temporary stagnation with no new
developments in the pipeline for the upcoming 2-3 years.
Rental rates remained stable throughout 2012.
Table 14 Panevezys, on the other hand, is usually referred to as the
Rental fees in Kaunas Shopping centres least saturated Lithuanian city in terms of modern retail
space provision (0.5 sq m per capita). The absolute majority
Rent, €/sq of the modern retail space here comes from the single
Type of tenants 2013
m/month shopping scheme, Babilonas (42,100 sq m GLA for retail and
Anchor tenants 4-7 → 18,000 sq m GLA for car showrooms and repair services),
>100 sq m 8-12 → which was developed through several stages in 2005-2008.
100 sq m 5-12 → 4-12 →
100 sq m 8-12 →
→ In Vilnius, 65,000 sq m GLA of new supply is about toBaltic Retail H2 2012
Other DTZ Research Reports
Other research reports can be downloaded from www.dtz.com/research. These include:
Occupier Perspective Insight
Updates on occupational markets from an occupier Thematic, ad hoc, topical and thought leading reports on
perspective, with commentary, analysis, charts and data. areas and issues of specific interest and relevance to real
estate markets.
Global Occupancy Costs Offices 2012
Obligations of Occupation Americas 2012 India Special Economic Zones-December 2012
Obligations of Occupation Asia Pacific 2012 Singapore Executive Condominiums -December 2012
Obligations of Occupation EMEA 2012 European Retail Guide- Shopping Centres-December 2012
UK Secondary market pricing-December 2012
Singapore office demand-November 2012
Property Times Ecommerce & Logistics -November 2012
Regular updates on occupational markets from a landlord Net Debt Funding Gap-November 2012
perspective, with commentary, charts, data and forecasts. German Open Ended Funds-October 2012
Coverage includes Asia Pacific, Bangkok, Beijing, Berlin, London office to residential conversions-October 2012
Brisbane, Bristol, Brussels, Budapest, Central London, Great Wall of Money-October 2012
Chengdu, Chongqing, Dalian, Edinburgh, Europe, Frankfurt,
Glasgow, Guangzhou, Hangzhou, Ho Chi Minh City, Hong
Kong, India, Jakarta, Japan, Kuala Lumpur, Luxembourg,
Madrid, Manchester, Melbourne, Milan, Nanjing, DTZ Research Data Services
Newcastle, Paris, Poland, Prague, Qingdao, Rome, Seoul,
Shanghai, Shenyang, Shenzhen, Singapore, Stockholm, For more detailed data and information, the
Sydney, Taipei, Tianjin, Ukraine, Warsaw, Wuhan, Xian. following are available for subscription. Please
contact graham.bruty@dtz.com for more
information.
Investment Market Update
Regular updates on investment market activity, with Property Market Indicators
commentary, significant deals, charts, data and forecasts. Time series of commercial and industrial
Coverage includes Asia Pacific, Australia, Belgium, Czech market data in Asia Pacific and Europe.
Republic, Europe, France, Germany, Italy, Japan, Mainland
China, South East Asia, Spain, Sweden, UK. Real Estate Forecasts, including the DTZ
Fair Value IndexTM
Five-year rolling forecasts of commercial
Money into Property and industrial markets in Asia Pacific,
For more than 35 years, this has been DTZ's flagship Europe and the USA.
research report, analysing invested stock and capital flows
into real estate markets across the world. It measures the Investment Transaction Database
development and structure of the global investment Aggregated overview of investment activity
market. Available for Global, Asia Pacific, Europe and UK. in Asia Pacific and Europe.
Money into Property
Foresight DTZ’s flagship research product for over 35
Quarterly commentary, analysis and insight into our in- years providing capital markets data
house data forecasts, including the DTZ Fair Value Index™. covering capital flows, size, structure,
Available for Global, Asia Pacific, Europe and UK. In ownership, developments and trends, and
addition we publish an annual outlook report. findings of annual investor and lender
intention surveys.
www.dtz.com Property Times 15DTZ Research Contacts DTZ Baltic Tambet Tiits Managing Director Phone: +372 626 4250 Email: tambet.tiits@dtz.ee Estonia Aivar Roosik Peeter Prisk Director, Development Director, Property Management Phone: +372 626 4250 Phone: +372 442 0700 Email: aivar.roosik@dtz.ee Email: peeter.prisk@dtz.ee Latvia Andris Juršāns Jurga Kupstytė Director, Latvian office Project Manager Phone: +371 6 724 4811 Phone: +371 6 724 4811 Email: andris.jursans@dtz.lv Email: jurga.kupstyte@dtz.lv Lithuania Valdemaras Ivaško Jurgita Banytė Director, Valuation & Consulting Property Expert Phone: +370 5 210 0252 Phone: +370 5 210 0254 Email: valdemaras.ivasko@dtz.lt Email: jurgita.banyte@dtz.lt DISCLAIMER This report should not be relied upon as a basis for entering into transactions without seeking specific, qualified, professional advice. Whilst facts have been rigorously checked, DTZ can take no responsibility for any damage or loss suffered as a result of any inadvertent inaccuracy within this report. Information contained herein should not, in whole or part, be published, reproduced or referred to without prior approval. Any such reproduction should be credited to DTZ. © DTZ February 2013 www.dtz.com Property Times 16
You can also read