PREVAIL & PROSPER: A view on what's next for the EMEA investment market - WHAT'S NEXT | EMEA - Colliers International
←
→
Page content transcription
If your browser does not render page correctly, please read the page content below

WHAT’S NEXT | EMEA

PREVAIL & PROSPER:
A view on what’s next for
the EMEA investment market
                             PREVAIL & PROSPER: A view on what’s next for the EMEA investment market   1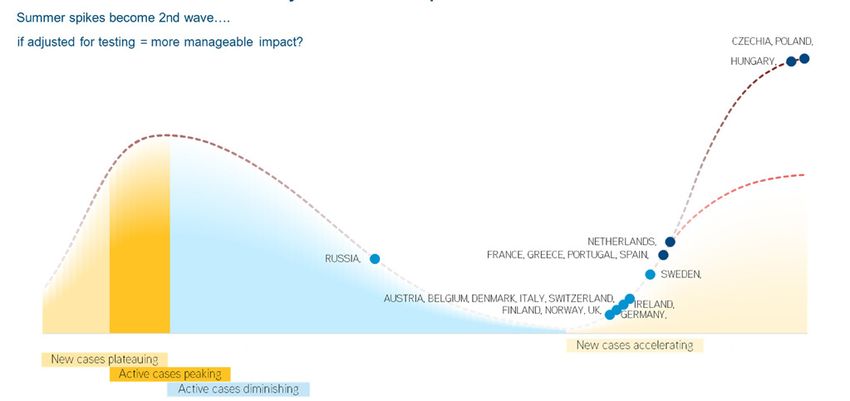
3    Executive Summary
          8    Macro-economic trends
          12   Capital Markets Trends
CONTENT   13   Concluding points
Executive Summary

Establishing where markets are at as a result of this         Some 95% of investors surveyed by Colliers in                              The major positive is that momentum is back in the
global pandemic has been like wading through a sea of         September expect the European investment market to                         market as of September, as big-ticket assets and
fog over the last six months. The initial and very deep       stabilise in the next 12 months, and we are forecasting                    portfolios for sale add much greater liquidity to the
‘lock-down induced’ economic and market shocks that           a mid-case rebound in activity in Q4 of €70 billion,                       European market. Pricing has already adjusted over
have been endured globally have been followed by a            up to a best-case scenario of €100 billion. It certainly                   the course of Q2 and Q3, and many markets point to a
swift return to growth over the summer months, almost         looks like we have passed the nadir in Q3, which would                     further adjustment in the next 12 months as the rest of
universally.                                                  mean that activity in 2020 is only down by around 15%                      the fog starts to lift. For our own outline view on how
                                                              y/y. A considerable feat, all things considered.                           specific markets and sectors match up to investment
As of today, despite the threat of a rise in the R-rate                                                                                  opportunities by strategy, we have outlined these in the
driving localised market lockdowns, the fog is lifting                                                                                   table below.
and the impact has been largely as expected. That
doesn’t mean we’re back to where we were, by                    WHAT’S NEXT: PREVAIL & PROSPER
any means, as COVID-19 has accelerated numerous
structural trends that were developing before the               Where      to buy:
                                                                Table 1: Where to buy: Location/Sector
                                                                                       location/sector strategiesStrategies
pandemic: agile working, omni-channel retailing,
digitisation and a much greater adoption of ‘Proptech’
to manage, view and transact on assets and portfolios.                     Sector                       Stable                 Short-term flux             Big Opportunity                 Upcoming
It will take years for some ‘traditional’ elements of our                                               (Core)                   (Core-plus)                 (Value-Add)                 (Opportunistic)
economies to get back to par, if ever, with business
                                                                           Offices                    London, Paris,                     Dublin                   London               Decentralised locations
sectors, real estate asset types, city and national                                                     German7                         Warsaw                     Paris
markets recovering at different speeds and in very                                                     Amsterdam                        Helsinki                   Milan
                                                                                                       Copenhagen                       Prague                    Madrid
different ways.                                                                                      Stockholm, Oslo                   UK Regions                  *Flex

While the recovery is on track, the current investment                     Retail Grocery                           All major cities                                     Decentralised locations

market feels somewhat like ‘wading through treacle’
as one investment agent put it. Treacle is a bit like                      Retail Parks                                            All major cities

marmite, it is very bitter-sweet. Which sums up the                        Retail Shopping             Dusseldorf              Non central shopping centres (car-based, grocery          All major city center
                                                                                                         Berlin                                   anchor)                                       assets
state of the situation pretty well – there will be a bitter                Centres                      Vienna
pill to swallow for some, especially current owners of                                                  Warsaw
assets at the distressed end of the spectrum; much                         Residential (BTR,            Germany, Nordics, Netherlands, UK,                        Madrid                       Warsaw
sweeter for those set to prosper with assets that have                     PRS, Affordable)
                                                                                                              Dublin, Milan, Paris                                                             Prague
recently appreciated in value on the sale-side, and of
course those with dry powder looking to strike deals at                                                        Too early to tell, but southern Europe will be a big area of distress/ opportunity
more favourable pricing levels.                                            Hotel/Hospitality

                                                                                               PREVAIL & PROSPER: A view on what’s next for the EMEA investment market                                           3
Summary points: by sector WHAT’S NEXT: PREVAIL & PROSPER
Where to buy: I&L sub regions
Where to buy: I&L sub regions
INDUSTRIAL AND LOGISTICS 4
Industrial and logistics is the top pick with almost all investors shifting their
1. WHAT’S
1. Benelux,
Benelux, NEXT: PREVAIL
Rhine-Ruhr
Rhine-Ruhr & & PROSPER
Ile-de-France
& Ile-de-France
allocation to this sector. Many large deals now coming to market are I&L 2. Germany
2. Germany&&Core CEE
Core CEE
portfolios, with an estimated €3bn worth launched in Q3. 3. Where
3. United
UnitedKingdom to (England)
Kingdom buy: I&L sub regions
(England)
4
The defensive nature of I&L, and the key demand drivers for big box 1. Benelux, Rhine-Ruhr & Ile-de-France
logistics, cold storage and data centres is buoying demand while availability 2. Grade A&I&L
Germany Space
Core CEE (Mn sqm) - by Sub-region 3
120 3. United Kingdom (England)
continues to diminish. These strong fundamentals are supporting rental 100 2
growth in core locations, and even some yield compression. This is driving 80 Grade A I&L Space (Mn sqm) - by Sub-region 3 1
120
core prices up by around 20% since the end of Q2; value-add I&L assets 60
100 2
and portfolios have increased in price by around 10%. 40 80 1
20 60
0
40
5
The structural demand drivers and tight supply/demand fundamentals 20
Benelux+Rhine+Nth Germany+CEE UK 7
0 France 5
of this sector point to further rental growth in core locations over the Benelux+Rhine+Nth
France
Germany+CEE UK 7
next 12-24 months.
4. Nordics (Denmark, Sweden, Norway, Finland) 6
4. Nordics (Denmark, Sweden, Norway, Finland) 6
5. Alpine (Italy,(Italy,
5. Alpine Switzerland,
Switzerland,Austria, SWFrance)
Austria, SW France)
OFFICES 6. Iberia
6. (Spain, Portugal)
Iberia (Spain, Portugal)
The reverse has been seen for offices, with core-plus and value-add pricing 7. 7. South-east
South-east Europe Europe
moving out by up to 20%, depending on the market, but core pricing remains
tight with limited movement in pricing. Headline rents are being buoyed by WHAT’S NEXT: PREVAIL & PROSPER
incentives, but limited vacancy in most markets is limiting price movements.
Rents
Office vs vs
rents Economic Outputlong-term
economic density: or Workforce
pricing Density?
correlation
Mid-term, the use of offices is adjusting as occupiers shift to an agile working
model, yet this model differs by company. Most occupiers are reconsidering CATCH M E N T E con omic Ou tpu t vs Offic e Ren ts & Ou tl ook , [Q2 2020]
Down Stable Up
how their workplace portfolio will function in the future, but a core office HQ is LONDON
here to stay for the majority alongside the adoption of third spaces and home
working.
O f f i c e C B D Re n t s ( E u r / s q m / m o n t h )
80
PARIS
STOCKHOLM
The definition of core, however, is likely to tighten to become a high-tech,
DUBLIN
MILAN
FRANKFURT
ESG-relevant spec asset, in a very accessible location with a flexible 40 BERLIN MUNICH
OSLO
AMSTERDAM
BRISTOL MANCHESTER
MADRID ROME
footprint and fit-out. These assets will maintain their position as key in HAMBURG
BIRMINGHAM
LEEDS
BRUSSELS DUSSELDORF
BARCELONA VIENNA
driving company revenue as the client-facing centre of the brand, as a place to LISBON WARSAW STUTTGART
ATHENS COPENHAGEN
COLOGNE
collaborate and drive company culture. 20 PRAGUE
BUDAPEST
ROTTERDAM
BUCHAREST
BRATISLAVA
The pricing of these assets should be in-line with current values, relative to
the economic density generated by the city they are in. In this regard, London 10
2 4 8 16 32
and Paris are at the apex, as one would expect, but most city office rents look O ffi c e S ec t o r G V A D ens i t y ( E u r M n / s q k m )
in-line with economic density. In fact, some markets such as Manchester and
Dusseldorf look under-priced.
PREVAIL & PROSPER: A view on what’s next for the EMEA investment market 4WHAT’S NEXT: PREVAIL & PROSPER
HOSPITALITY Hotels:
Hotel a disappointing
occupancy summer
trends: a disappointing summer
The European summer is not what many in the hospitality business had hoped
for, with occupancy down by 50% on this time last year. Investment volumes
Hotel Occupancy vs Tourism Source
have rescinded over the course of 2020, and with further uncertainty over European Hotel Occupancy
100%
travel restrictions for another twelve months until a vaccine is established, 90
produced and distributed, it will be longer before the hospitality sector truly
90%
80 Finland Germany
hits the bottom. Demand will bounce back eventually, but this is a real 70
80%
Turkey Poland UK
test as to who can prevail in the interim with cash levels and government 70% Russia
60 Romania
Spain
Domestic Tourism %
Czech Republic
support thinning out. 50
60% France
Netherlands
Hungary Ireland
50%
40 Italy
For the private equity houses looking at opportunities, Q4 2020 and Q1 2021 40%
Slovakia
could start to see many interesting opportunities emerge across Europe, not
30 Bulgaria Portugal
Switzerland
30%
Austria
just in the more distressed summer destinations. In the meantime, budget 20
20%
Belgium
3-star hotel operations continue to be robust, especially those supporting car- 10
10%
Greece Croatia
dependent business travel. Some hotels offer the potential for (short-term) 0
June July August 0%
re-use as flexible office space, although is most likely a short-term solution. 2019 Avg 2020 Avg
15.0 20.0 25.0 30.0 35.0 40.0 45.0 50.0
There may be potential for some operations to provide quasi-fractional options Summer Occupancy Rate Average (June, July, August)
in cities where agile working impacts commuting patterns.
Source: Colliers / Worldometers/ GlobalData/ STR
RETAIL WHAT’S NEXT: PREVAIL & PROSPER
Retail has already been impacted by the rise of e-commerce, but physical
Retail
Retail Shopping
shopping Centre
centre values values &
& volumes: volumes:
feeling feeling
the impact the impact
retail space remains an important part of the omni-channel marketing and
purchase journey.
COVID-19 Impact: Shopping Centre volumes, values and 12 month outlook [Q2 2020 vs Q4 2019]
The latest city mobility challenges and retailer insolvency do point to an Down Stable/Down Stable Stable/Up Up
acceleration of lower priced retail space and growth in the use of turnover rents. 80
Outside of the grocery and convenience element, this is likely to push the retail
Investment volumes, % change, past 12M vs 5yr
60 Paris Lisbon
sector through a big, final pricing reset with the need for retailers and owners 40
Berlin
Budapest
to find common ground on acceptable terms that encapsulate turnover rents 20
Rotterdam
Munich
Dusseldorf
and the role of physical space in the omni-channel transaction process. While 0 Moscow Athens
Stuttgart
the initial point of purchase has become increasingly online, with fulfilment
average
-20 Amsterdam
Bristol Hamburg
Stockholm Milan
handled in the logistics chain, the physical store performs a critical role in -40 Vienna
Frankfurt
London
building a brand and ‘showrooming’ in addition to supporting click-and-collect
Brussels
Copenhagen
Birmingham Manchester
-60 Oslo
Rome
and traditional retialing functions. Prague Barcelona Dublin
-80 Madrid
Bratislava Leeds Warsaw
-100 Istanbul Sofia Bucharest
Shopping centres have taken a big hit as footfall has dried up, and the value -120
outlook for the next 12 months looks very weak across Europe, especially in the
-40 -35 -30 -25 -20 -15 -10 -5 0 5
Capital value change, %
bigger cities as this adjustment is ongoing. Meanwhile, appetite continues to grow
for retail parks, especially those that can support a reconfiguration that allows
logistics facilities to be built on site, supporting click and collect in the retail park
units and broader distribution to the local catchment. PREVAIL & PROSPER: A view on what’s next for the EMEA investment market 5RESIDENTIAL
Residential has proven to be most resilient to date, with investment demand The bifurcation of the US housing market from the “have’s” capable of buying
increasing as funds increase their assets under management (AUM) weightings homes in remote locations, pushing up localised house prices outside of the
to this sector. The London and UK markets seem to have been buoyed by the re- city…. To the “have not’s”, struggling to make ends meet and satisfy their rental
distribution of Hong Kong funds in Q2 and Q3 of this year. commitments is an extreme example of how housing markets have been
impacted by the pandemic.
While residential has been robust to date, there are concerns as to how
defensive it will be, given the risk of higher unemployment on those most While there has been a notable shift in demand for ‘Zoom-Towns’ outside of
likely to be renters. Hence investors are increasingly building their AUM in central areas, we don’t anticipate such a clear trend emerging across Europe.
European residential with a focus on affordable Build-to-Rent (BTR) and It seems a little premature to think a broader distribution of working populations
Private Rented Sector (PRS). is going to be sustainable, where it requires a regular long commute. It’s not
very agile to be living too far away from the focus of core office - collaborating
with colleagues and working with clients.
WHAT’S NEXT: PREVAIL & PROSPER
Residential investment momentum
Residential investment momentum: major city destinations
In vestmen t M omen tu m: 2 0 2 0 Yea r-to-da te
[Recent performance vs 5yr average & Covid-19 impact
Bubble size represent activity volumes]
100% Q2 Q3
90%
Ac t iv it y v o lu m es : 12 M r o llin g v s 5 y r a v er a g e
Munich
80% Birmingham London
Stockholm
70% Paris Manchester London
Dublin
60%
Stockholm Paris
50%
40% Munich
Frankfurt
30%
20% Amsterdam
Amsterdam Helsinki
10%
Frankfurt Leipzig
0% Madrid Vienna
Berlin Helsinki
-10% Vienna Hamburg
Madrid
-20% Berlin
Hamburg Malmo (Helsinborg)
-30% Copenhagen
-40% Copenhagen
-50%
0 50 100 150 200 250
12 M r o llin g a c t iv it y v o lu m e in dex: 2 0 19 =10 0
PREVAIL & PROSPER: A view on what’s next for the EMEA investment market 6Summary Points WHAT’S NEXT: PREVAIL & PROSPER
GDP Impact:
City GDPbig cities have
impact: thefelt
biga hit
muchis greater economic impact than mid-sized
to retail/leisure/hospitality/ancillary services
Big Cities Mid-sized Cities
While prevailing will be a real challenge for many existing owners, especially 100% 100%
those in the retail and hospitality sectors, investors remain primed ready for 95% 95%
opportunities in all real estate sectors on a selective basis. 90%
90%
85% 85%
Having fewer people in the centre of cities every day is clearly having a
80%
high impact on city economies, especially in the low-tech ancillary retail
80%
75%
and hospitality sectors which will need to downsize. Any resulting pricing 75%
adjustment will of course have a broader impact on values as competing 70% 70%
use pressure diminishes. Despite this, people travelling to the centre for core 65% 65%
client-facing and collaborative activities will likely see thisWHAT’S
as an opportunity 60%
NEXT: PREVAIL & PROSPER
60%
to enjoy the retail, events and hospitality on offer once markets make it 55% 55%
The redistribution of city economies …and value
through COVID, but a positive re-configuration of cities is inevitable. 50% 50%
Jan Feb Mar Apr May Jun Jul Aug Sep Oct Nov Dec Jan Feb Mar Apr May Jun Jul Aug Sep Oct Nov Dec
Berlin Paris London Milan Madrid Stockholm Amsterdam Frankfurt Brussels Prague Warsaw
Cities will need to adapt as they always have, but economic output and value
is likely to redistribute, rather than be lost as markets recover. This will
create an opportunity for the redevelopment of assets in cities to support
changes in the way we work and live. With an increased focus on supporting
communities and neighbourhoods, this in itself will create more energy-
efficient and sustainable cities to match the increasing shift to ESG-based The redistribution of city economies …and value
strategies that the majority of the investment community has adopted.
PREVAIL & PROSPER: A view on what’s next for the EMEA investment market 7Macro-economic trends and outlook
BUSINESS SECTOR IMPACT: THE K-SHAPED RECOVERY
A long-term view of FDI into Europe shows the market will most likely be at its lowest to bounce back within the next year. Professional services operate at a lag, although the
ebb since pre-2003 when FDI was first recorded, and almost half of the level of FDI seen lawyers and accountants are undoubtably busy, but low-tech services and manufacturing
in 2019. It simply highlights the extent to which occupier decisions have been put on hold don’t get back until 2022/23….and some of these jobs and sectors may never come back
until the future for many businesses becomes clearer, and there is an identifiable K-shaped to the same levels. In particular, major structural changes in the energy and automotive
recovery happening depending upon the business sector. sectors had already begun pre-COVID, while city centre low-tech services and the aviation
industry are on for a significant reset as the world shifts to a new normal.
There is clearly a diversified impact with retail services/hospitality not expected to recover
until 2023 - thus a drag on national and city economies dependant on it. Whereas health,
public administration and what could be broadly aggregated as the ‘high-tech’ or value-add
services
WHAT’SofNEXT:
IT, comms, finance
PREVAIL & insurance, and scientific/life sciences sectors are due
& PROSPER
The K-shape: When sectors get back to parity
The K-shape: when sectors get back to parity
ADMIN PROFESSIONAL
& SUPPORT ACCOMMODATION
HUMAN HEALTH/ PUBLIC ADMIN SERVICES AVIATION
SOCIAL WORK AND DEFENCE IT & COMMS AND FOOD SERVICES
REAL TRANSPORTATION
ESTATE AND STORAGE RESOURCES/
ENERGY
ARTS, ENTERTAINMENT,
RECREATION
LIFE FINANCE
SCIENCES & INSURANCE
AGRICULTURE
LOW-TECH CITY
ELECTRICITY SERVICES
& UTILITIES
MANUFACTURING
AUTOMOTIVE
Source: Colliers/OxfordEconomics/
EDUCATION
National statistics offices
Source: Colliers/OxfordEconomics/National statistics offices
PREVAIL & PROSPER: A view on what’s next for the EMEA investment market 8THE NATIONAL ECONOMIC IMPACT: THE ‘SWOOSH’
National economies across Europe function in many different ways, subject to the business Whilst Q2 2020 ploughed the depths, most markets started to recover in June this year
sectors that drive them and the ways in which national governments have decided to manage the generating an almost immediate large, but ‘partial-V’ or ‘Swoosh’ rebound. But a rebound to
pandemic via a balance of lockdowns and stimulus. This has generated a clear immediate impact positive annual economic and employment growth will not happen until 2021.
on national economies and employment, and we can see those countries more dependent on retail
and hospitality have suffered a deeper initial impact - Italy, Spain, Portugal, France and the UK have Even then, the multi-speed recovery is even more telling when it comes to getting back to
been some of the worst hit during Q2 2020. The DACHS and Nordic regions, the Netherlands and parity, as outlined in Table 2 below. If we look at the period 2021 to end 2023 we can see the
Poland have been the least impacted. overall economic recovery reversion takes from Q4 2020, in resource rich Norway, out to Q2
2022 in Spain and Italy, with other major economies somewhere in between. The impact on
unemployment and household spending is even more marked, with consumption/household
income levels not expected to get back to parity until the end of 2022 for Italy and Spain. The
NOKIA Client Call: Office Market Trends, Sept 2020 more positive DACHS, Nordic & core-CEE markets will see spending revert back to par at almost
Table the same time as the economic recovery.
But 2:the
National
lengtheconomies
of the- timing
GDP of reversion
‘swoosh to economic parity
tail’ varies significantly: economy vs consumption
Country Peak Q4 2020 Q1 2021 Q2 2021 Q3 2021 Q4 2021 Q1 2022 Q2 2022 Q3 2022 Q4 2022
Eco Con Eco Con Eco Con Eco Con Eco Con Eco Con Eco Con Eco Con Eco Con
Norway Q4 2019 X
Poland Q1 2020 x
Sweden Q1 2020 X
Austria Q4 2019 X
Czechia Q4 2019 X
Denmark Q4 2019
Hungary Q4 2019 X
Germany Q3 2019 X
UK Q4 2019 X
Netherlands Q4 2019 X
Finland Q3 2019 X
Ireland Q1 2020
Belgium Q4 2019 X
France Q3 2019 X
Italy Q4 2019 X Source: Colliers/OxfordEconomics
Spain Q3 2019 X *nominal figures
Source: Colliers/OxfordEconomics *nominal figures
PREVAIL & PROSPER: A view on what’s next for the EMEA investment market 9THE COVID CURVE: MANAGING THE SECOND WAVE
Given the likelihood that a vaccine for COVID-19 will not be available en-masse until H2 2021, relative to the first wave, testing levels are now significantly higher - on average four times
the pressure is on national governments to manage any localised spikes in active cases while higher than during the first wave of infections in March/April and May. By adjusting these
keeping the economy open and ticking over. Thankfully, most major European governments figures relatively to the first wave, we can see that most countries have got a hold on infection
have had time to plan and adjust in preparation for the winter season, and many either have rates. For the likes of the UK, Spain, Netherlands and France that have exercised new
embedded support mechanisms in place, and/or have extended their support into 2021. The lockdown measures, these appear to be pre-emptive strikes in stemming localised contagion.
UK recently announced its shift to a more focused employee support scheme, reflecting more The exceptions to this rule are Poland, Czechia and Hungary - but second-wave infection
targeted policies that have been brought in by many national European governments. Hopefully rates are currently much higher as there were very few initial cases in these countries, given
this will mitigate against a much starker rise in unemployment, so as not to delay any broader the immediate lockdown measures that were put in place in March.
economic/consumption recovery in due course.
This may lead to a marginal second ‘mini-dip’ in economic output in some countries over the
The return of people from summer holidays, schools going back and more people winter months, but with cases laready shown to be easing in some of these countries there
getting back to the office has created an inevitable rise in cases across Europe, but this does are positive signs that a second economic dip will be very short-lived. That said, maintaining
need to be put into context. Firstly, whilst there are many higher numbers of active cases the economic recovery which is at a fragile early stage, will be a critical balancing act. More
stimulus measures may be brought forward, especially when considering that the cost to
the public purse of rising unemployment claimants could be the same as an extended, more
COVID-19 active cases cycle: 28th Sept focused furlough program.
PREVAIL & PROSPER: A view on what’s next for the EMEA investment market 10NATIONAL ECONOMIC ‘MACRO’ OUTLOOK/POSITION
In summary, the country macro outlook is depicted in Table 3 below. The table uses a RAG format The big economies of France and the UK have a positive balance of economic
(Red, Amber, Green) to depict how each nation is positioned across a range of metrics: such as the conditions, but the next six months remain uncertain in terms of the management
forecast date of the economic recovery, how well the covid pandemic is being managed at present, of the pandemic. It will become financially challenging to buoy the economy for any
the capacity to spend on stimulus and long-term demographics to sustain a broader mid-long term extended period of time, especially in France.
recovery. Those with more green (ideally dark green) elements look much more stable than those
with splashes of orange and yellows. The Benelux and core CEE markets of Poland and Czechia look in a good
position, provided they can weather the large second COVID-19 wave.Belgium will
Germany and the Nordic region, especially Norway, Denmark and Sweden look the most be more challenged if it needs to continue funding the economy, given its reliance
appealing countries based on these metrics. Tech-centric Ireland also benefits from many on the EU recovery fund to maintain targeted stimulus measures until end 2020.
positive factors.
At the other end of the spectrum, Spain and Italy have some difficult years ahead,
but this distress will create multiple opportunities for investors engaging in the
NOKIA Client Call: Office Market Trends, Sept 2020
Table 3: National economic ‘macro’ outlook/position riskier end of the spectrum.
National Economic ‘Macro’ Outlook/Position
Country Country COVID COVID-19 Consumer Long-term Government Govnt Debt/GDP Credit Rating
2nd Wave Economic Recovery Path Demographics Stimulus/Debt 2020f% (20 = AAA)
% of 1st Peak Recovery Path Position
Germany Low Q2 2021 Q2 2021 Challenging Positive 69 20
extension
Denmark Low Q3 2021 Q1 2021 Good OK 54 20
Generally Stable,
Sweden Low Q1 2021 Q4 2021 Good Embedded 52 20
Positive Growth
Drivers
Netherlands Moderate Q3 2021 Q3 2021 Moderate Positive 70 20
extension
Ireland Low Q4 2021 Q3 2021 Good Limited 60 16
UK Low Q2 2021 Q4 2021 Good Uncertain 107 16
France Moderate Q4 2021 Q2 2022 Moderate Positive 155 18
extension
Belgium Moderate Q4 2021 Q1 2022 Moderate Partial Extension 138 18
Positive, but Hungary High Q3 2021 Q3 2021 Challenging Limited 77 12
challenges
Czechia High Q3 2021 Q3 2021 Challenging Limited 37 17
Portugal Moderate Q3 2021 Q4 2021 Challenging Limited 156 12
Poland High Q1 2021 Q1 2021 Problematic Limited 56 14
Italy Low Q1 2022 Q3 2022 Problematic Partial Extension 174 11
Challenging
Conditions Spain High Q2 2022 Q4 2022 Problematic Uncertain 139 14
PREVAIL & PROSPER: A view on what’s next for the EMEA investment market 11Capital Markets
The events of the past six months have already significantly changed the global interest rate The appreciation of the Euro has re-balanced the hedging benefits of investing in Euro
dynamic. The onset of COVID-19, coupled with geopolitical friction between US and China vs other denominated assets, notably GBP, which is leading to some interesting pricing
has seen the Euro rise sharply against most major global currencies. The EU27 agreement dynamics across European markets – from both an investment and debt perspective.
to create a 750 billion-euro ($855 billion) ‘COVID-19’ recovery fund, is a sign of improving While global cross-border sales are only marginally down by around 4% (from 22% to
internal cohesion, and combined with the EU’s collectively strong credit rating, this has led 18%), inter-regional cross-border activity has remained steady throughout the Q2 and
to a continued and prolonged euro appreciation and low interest rate regime. The hedging Q3 2020 COVID-dip in activity, with German, French and Swiss investors particularly
benefits of buying Euro denominated assets may have diminished since the end of 2019, but active.
the region is adopting more of a global safe-haven status, and major European currencies
continue to offer a positive gain (for a 5yr cross-currency swap) for
a basket of global currencies.
WHAT’S NEXT: PREVAIL & PROSPER WHAT’S NEXT: PREVAIL & PROSPER
Interest
Interest rates
rates & &appreciating
FX…the FX…theEuro appreciating Euro More continental
European activity, than
activity more continental thanglobal,
global….despite a
but cross-border activity remains active
EUR vs Global Currencies: FX 5yr Hedging Gain/Loss GBP vs Global Currencies: FX 5yr Hedging Gain/Loss
10.0% 8.0%
I n ve s t m e n t vo l u m e s E M E A
By quarter and domicile
8.0%
6.0% 400 40%
36%
350 35%
6.0% 28% 28% 28%
4.0% 300 26% 27% 26% 26% 30%
25%
24% 23%
250 21%
25%
20% 26%
EUR Bn
4.0%
200 23% 23% 20%
22% 22% 22%
2.0% 21%
150 17% 18% 15%
2.0% 16%
100 10%
- 50 9% 9% 5%
- CNY AUD USD CAD HKD KRW TWD JPY SGD MYR ZAR 7%
CNY AUD USD CAD HKD KRW TWD JPY SGD MYR ZAR 0 0%
2010
2012
2013
2014
2015
2016
2017
2018
2019
2011
2008
2009
2020
-2.0%
-2.0%
Q1 Q2 Q3 Q4 % Continental % Global
-4.0% -4.0%
Sep-19 Aug-20 Sep-19 Aug-20
PREVAIL & PROSPER: A view on what’s next for the EMEA investment market 12Concluding Points
Overall, YTD activity has been very robust with H1 2020 volumes across EMEA down by This would leave the market down by around 15% y/y which is a good
only 10% y/y, which compares far more favourably to the 28% declines seen in AsiaPac result considering the upheaval brought about by the pandemic.
and the Americas (although AsiaPac recorded a significant quarterly rise in volumes in
Q2).
As we enter the final quarter of 2020, it looks more and more likely that Q3 will be
the nadir for the EMEA investment market, with bigger deals making a comeback post
holidays in September. Q3 volumes could reach EUR 50 billion, matching those of Q2,
and with more larger deals coming to market, Q4 could reach up to EUR 100 billion.
WHAT’S NEXT: PREVAIL & PROSPER
EMEA: GDP, sentiment and investment outlook
EMEA Investment volumes vs GDP/PMI: history and outlook
Investment Activity Qrtr+ Best-case Mid-case Worst-case
Index GDP Growth
(2007 =100) % Y/Y
180 20.0
Q1 70 70 70
Q2 50 50 50
160 15.0
Q3 *50 *40 *30
140 10.0 Q4 *100 *70 *40
58 2020 *270 (-14%) *22 (-26%) *190 (-40%)
120 57 5.0
53 54 53 54
51 52 51
49
100 46 0.0
48
80 -5.0
“95% of buyers think
31
the market will stabilise
60 -10.0
40 -15.0
20 -20.0
in the next 12 months”
07Q4
08Q2
08Q4
09Q2
09Q4
10Q2
10Q4
11Q2
11Q4
12Q2
12Q4
13Q2
13Q4
14Q2
14Q4
15Q2
15Q4
16Q2
16Q4
17Q2
17Q4
18Q2
18Q4
19Q2
19Q4
20Q2
20Q4
21Q2
21Q4
22Q2
22Q4
GDP GR% Y/Y Volumes (Rolling Annual) PMI Composite
PREVAIL & PROSPER: A view on what’s next for the EMEA investment market 13Contact Details:
Damian Harrington
Head of Research, EMEA
damian.harrington@colliers.com
+44 7867 360489
Richard Divall
Head of Cross Border
Capital Markets I EMEA
richard.divall@colliers.com
+44 20 7487 1605
PREVAIL & PROSPER: A view on what’s next for the EMEA investment market 14You can also read