K2 HEDGE FUND STRATEGY OUTLOOK - Q1 2020 - Franklin Templeton ...
←
→
Page content transcription
If your browser does not render page correctly, please read the page content below

K2
HEDGE FUND
STRATEGY
OUTLOOK
        Q1 2020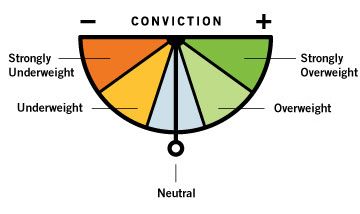
Q1 2020 Outlook: Summary

In our view, pricing dislocations in                                    Strategy Highlights
                                                                        Long/Short          We believe Europe will benefit from an inflow of foreign capital
Europe, performance dispersion                                          Equity–             as investors start to feel more comfortable with the risks
across the credit spectrum,                                             Europe              inherent to the region. In our opinion, the upside of European
                                                                                            managers’ long books remains elevated as persistently
and shifts in the political landscape                                                       overlooked companies gain more traction.
provide abundant opportunities for
                                                                        Long/Short          Recent dispersion in high yield bonds could provide managers
select strategies.                                                      Credit              with a better environment in which to pick specific credits on
                                                                                            both the long and short sides.

                                                                        Macro               Market focus has started to shift to the prospect of fiscal
                                                                        Discretionary       expansion, particularly in Europe, which may create
                                                                                            directional and relative value trading opportunities for
                                                                                            discretionary managers.

                       Strategy                         Outlook

                       Long/Short Equity                We believe opportunities for long/short equity managers remain abundant on both sides
                                                        of their books as investors focus on corporate fundamentals in anticipation of the
                                                        uncertainty embedded in an election year.

                       Relative Value                   We value the diversification benefits offered by these less directional investment styles
                                                        when compared to some more traditional market-sensitive hedged strategies.

                       Event Driven                     Opportunity set remains muted for many types of corporate event activity, but we are
                                                        optimistic about the potential rise in merger and acquisition (M&A) volumes should global
                                                        trade uncertainty abate in the new year.

                       Credit                           A slow growth environment can provide opportunities to generate alpha on both the long
                                                        and short sides. Structured credit may benefit from attractive carry and supportive
                                                        fundamentals.

                       Global Macro                     Discretionary managers may benefit from themes arising out of the prospect of fiscal
                                                        expansion as the efficacy of extreme monetary policy is reassessed. Thematic
                                                        opportunities may also emerge from developments in the US presidential election given
                                                        uncertainties tied to the candidates.

                       Commodities                      Progress on a US-China trade deal could provide more clarity and potential trade
                                                        opportunities. Niche commodities continue to generate attractive performance and, in our
                                                        view, offer a better opportunity set.

                       Insurance-Linked                 Global event activity in Q4 2019, combined with an apparent lack of deployable capital in
                       Securities                       the higher-risk market segment, has led to more attractive pricing through a variety of risk
                                                        tiers and instruments within insurance-linked securities.

This presentation is provided to you for informational purposes and is not intended for redistribution. It shall not constitute an offer to sell or a solicitation of
an offer to buy an interest in any investment product or fund. This presentation discusses strategies that are available through a variety of structures such as
separate accounts, mutual funds and private funds. Not all structures are available for all strategies shown. Interests or shares of an investment fund are
offered only through the fund’s offering documents, such as a Prospectus or Confidential Private Offering Memorandum.

For Institutional/Professional Investor and Consultant Use Only—Not for Use with Retail Investors.
2      Hedge Fund Strategy Outlook—Q1 2020
Macro Themes We Are Discussing
Sector and Geographical Rotations Likely to Continue Has the Rally in Global Government Bonds Gone Too Far?
in 2020 According to Bloomberg as of December 30, 2019, the December
We expect a rotation from those sectors that formally had strong 2020 Fed Funds futures market is forecasting US Fed Funds
earnings growth into sectors that have lagged in the past few to be near 1.39%. This is not much lower than the current level of
years. We believe this sector rotation should benefit equity hedge 1.55%. It seems to us that the Fed rate cuts might mostly be
fund alpha as managers look to buy past laggards while using priced into bond valuations. We wonder if a selloff in global
past leaders as market hedge positions. Likewise, cyclical sectors bond markets may present a good hedging scenario for
and value factor-sensitive securities may outperform defensive managers in the relative value, event-driven, and macro/CTA
and growth-oriented sectors. Much of the negative economic and strategy categories.
earnings growth news may be priced into European and emerging
market equities while much of the positive news is potentially What Impact Will Upcoming Political and Trade Events Have
priced into US equities and the US dollar. A rotation into non-US on Market Volatility and Hedged Strategies?
equity markets may become evident in 2020, and many macro With the November 2020 US election cycle fast approaching, we
commodity trading advisors (CTAs) and equity long/short expect market volatility to increase from the current low levels.
managers may benefit from this shift. Campaign policy headlines involving the health care and energy
sectors could influence investor perceptions leading up to the
Are Investors’ Global Inflation Expectations Too Low? election. Hedged strategies may benefit by going long the sectors
We wonder if consensus inflation expectations are too low given thought to benefit from a policy tailwind while hedging out equity
global growth seems to be stabilizing. If wage or price inflation market volatility through short positions in sectors potentially hurt
surprises to the upside, the yield curve may steepen in 2020, by policy statements. Additionally, the ongoing Brexit and trade
and some bond markets may come under pressure as interest discussions should contribute to investor uncertainty and cross-
rates rise. Credit long/short hedge fund managers should sector and cross-asset class volatility.
benefit from this scenario in our opinion, as the performance
variance between bonds in different countries or sectors should
offer alpha opportunities.
The above reflects the opinions of the K2 Investment & Research Management (IRM) group as of January 9, 2020, and may not reflect the views of other
groups within K2 or Franklin Templeton. The information provided is not a complete analysis of every material fact regarding any country, market, industry,
security or fund. Because market and economic conditions are subject to change, comments, opinions and analyses are rendered as of the date of this
material and may change without notice. A portfolio manager’s assessment of a particular security, investment or strategy is not intended as individual
investment advice or a recommendation or solicitation to buy, sell or hold any security or to adopt any investment strategy; it is intended only to provide
insight into the manager’s portfolio selection process.
For Institutional/Professional Investor and Consultant Use Only—Not for Use with Retail Investors.
Hedge Fund Strategy Outlook—Q1 2020 3Q1 2020 Outlook: Strategy Highlights
Long/Short Equity–Europe High Yield Performance by Quality
We expect renewed interest in European equities as investors January 1, 2019–December 16, 2019
rotate to undervalued European markets, potentially improving the 20%
relative valuation dislocations between Europe and the US.
Broad macro uncertainties about the US-China trade war and 15%
Brexit have temporarily diminished, and central banks continue to
accommodate investors’ appetite for risk-on assets. Many 10%
European companies even offer relatively high dividend yields,
5%
which we believe are sustainable based on payout ratios and
corporate debt levels.
0%
1/1/19 4/1/19 7/1/19 10/1/19 12/16/19
Various Regional and Asset Class Yields
ICE BofAML BB US High Yield Index
As of December 18, 2019 ICE BofAML Single-B US High Yield Index
4.0% ICE BofAML CCC & Lower US High Yield Index
3.54%
3.5% Source: ICE BofAML, Bloomberg. Data from third party sources may have been used in
the preparation of this material and Franklin Templeton has not independently
3.0% verified, validated or audited such data. Franklin Templeton and its third party sources
2.5% accept no liability whatsoever for any loss arising from use of this information and
reliance upon the comments, opinions and analyses in the material is at the sole
1.92% 1.82%
2.0% discretion of the user. Important data provider notices and terms available at
www.franklintempletondatasources.com. Indexes are unmanaged and one cannot
1.5% invest directly in them. They do not reflect any fees, expenses, or sales charges.
Past performance is not an indicator or a guarantee of future performance.
1.0% 0.78%
0.5%
Macro Discretionary
0.0% Markets are starting to recognize the effective limits of monetary
-0.01%
-0.5% -0.25% policy, which has been a key supporter of asset prices in the
MSCI US 10-Year MSCI USA UK 10-Year Japanese German 10- years following the Global Financial Crisis. With developed-market
Europe Government Dividend Government 10-Year Year
Dividend Bond Yield Bond Yield Government Government
policy rates at or near the perceived lower bound, attention has
Bond Yield Bond Yield started to shift to the prospect of expansionary fiscal policy,
particularly in Europe. Directional and relative value macro
Source: Bloomberg, MSCI. MSCI makes no warranties and shall have no liability with opportunities may arise from key policy changes as well as
respect to any MSCI data reproduced herein. No further redistribution or use is permitted. associated shifts in the political landscape with considerable focus
This report is not prepared or endorsed by MSCI. Important data provider notices and
terms available at www.franklintempletondatasources.com. Indexes are unmanaged and on the US presidential election.
one cannot invest directly in them. They do not reflect any fees, expenses, or sales
charges. Past performance is not an indicator or a guarantee of future performance. Monetary Policy Rates in Major Developed Markets
June 29, 2007–December 18, 2019
6
Long/Short Credit
5
High yield bonds have experienced higher levels of dispersion in
2019, particularly across the quality spectrum. Higher-quality 4
bonds have rallied given higher sensitivity to rates, and lower- 3
quality bonds have lagged due to both macro and idiosyncratic
2
credit concerns. This dispersion could provide managers with a
1
better environment in which to pick specific credits. That is
particularly salient on the short side, as weaker credits, 0
particularly those in challenged sectors such as health care and 06/29/07 08/29/10 10/29/13 12/29/16 12/18/19
retail, have experienced sharp declines in response to negative US Fed Funds Target Rate
European Central Bank Main Refinancing Rate
fundamental developments. We expect this dispersion to continue Japan Overnight Target Lending Rate
into 2020 as investors become more discerning into the later
stages of the credit cycle. Source: Bloomberg. Important data provider notices and terms available at
www.franklintempletondatasources.com. Past performance is not an indicator or a
guarantee of future performance.
For Institutional/Professional Investor and Consultant Use Only—Not for Use with Retail Investors.
4 Hedge Fund Strategy Outlook—Q1 2020Q1 2020 Outlook by Strategy
Long/Short While valuations are at all-time highs, the US economy remains robust with little threat of
Equity inflation and the postponement of rising interest rates by the Federal Reserve.
Various macro uncertainties seemed to have diminished, but the upcoming presidential
election could help create opportunities on both sides of managers’ books whether
through candidates’ rhetoric specific to certain sectors or incremental developments
in the trade war. Most long/short equity managers feel comfortable redeploying
market risk back into their books and continue to focus on the fundamentals of
their companies.
Relative Value Volatility in equities has remained stubbornly low, offering an attractive entry point to be
long optionality in shares in case of a future market shock. Convertible bond markets
are showing meaningful growth in new issuance and improved dispersion, and continued
flows in sovereign debt have been helpful to fixed income managers, resulting in an
overall favorable environment for non-equity relative value strategies as well.
Event Driven Merger deal volumes have rebounded from a slowdown earlier in the year but remain far
from record levels as the market is still struggling with broad geopolitical uncertainties in
the US and abroad. At the same time, merger arbitrage spreads are somewhat lower,
consistent with low levels of global interest rates and realized volatility. This is similarly
true for other types of corporate activity, limiting the opportunity set for special situations
investing. We believe both types of corporate activity will resume in force once trade war
and global growth uncertainty is resolved, but remain neutral in our outlook.
Credit A slow-growth environment can provide opportunities for long/short credit managers to
generate alpha. On the long side, managers are increasingly taking an active role
to drive desired financial restructuring. On the short side, weaker credits, especially
those in challenged sectors, are trading off meaningfully in response to negative
fundamental developments. Structured credit managers can potentially benefit from
attractive carry and supportive fundamentals. In direct lending, we prefer niche
strategies. Distressed is challenged from both an opportunity set perspective as well as
the path to exiting positions.
Global Macro We think discretionary managers remain well placed to benefit from active monetary and
fiscal policy agendas, mixed growth outlooks, and the potential for higher volatility
ahead of the US presidential election. Macro conditions, including subdued inflation and
accommodative policy, may remain supportive of emerging markets strategies, but
idiosyncratic and market liquidity risks remain. Our outlook for systematic strategies is
cautious around extended positioning in certain asset classes even though we like the
diversification benefit.
For Institutional/Professional Investor and Consultant Use Only—Not for Use with Retail Investors.
Hedge Fund Strategy Outlook—Q1 2020 5Q1 2020 Outlook by Strategy
Commodities Trade uncertainty continues to create a challenging environment for sensitive
commodities. Meanwhile, a weaker US dollar, lower capex, and a backwardated oil
market are potential tailwinds for investors looking to add commodities exposure.
IMO 2020, in addition to other regulatory changes, could serve as a catalyst for certain
relative value and directional strategies across a variety of commodities markets.
Certain metals traditionally have a higher sensitivity to Q1 seasonal conditions,
presenting potential trade ideas.
Insurance- The catastrophe bond market is seeing attractive pricing as the new issuance pipeline
Linked picked up significantly with record Q4 2019 issuance. The broader catastrophe
Securities bond selloff in November and December was primarily driven by new issuance coming to
market at more attractive valuations. For the higher-risk segments of the market like
retrocessional, a lack of deployable capital has led to a double-digit increase in pricing
for January 1, 2020. Based on historical standards, a material increase in retrocessional
pricing should eventually impact the broader reinsurance market, but this is likely to take
a longer lead time.
For Institutional/Professional Investor and Consultant Use Only—Not for Use with Retail Investors.
6 Hedge Fund Strategy Outlook—Q1 2020Outlook Trend for Strategies and Sub-Strategies Sub-Strategies Ranked
by Z-Score
Strategies Q4 2019 Q1 2020 Changes
Long/Short Equity — Rankings (Top Down) Z-Score
Long/Short Equity Catastrophe Bonds 1.26
Equity Market Neutral Retrocessional 1.26
Activist — Europe 1.03
Europe Structured Credit 0.87
Asia — Private Transactions 0.79
Technology Insurance Loss Warranties 0.79
Healthcare Discretionary 0.72
Relative Value — Long/Short Credit 0.72
Convertible Arbitrage — Activist 0.64
Volatility Arbitrage Emerging Markets 0.48
Fixed Income — Volatile Arbitrage 0.40
Event Driven — Oil & Products 0.40
Merger Arbitrage Metals 0.35
Special Situations Convertible Arbitrage 0.17
Credit — Fixed Income 0.17
Direct Lending — Healthcare 0.11
Distressed — Systematic 0.09
Long/Short Credit — Agriculture -0.10
Structured Credit Merger Arbitrage -0.22
Global Macro Direct Lending -0.30
Discretionary —
Asia -0.45
Systematic US Natural Gas -0.45
Emerging Markets —
Long/Short Equity -0.53
Commodities —
Equity Market Neutral -0.69
Oil & Products —
Technology -0.77
Agriculture —
Special Situations -1.31
Metals —
Distressed -2.49
US Natural Gas —
Life Securitization -2.95
Insurance-Linked Securities
Catastrophe Bonds —
Private Transactions — > +1 Strongly Overweight
+0.5 to +1 Overweight
Life Securitization —
-0.5 to +0.5 Neutral
Retrocessional —
-1 to -0.5 Underweight
Industry Loss Warranties — < -1 Strongly Underweight
The K2 Investment Research & Management (IRM) Outlook Scores are the opinions of the K2 IRM group as of the date indicated and may not reflect the views of other groups within K2 or Franklin
Templeton. Scores are determined relative to other hedge fund strategies and do not represent an opinion regarding absolute expected future performance or risk of any strategy or substrategy.
Scores are determined by the K2 IRM group based on a variety of factors deemed relevant to the analyst(s) covering the strategy or substrategy and may change from time to time in K2’s sole
discretion. In certain sections of this presentation, outlook scores are rounded to the nearest whole number. These scores are only one of several factors that K2 uses in making investment
recommendations, which may vary based on a client’s specific investment objectives, risk tolerance and other considerations. Therefore, underweightings and overweightings as shown are meant to
indicate K2's view of relative attractiveness of hedge strategies and are not meant to indicate that a particular strategy or sub-strategy should be overweighted or underweighted, respectively, in any
given portfolio. This information contains a general discussion of certain strategies pursued by underlying hedge strategies, which may be allocated across several K2 strategies. This discussion is
not meant to represent a discussion of the overall performance of any K2 strategy. Specific performance information relating to K2 strategies is available from K2.
For Institutional/Professional Investor and Consultant Use Only—Not for Use with Retail Investors.
Hedge Fund Strategy Outlook—Q1 2020 7Glossary
Alpha Correlation
A mathematical value indicating an investment's excess return relative to The degree of interaction between an investment’s return and that
a benchmark. Measures a manager's value added relative to a passive of the comparison Index. The correlation coefficient, expressed as a
strategy, independent of the market movement. value between +1 and –1, indicates the strength and direction of the
linear relationship between the investment’s returns and the returns of
Backwardation
the index.
A market condition in which the price of a commodity's forward or futures
contract is trading below the spot price. Retrocessional
A type of insurance contract that allows a re-insurer to transfer risks it has
re-insured to another re-insurer.
For Institutional/Professional Investor and Consultant Use Only—Not for Use with Retail Investors.
8 Hedge Fund Strategy Outlook—Q1 2020Notes
For Institutional/Professional Investor and Consultant Use Only—Not for Use with Retail Investors.
Hedge Fund Strategy Outlook—Q1 2020 9Notes For Institutional/Professional Investor and Consultant Use Only—Not for Use with Retail Investors. 10 Hedge Fund Strategy Outlook—Q1 2020
DISCLOSURE
The K2 Investment Research & Management (IRM) Outlook Scores are the opinions of the K2 IRM group as of the date indicated and
may not reflect the views of other groups within K2 or Franklin Templeton. Scores are determined relative to other hedge fund
strategies and do not represent an opinion regarding absolute expected future performance or risk of any strategy or substrategy.
Scores are determined by the K2 IRM group based on a variety of factors deemed relevant to the analyst(s) covering the strategy or
substrategy and may change from time to time in K2's sole discretion.
These scores are only one of several factors that K2 uses in making investment recommendations, which may vary based on a client's
specific investment objectives, risk tolerance and other considerations. Therefore, a positive or negative score may not indicate that a
particular strategy or substrategy should be overweighted or underweighted, respectively, in any given portfolio.
This information contains a general discussion of certain strategies pursued by underlying hedge strategies, which may be allocated
across several K2 strategies. This document is intended to be of general interest only and does not constitute legal or tax advice nor is
it an offer for shares or invitation to apply for shares of any of the funds employing K2 strategies. Nothing in this document should be
construed as investment advice. Specific performance information relating to K2 strategies is available from K2. This presentation
should not be reproduced without the written consent of K2.
Past performance is not an indicator or guarantee of future results.
Certain information contained in this document represents or is based upon forward-looking statements or information, including
descriptions of anticipated market changes and expectations of future activity. K2 believes that such statements and information are
based upon reasonable estimates and assumptions. However, forward-looking statements and information are inherently uncertain and
actual events or results may differ from those projected. Therefore, too much reliance should not be placed on such forward looking
statements and information.
Professional care and diligence have been exercised in the collection of information in this document. However, data from third party
sources may have been used in its preparation and Franklin Templeton/K2 has not independently verified, validated or audited
such data.
Any research and analysis contained in this document has been procured by Franklin Templeton/K2 Investments for its own purposes
and is provided to you only incidentally. Franklin Templeton/K2 shall not be liable to any user of this document or to any other person
or entity for the inaccuracy of information or any errors or omissions in its contents, regardless of the cause of such inaccuracy, error
or omission.

WHAT ARE THE RISKS?
All investments involve risks, including possible loss or principal. Investments in alternative investment strategies and hedge
funds (collectively, “Alternative Investments”) are complex and speculative investments, entail significant risk and should not be
considered a complete investment program. Financial Derivative instruments are often used in alternative investment strategies and
involve costs and can create economic leverage in the fund's portfolio which may result in significant volatility and cause the fund to
participate in losses (as well as gains) in an amount that significantly exceeds the fund's initial investment. Depending on the product
invested in, an investment in Alternative Investments may provide for only limited liquidity and is suitable only for persons who can
afford to lose the entire amount of their investment. There can be no assurance that the investment strategies employed by K2 or the
managers of the investment entities selected by K2 will be successful.
The identification of attractive investment opportunities is difficult and involves a significant degree of uncertainty. Returns generated
from Alternative Investments may not adequately compensate investors for the business and financial risks assumed. An investment in
Alternative Investments is subject to those market risks common to entities investing in all types of securities, including market volatility.
Also, certain trading techniques employed by Alternative Investments, such as leverage and hedging, may increase the adverse impact
to which an investment portfolio may be subject.
Depending on the structure of the product invested, Alternative Investments may not be required to provide investors with periodic
pricing or valuation and there may be a lack of transparency as to the underlying assets. Investing in Alternative Investments may also
involve tax consequences and a prospective investor should consult with a tax advisor before investing. In addition to direct asset-
based fees and expenses, certain Alternative Investments such as funds of hedge funds incur additional indirect fees, expenses and
asset-based compensation of investment funds in which these Alternative Investments invest.

For Institutional/Professional Investor and Consultant Use Only—Not for Use with Retail Investors.
                                                                                             Hedge Fund Strategy Outlook—Q1 2020            11
IMPORTANT LEGAL INFORMATION This material is intended to be of general interest only and should not be construed as individual investment advice or a recom- mendation or solicitation to buy, sell or hold any security or to adopt any investment strategy. It does not constitute legal or tax advice. The views expressed are those of the investment manager and the comments, opinions and analyses are rendered as at January 9, 2020 and may change without notice. The information provided in this material is not intended as a complete analysis of every material fact regarding any country, region or market. All investments involve risks, including possible loss of principal. Data from third party sources may have been used in the preparation of this material and Franklin Templeton Investments (“FTI”) has not independently verified, validated or audited such data. FTI accepts no liability whatsoever for any loss arising from use of this information and reliance upon the comments opinions and analyses in the material is at the sole discretion of the user. Products, services and information may not be available in all jurisdictions and are offered outside the U.S. by other FTI affiliates and/or their distributors as local laws and regulation permits. Please consult your own professional adviser or Franklin Templeton institutional contact for further information on availability of products and services in your jurisdiction. The information in this document is provided by K2 Advisors. K2 Advisors is a wholly owned subsidiary of K2 Advisors Holdings, LLC, which is a majority-owned subsidiary of Franklin Templeton Institutional, LLC, which, in turn, is a wholly owned subsidiary of Franklin Resources, Inc. (NYSE: BEN). K2 operates as an investment group of Franklin Templeton Alternative Strategies, a division of Franklin Resources, Inc., a global investment management organization operating as Franklin Templeton. Issued in the U.S. by Franklin Templeton, One Franklin Parkway, San Mateo, California 94403-1906, (800) DIAL BEN/342-5236, franklintempleton.com—Investments are not FDIC insured; may lose value; and are not bank guaranteed. Australia: Issued by Franklin Templeton Investments Australia Limited (ABN 87 006 972 247) (Australian Financial Services License Holder No. 225328), Level 19, 101 Collins Street, Melbourne, Victoria, 3000. Austria/Germany: FTIS Branch Frankfurt/Main, Mainzer Landstr. 16, 60325 Frankfurt/Main, Germany. Tel +49 (0) 69/27223-557, Fax +49 (0) 69/27223- 622,institutional@franklintempleton.de Canada: Issued by Franklin Templeton Investments Corp., 5000 Yonge Street, Suite 900 Toronto, ON, M2N 0A7, Fax:(416) 364-1163,(800) 387- 0830, www.franklintempleton.ca. Netherlands: Franklin Templeton International Services S.à r.l., Dutch Branch , World Trade Center Amsterdam, H-Toren, 5e verdieping, Zuidplein 36, 1077 XV Amsterdam, Netherlands. Tel +31 (0) 20 575 2890. United Arab Emirates: Issued by Franklin Templeton Investments (ME) Limited, authorized and regulated by the Dubai Financial Services Authority. Dubai office: Franklin Templeton Investments, The Gate, East Wing, Level 2, Dubai International Financial Centre, P.O. Box 506613, Dubai, U.A.E., Tel.: +9714-4284100 Fax:+9714-4284140. France: Issued by Franklin Templeton France S.A., 20 rue de la Paix, 75002 Paris France. Hong Kong: Issued by Franklin Templeton Investments (Asia) Limited, 17/F, Chater House, 8 Connaught Road Central, Hong Kong. Italy: Issued by Franklin Templeton International Services S.à.r.l. – Italian Branch, Corso Italia, 1 – Milan, 20122, Italy. Japan: Issued by Franklin Templeton Investments Japan Limited. Korea: Issued by Franklin Templeton Investment Trust Management Co., Ltd., 3rd fl., CCMM Building, 12 Youido-Dong, Youngdungpo-Gu, Seoul, Korea 150-968. Luxembourg/Benelux: Issued by Franklin Templeton International Services S.à r.l. – Supervised by the Commission de Surveillance du Secteur Financier - 8A, rue Albert Borschette, L-1246 Luxembourg - Tel:+352-46 66 67-1 - Fax:+352-46 66 76. Malaysia: Issued by Franklin Templeton Asset Management (Malaysia) Sdn. Bhd. & Franklin Templeton GSC Asset Management Sdn. Bhd. Poland: Issued by Templeton Asset Management (Poland) TFI S.A.; Rondo ONZ 1; 00-124 Warsaw. Romania: Issued by Bucharest branch of Franklin Templeton Investment Management Limited (“FTIML”) registered with the Romania Financial Supervisory Authority under no. PJM01SFIM/400005/14.09.2009, and authorized and regulated in the UK by the Financial Conduct Authority. Singapore: Issued by Templeton Asset Management Ltd. Registration No. (UEN) 199205211E. 7 Temasek Boulevard, #38-03 Suntec Tower One, 038987, Singapore. Spain: FTIS Branch Madrid, Professional of the Financial Sector under the Supervision of CNMV, José Ortega y Gasset 29, Madrid, Spain. Tel +34 91 426 3600, Fax +34 91 577 1857. South Africa: Issued by Franklin Templeton Investments SA (PTY) Ltd which is an authorised Financial Services Provider. Tel:+27 (21) 831 7400 ,Fax:+27 (21) 831 7422. Switzerland: Issued by Franklin Templeton Switzerland Ltd, Stockerstrasse 38, CH-8002 Zurich. UK: Issued by Franklin Templeton Investment Management Limited (FTIML), registered office: Cannon Place, 78 Cannon Street, London EC4N 6HLTel +44 (0)20 7073 8500. Authorized and regulated in the United Kingdom by the Financial Conduct Authority. Nordic regions: Issued by Franklin Templeton International Services S.à r.l. , Contact details: Franklin Templeton International Services S.à r.l., Swedish Branch, filial, Blasieholmsgatan 5, SE-111 48, Stockholm, Sweden. Tel +46 (0)8 545 012 30, nordicinfo@franklintempleton.com, authorised in the Luxembourg by the Commission de Surveillance du Secteur Financier to conduct certain financial activities in Denmark, in Sweden, in Norway, in Iceland and in Finland. Franklin Templeton International Services S.à r.l., Swedish Branch, filial conducts activities under supervision of Finansinspektionen in Sweden. Offshore Americas: In the U.S., this publication is made available only to financial intermediaries by Templeton/Franklin Investment Services, 100 Fountain Parkway, St. Petersburg, Florida 33716. Tel:(800) 239- 3894 (USA Toll-Free),(877) 389-0076 (Canada Toll-Free), and Fax: (727) 299-8736.Investments are not FDIC insured; may lose value; and are not bank guaranteed. Distribution outside the U.S. may be made by Templeton Global Advisors Limited or other sub-distributors, intermediaries, dealers or professional investors that have been engaged by Templeton Global Advisors Limited to distribute shares of Franklin Templeton funds in certain jurisdictions. This is not an offer to sell or a solicitation of an offer to purchase securities in any jurisdiction where it would be illegal to do so. Please visit www.franklinresources.com to be directed to your local Franklin Templeton website. For Institutional/Professional Investor and Consultant Use Only—Not for Use with Retail Investors. © 2020 Franklin Templeton Investments. All rights reserved. K2 HFS15 01/20
You can also read