Cisco Australian Digital Readiness Index 2020 - Building societal resilience through digital investment
←
→
Page content transcription
If your browser does not render page correctly, please read the page content below

Cisco Australian Digital Readiness Index 2020
Building societal resilience through digital investment

                                                          1
2

Cisco Australian Digital Readiness Index 2020
Building societal resilience through digital investment

Contents
    04 Foreword
    05 Introduction
    06 Global Digital Readiness
    08 Australia’s Comparative Readiness
    10 State and Territory Analysis
    11 Australian Capital Territory
    12 New South Wales
    13 Northern Territory
    14 Queensland
    15 South Australia
    16 Tasmania
    17 Victoria
    18 Western Australia
    19 Summary of Results
    21 Conclusion

                                                          3
Foreword                                                      But this infrastructure will only deliver to its full potential
                                                              if we invest in building the skills of our people to use,
Digital readiness is the key to societal resilience.          create and defend digital services. In addition to the
                                                              need for ongoing support of the higher education
When we released the Cisco Australian Digital Readiness       sector, Cisco has also joined forces with TAFE Directors
Index 2018 two years ago, it provided a rare insight into     Australia and our partner Optus to call on the Australian
the components that contribute to building a digitally        Government to assess the growth in technology-
capable nation, and created a platform to encourage           intensive jobs requiring sub-degree level qualifications,
business and government leaders to double down on             to help the TAFE sector more rapidly prepare for and
these investments to maximise future returns.                 respond to anticipated demand. We have also called
                                                              for funding of the development and delivery of micro-
Little did we know that two years later the value of          credential digital programs to help in the reskilling and
those investments would be repaid many times over by          upskilling of workers displaced by recent developments.
providing Australia with a robust and comprehensive
digital capability that has played a critical role in our     Australian industry has a desperate and growing
response to the COVID-19 crisis.                              need for people equipped for a dynamic, digitised
                                                              world, including having general digital skills that helps
While the pandemic has exacted a high economic and            businesses to move up the value chain as industries
social toll, its consequences would have been much            further automate. Development of ‘blue tech’ or digital
greater had Australia not already made significant            trade skills will be vital to meeting those needs.
investments in digital readiness.
                                                              Critically, we must also be sure to not lose sight of
For example, the deployment of high-speed national            the need for the outcomes of these investments to be
network infrastructure has meant many organisations           shared equitably across Australia.
can keep their staff both safe and productive by enabling
them to work from home. That same infrastructure              The Cisco Australian Digital Readiness Index 2018
provides a vital connection for thousands of students         highlighted significant gaps in digital capability that
who participate in remote learning and has become the         exist within Australia. While this year’s report shows
backbone for remote health consultations, keeping many        states and territories have changed their rankings in
of the frontline responders safe.                             specific categories, the overall story still tells of a digital
                                                              divide. Equitable access to digital services and training
Likewise, investments in digital skills mean businesses       represents the 21st century equivalent of the age-old
and government agencies have been able to accelerate          Australian concept of giving everyone a ‘fair go’, and
their rollout of digital services, including bricks and       the COVID-19 crisis has highlighted the importance
mortar restaurants and retailers who have switched to         of continued investment to ensure those communities
e-commerce-based solutions to continue trading.               that are least served digitally today do not experience
The Cisco Digital Readiness Index 2020 measures seven         additional hardship from future events.
components of digital readiness, and Australia scored         At Cisco, we are committed to building Australia’s digital
highly across all seven.                                      readiness, as a partner to government and industry, and
The investments will play a vital role in helping Australia   through direct investments in the Australian community.
navigate through the post-COVID-19 world, but further         Our efforts include investments in skills development
work is needed if we are to achieve the productivity          through our Cisco Networking Academy program,
uplifts necessary to bring Australia out of recession and     in conjunction with tertiary and vocational training
ensure we remain competitive. Cisco’s global research         institutes, and through the funding of research positions
has always shown a high correlation between digital           at Australian universities and research centres under our
readiness and economic prosperity, and other nations          Country Impact Plan.
are stepping up their investments accordingly.                Digital readiness is the key to economic prosperity, but
Continued investment in digital infrastructure is             it is also critical to building societal resilience. Only by
essential, and we applaud the Australian Government’s         continuing to invest in our digital capabilities can we
announcement of an additional $3.5 billion investment         maximise the benefits in the good times and ensure we
in the National Broadband Network. As ongoing                 are best placed to manage the future crises that will
investments in 5G mobile networks demonstrate, the            inevitably come our way.
race to deploy faster and more pervasive networks is
never over.                                                   Ken Boal, Vice President,
                                                              Cisco, Australia & New Zealand

4
Introduction                                                  In 2019, the global research project was updated, with
                                                              the number of countries featured raised to 141 and
Digital readiness is a defining characteristic of             some adjustments made to the metrics used to improve
successful 21st century societies.                            the robustness of the model. The research for Australia’s
                                                              states and territories was subsequently updated for
Digital readiness is a defining characteristic of             2020 and provides the basis for this report.
successful 21st century societies. It describes the level     These results highlight the benefits that flow from past
of capability that a society possesses for extracting         investments and identify areas that warrant additional
value from digital technology and its capacity to share       attention for 2020 and beyond. While changes made
those benefits equitably. It also provides a proxy for        to the metrics mean that some comparisons across
numerous other societal traits such as overall economic       the years are inexact, they paint a broad picture of the
performance.                                                  differences in performance in each component of digital
The Cisco Global Digital Readiness Index was first            readiness for every state and territory over the two-year
released in 2017 as a means of examining and                  period.
comparing the digital readiness of 118 countries, using       The Cisco Australian Digital Readiness Index 2020
a holistic framework that measured seven different            provides both a snapshot of Australia’s evolving digital
components of a country’s capabilities and investments.       capability and acts as a guide for government and
After its publication, a separate research project            industry relative to where additional investments are
was commissioned to look at the digital readiness of          needed to ensure Australia continues to develop as a
Australia specifically with detailed analysis of individual   digitally capable and inclusive society.
states and territories. This was released as the Cisco
Australian Digital Readiness Index 2018.

                                                                                                                         5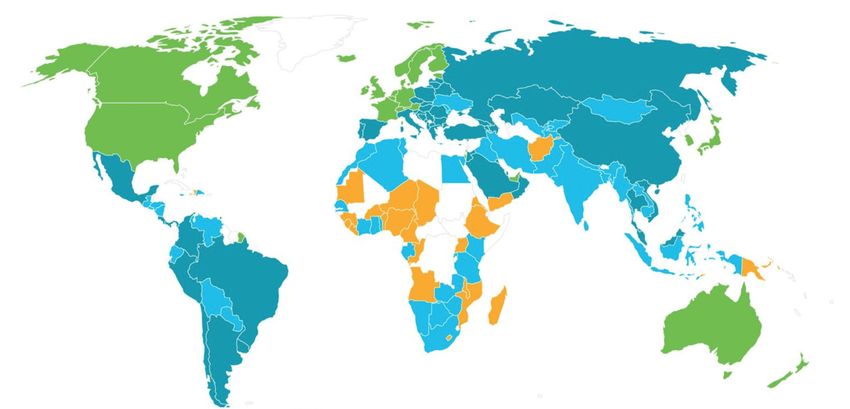
Global Digital Readiness
The digital readiness of a country is determined by examining seven components.

The digital readiness of a country is determined by examining seven components. These are standardised and
summed to obtain an overall digital readiness score measured out of a possible total of 25 points. The seven
components are:

       Basic          Business &         Ease of Doing           Human             Start-up        Technology         Technology
       Needs          Government           Business              Capital         Environment        Adoption         Infrastructure
                      Investment
        Basic                                 Basic            Skilled labour    Environment       Demand for        Infrastructure
     needs for a          Private        infrastructure/          force to       which fosters   digital products/    available to
    population to        and public     policies needed       support digital     innovation          services       enable digital
     survive and      investment in        to support        innovation (build      within a                         activities and
        thrive       innovation and         business           and maintain)      community                            connected
                        technology          continuity                                                                consumers
                                                                                                                      (IoT, Cloud)

fig 1.1 Seven components used to measure Digital Readiness

The score for each component is derived using metrics which have been selected based on their representation
of key components that contribute to each area of readiness and their ability to be compared across all countries
examined.
Together they create a holistic model that incorporates components such as community, health, education
standards, rates of investment, and technology uptake. For example, basic needs is a featured component due
to its contribution to a person’s long-term education outcomes and their ability to develop advanced digital skills.
Similarly, measuring a country’s investment in technology infrastructure and adoption rates describes its ability to
utilise digital skills for economic benefit.

6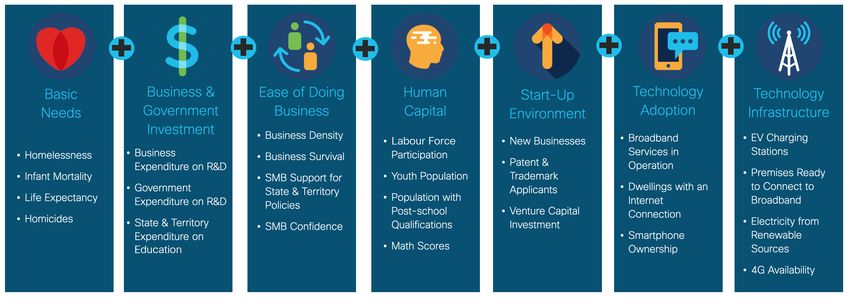
The Cisco Global Digital Readiness Index 2019 measured these components across 141 countries, and uncovered
three stages of digital readiness:

Activate: The lowest stage of digital readiness, indicating the need for interventions that target basic needs as a
foundation for building more advanced digital readiness capabilities.

Accelerate: A moderate stage of digital readiness with ongoing requirements for investment in basic needs but
demonstrating potential for benefits through improvements in other areas, such as ease of doing business. The
breadth of countries included in the Accelerate group saw it subsequently split into two classes – Accelerate Low
and Accelerate High.

Amplify: The highest stage of digital readiness, showing significant existing benefits and great potential for further
uplift from additional investment in infrastructure and higher-level skills development.

fig 1.2 State of Digital Readiness by country

In 2017, Australia scored highly across all seven components of digital readiness and ranked in Amplify group with
an overall score of 17.34 out of a possible 25. This placed Australia among global leaders including the United
States of America, Singapore, and numerous European nations, and demonstrated Australia was well positioned to
enjoy the ongoing benefits of digitalisation.
In 2019, Australia’s digital readiness score increased from 17.34 to 17.89 out of a possible 25 points. However,
while Australia retained its global Amplify ranking in 2019, its ranking fell two places to 12th. This outcome should
be seen in consideration of two countries added to the global list – Iceland and Luxemburg – as both had scores that
placed them higher in the Amplify category. Without their inclusion Australia’s score would have been sufficient for it
to retain its 10th place ranking.
It is also worth noting that the 2019 results saw Singapore advance to the number one position globally, overtaking
the United States, which dropped to third position with the inclusion of Luxembourg in second place. This was again
despite the United States maintaining its score across most components of digital readiness.
These results clearly show the highly competitive global environment and the importance of continued investment to
retain and develop Australia’s overall state of digital readiness.

                                                                                                                         7
Australia’s comparative importance of building digital readiness as a key factor
in ensuring economic prosperity and the value that flows
through building a prosperous, robust and agile society
readiness that can create improved outcomes and manage sudden
changes.
Digital readiness is the key to societal resilience
Breakdown across states and territories
Examining Australia results for the two global reports
shows a story of consistent performance. Australia
Australia’s inclusion in the Amplify cohort places it
scored particularly well in Business and Government
firmly amongst the leading nations. But examination of
Investment, where our global ranking rose from 21st to
the results at a state and territory level tells the story
18th due to a significant increase in score from 1.14 to
of an ongoing digital divide and the need for continued
1.87 out of a possible 3 points.
investment to build a more digitally inclusive society.
Several changes were made to the metrics that
The addition of new countries had a significant impact
comprise each component of digital readiness. These
on Australia’s ranking for Start-up Environment,
changes were made to both improve the robustness
as Luxembourg and Iceland ranked first and third,
of the model, and to maximise comparability between
respectively. This was the only component of readiness
locations.
for which Australia’s score declined year on year.
The Cisco Australian Digital Readiness Index 2018 told a
Australia also experienced a decline of four places for
story of a nation digitally divided, and that story remains
Technology Adoption, from 16th to 20th, despite our
true for 2020, with the Australian Capital Territory (ACT)
score rising from 1.45 to 1.62 out of a possible 3 points.
retaining its ranking as the most digitally ready state or
territory in Australia and the Northern Territory (NT) once
These results highlight the need for ongoing investment
more being ranked last.
in building the capability of organisations to utilise
technology to drive improved outcomes, and point to
Thankfully, however, that gap has narrowed, with the
more work being needed to accelerate technology
score for the NT rising from 4.80 out of a possible 25
adoption as a means of boosting productivity, which will
points to 6.43 in 2020. Combined with changes arising
prove vital as Australia strives to emerge from the post-
from the use of different metrics, the gap between the
COVID-19 recession.
NT and ACT as measured in total points has closed
from 16.34 in 2018 to 11.21 in 2020. This indicates
And despite Australia’s multi-billion-dollar investment
that successful interventions can improve a state or
in the National Broadband Network, it still dropped one
territories’ readiness and gives support for continued
place for Technology Infrastructure. This result was
investment.
due in part to a change in the individual metrics used
to derive this score, as well as the inclusion of Iceland Across the rest of the country overall rankings remained
and Luxembourg. But again, this highlights the need relatively consistent between the 2020 and 2018
for continued investment in the nation’s technological reports, with some jostling for position amongst the
foundations to remain globally competitive. states and territories. The relative closeness of scoring
for many components meant that even relatively small
The 2019 global results showed the continued high changes in scores had an impact to overall rankings.
correlation between digital readiness and per capita
To assist with comparisons, three stages of digital
Gross Domestic Product (GDP), with high GDP countries
readiness have been defined: Amplify High; Amplify
such as Singapore, the United States, and Luxembourg
Medium; and Amplify Low.
all ranking in the top ten. This further reinforces the
8 fig 1.3 Calculating 2020 Australia’s State and Territory level Digital ReadinessAmplify High
While the ACT retained its lead position in the Amplify High group, its overall score declined from 21.14 to 17.64.
This was partly due to changes in the metrics used, which saw the ACT drop from first for fifth position for Ease
of Doing Business. New South Wales’ (NSW) strong start-up ecosystem and ongoing government support saw
it overtake the ACT to lead for Start-up Environment, but its overall score was weighed down by a comparatively
poor showing for Technology Infrastructure, where it fell from third to seventh place.
Amplify Medium
Changes in position saw Victoria (VIC) narrowly miss inclusion in the Amplify High group, instead dropping back
to Amplify Medium. This was despite Victoria lifting its performance for Start-up Environment to overtake the ACT.
Western Australia (WA) retained its position as the fourth most digitally ready state or territory in Australia. This
was despite it losing ground for Ease of Doing Business, where it moved from third to sixth place. However, WA
improved its ranking Technology Infrastructure, where it rose from seventh to fourth.
In 2020 Tasmania (TAS) entered the Amplify Medium group for the first time and was ranked fifth overall, due
in part to a massive leap from sixth to first position for Technology Infrastructure, and its score was bolstered in
Ease of Doing Business, where it jumped from fifth place to lead the nation, and in Technology Adoption, where
it climbed from seventh to fifth place. Tasmania’s leap forward came despite it dropping back significantly for
Business & Government Investment, from third to seventh place.
Queensland (QLD) moved back into sixth position overall, despite making gains in Basic Needs and rising from
sixth to third place for Technology Adoption. This is due to other states gaining.
Amplify Low
This year’s result saw South Australia (SA) move back into the Amplify Low group, despite its overall score
jumping from 10.98 in 2018 to 12.13 in 2020. This is due to other states making gains in this area. SA made
significant progress in Ease of Doing Business, rising from sixth to third place, and in Technology Infrastructure,
where it moved from fifth to third.
And while the NT retained its ranking as Australia’s least digitally ready state or territory, it did make strong
progress in Business & Government Investment, rising from sixth to third place. The NT was also able to make
modest gains in Human Capital, where it moved from third to second place.
State & Territories
• 2 Amplify High 6.43
• 4 Amplify Medium
12.62
• 2 Amplify Low
13.09
12.13
AAA Sub-group
15.10
High
Medium 17.64
Low
14.32
13.00
fig 1.4 Amplification groups by state/territory
9State and Territory Analysis 10
Australian Capital Territory
                                    Capitalising on Digital Readiness
                                    As the seat of the Australian Government, the Australian Capital
                                    Territory (ACT) enjoys the benefits of a highly educated workforce,
                                    and its urbanised population creates advantages in relation to
                                    access to infrastructure. This is attributed to the ACT retaining
                                    its lead place in 2020 as Australia’s most digitally ready state or
                                    territory.
                                    The ACT scored well in Basic Needs, and its position as the centre
                                    of government contributed to its first-place rank for Human Capital,
                                    Technology Adoption and Business & Government Investment.
                                    The ACT has both the highest score for post-school qualifications
                                    and for government expenditure per capita on research and
                                    development.
                                    Where the ACT struggled, however, was in Ease of Doing Business,
                                    where it moved from first to fifth place. The ACT scored highest
                                    nationally for the metric of small and medium business (SMB)
                                    confidence, but having a high percentage of workers engaged in
                                    the public sector led to the ACT scoring seventh for the metric of
                                    business density.
                                    The ACT also witnessed movement in its score for Start-up
                                    Environment, moving from first to third, despite it having the highest
                                    score for the metric of trademark and patent applications per capita.
                                    While the ACT was ranked second for venture capital investment
                                    per capita, the amount invested was only slightly more than half of
                                    that seen in first-placed NSW.
                                    These findings indicate that some work is still to be done by the
                                    ACT government in terms of attracting and fostering new business
                                    and leveraging its highly educated workforce for business creation.

ACT             3.76
                3.76
                                 2.06
                                 1.95
                                                 1.68
                                                 3.00
                                                             2.99
                                                             3.28
                                                                             2.08
                                                                             2.57
                                                                                             2.00
                                                                                             2.81
                                                                                                              3.08
                                                                                                              3.78

Ranking

   #1
DRI 2020

17.64
DRI 2018

21.14
                 c                  t                                                            y                y
              si                  en nt
                                                     g
                                                   in s        an l               up           og n             og re
            Ba eds              m                o     s     m    ta          r t- nt        l
                                                                                            o i   o           l
                                                                                                            o u
                              rn tme          f D ine      Hu api           a e
                                                                        St nm             hn opt          hn uct
             Ne             e
                           v s              o    s           C                          c               c    r
                         Go Inve        a se Bu                           v iro       Te Ad         Te ast
                       &              E                                En                               fr
                   s                                                                                 In
                nes
             si
           Bu
                                                                                                                     11
New South Wales
Building Start-up Leadership
New South Wales (NSW) moved ahead of Victoria (VIC), to claim
second place in digital readiness.
This progress was due in part to an improved result for Start-up
Environment, where NSW climbed into the lead position off the back
of a good result for per capita venture capital investment. The strong
showing for start-ups is in line with NSW being the home of high-
growth companies such as Atlassian, Canva, and WiseTech Global,
coupled with solid community support in the form of incubators and
accelerator programs, and significant state government backing.
This will be boosted in coming years through creation of the
Sydney Innovation and Technology Precinct, which throws down a
clear challenge to other states and territories in terms of start-up
infrastructure investment.
Additional projects such as the Western Sydney Aerotropolis and
Regional Science Hubs are also helping to build momentum, as is the
pioneering work of the NSW Department of Customer Service and
its use of digital technology to improve service outcomes for NSW
citizens.
However, more work needs to be done in fostering Technology
Adoption, where the state’s ranking fell from fourth to sixth.
Furthermore, NSW’s ranking for Technology Infrastructure fell from
third to seventh. This was partially due to a weak showing for metrics
such as the spread of electric vehicle (EV) charging stations and use
of renewable energy. It should be noted that the NSW Government
will be investing in additional broadband infrastructure through its
$100 million Gig State project, which aims to improve the price,
quality of service and choice of internet services for regional NSW.
NSW 3.70
3.69
1.33
1.74
2.31
2.47
1.58
1.65
2.90
2.14
1.68
1.56
1.59
2.33
Ranking
#2
DRI 2020
15.10
DRI 2018
15.58
c t y y
si s en nt
g
in s an l up og n og re
a
B ed m o s m ta r t- nt l
o io l
o u
rn tme f D ine Hu api a e
St nm hn opt hn uct
Ne e
v s o s C c c r
Go Inve a se Bu vi
ro Te Ad Te ast
& E E n f r
s In
nes
si
Bu
12Northern Territory
Building Foundations for Growth
This year’s score for the Northern Territory (NT) shows
some progress has been made in improving digital
readiness, but also indicates much more work is required
before citizens will enjoy the same level of digital
opportunities experienced in more populous states.
This year’s result saw continuing problems in Basic Needs,
where the NT was ranked last due to poor results for
infant mortality and life expectancy, and for its high rate of
homelessness.
However, the impact of efforts to improve outcomes
in the NT, particularly in education, present hope for
future improvement. The NT witnessed significant gains
in Business & Government Investment, in part due to it
reporting the highest level of government expenditure per
student (on an FTE basis). NT also moved into second
place for Human Capital due to its young population and
high rate of labour force participation. Per capita business
expenditure on Research & Development (R&D), however,
was ranked the lowest in Australia, and the NT came last
for Ease of Doing Business and Start-up Environment,
highlighting the Territory’s ongoing problem in attracting
and retaining entrepreneurs and new businesses.
More work is also needed to boost the Territory’s
Technology Infrastructure and Technology Adoption, where
it ranked eighth for the second time. In this instance the
NT’s low population density works against it, producing
poor results in the metrics of EV charging stations and the
availability of 4G services.
NT 0.00
0.00
1.30
1.25
0.91
0.53
2.48
1.90
0.00
0.70
0.74
0.35
1.00
0.06
Ranking
#8
DRI 2020
6.43
DRI 2018
4.80
c t y y
si s en nt
g
in s an l up og n og re
a
B ed m o s m ta r t- nt l
o io l
o u
rn tme f D ine Hu api a e
St nm hn opt hn uct
Ne e
v s o s C c c r
Go Inve a se Bu vi
ro Te Ad Te ast
& E E n f r
s In
nes
si
Bu
13Queensland
Investing for Future Readiness
Queensland (QLD) reported a mixed scorecard for the
Cisco Australia Digital Readiness Index 2020, falling from
fifth to sixth ranking overall, but making gains in some key
components.
The highlight was Queensland’s leap from sixth to third
position for Technology Adoption, which was helped by the
inclusion this year of smartphone ownership as a metric
(for which Queensland tied first with the ACT). But as with
the 2018 Index, Queensland scored last out of all states
and territories for Business & Government Investment and
ranked seventh for Ease of Doing Business. It also retained
its fourth ranked position for Start-up Environment.
However, numerous private and public investment initiatives
hold the potential for significant improvement, including
projects such as Cross-River Rail and the potential for
redevelopment of the Woolloongabba precinct, as well
as ongoing technology-focused development in outer
metropolitan and regional areas such as Springfield and the
Sunshine Coast. A new undersea international broadband
cable landed on the Sunshine Coast is also being used as a
springboard to attract investment to that region, which will
be home to an AustCyber Cyber Security Innovation Node.
And while Queensland held its ranking of fifth for Human
Capital, future years may see the benefit from the state
government’s investment in two new large schools in inner
Brisbane, both being built in conjunction with universities.
QLD 3.60
3.37
0.63
0.79
1.29
1.77
1.59
1.83
1.57
1.48
1.93
1.16
2.01
2.33
Ranking
#6
DRI 2020
12.62
DRI 2018
12.74
c t y y
si en nt
g
in s an l up og n og re
Ba eds m o s m ta r t- nt l
o i o l
o u
rn tme f D ine Hu api a e
St nm hn opt hn uct
Ne e
v s o s C c c r
Go Inve a se Bu v iro Te Ad Te ast
& E En fr
s In
nes
si
Bu
14South Australia
Creating an Innovative Environment
While South Australia’s (SA) overall position of seventh was
a step down from 2018, the state nonetheless increased
its overall score by 1.15 points – the third largest increase
of any state or territory. This was in part due to a significant
uplift in its score for Ease of Doing Business, where it
moved from sixth to third rank off the back of relatively
high SMB confidence and the second strongest five-year
business survival rate in Australia.
South Australia also moved up one rank to fifth position for
its Start-up Environment, while its ranking for Technology
Infrastructure climbed two places to third. This is likely
to be boosted in coming years through government
investment in defence science and manufacturing
capabilities, as well as significant state government
support for innovation precincts in conjunction with local
universities. The Tonsley Innovation Precinct and its focus
on advanced manufacturing is expected to provide the
springboard for new businesses and job creation, and
aligns well with progress already made in South Australia’s
Technology Infrastructure and Start-up Environment.
However, South Australia struggled in Human Capital, partly
due to it having the lowest youth population in Australia
and the lowest percentage of population with post-school
qualifications, as well as the second lowest labour force
participation rate. This requires immediate attention if South
Australia is to capture the benefits of investments in its
innovation and start-up sector.
SA 3.64
3.66
0.84
0.83
2.28
1.78
0.39
0.94
1.11
0.95
1.00
1.28
2.86
1.53
Ranking
#7
DRI 2020
12.13
DRI 2018
10.98
c t y y
si en nt
g
in s an l up og n og re
Ba eds m o s m ta r t- nt l
o i o l
o u
rn tme f D ine Hu api a e
St nm hn opt hn uct
Ne e
v s o s C c c r
Go Inve a se Bu v iro Te Ad Te ast
& E En fr
s In
nes
si
Bu
15Tasmania
Encouraging Business Investment
Tasmania (TAS) was the standout success story
for the Cisco Australian Digital Readiness Index
2020, leaping from seventh to fifth place with an
improvement in its overall score of 3.35 points (the
highest of any state or territory), moving it ahead of
South Australia and Queensland. Tasmania’s strong
result was due in part to it rising from fifth to first
place for Ease of Doing Business, with the state
enjoying the highest five-year business survival rate
and having the highest support amongst SMBs for
government policies, and the second highest rate of
SMB confidence.
Tasmania scored well for Technology Infrastructure,
moving into first place, although this was partially
due to a change in metrics which saw greater
emphasis on renewable energy. Tasmania also
benefited from its early engagement with the
National Broadband Network, with 99.9 per cent of
premises ready to connect. This in turn bodes well
for continued improvement in Technology Adoption,
where Tasmania moved from seventh to fifth place.
These gains came despite Tasmania falling from
third to seventh rank in Business & Government
Investment, which came about due to it having
the second lowest per capita level of business
expenditure on R&D. This indicates further
investment will be needed if Tasmania is to hold on
to its gains.
TAS 2.86
2.86
0.82
1.66
3.11
1.85
0.46
0.72
0.28
0.04
1.71
1.10
3.77
1.43
Ranking
#5
DRI 2020
13.00
DRI 2018
9.65
c t y y
si en nt
g
in s an l up og n og re
Ba eds m o s m ta r t- nt l
o i o l
o u
rn tme f D ine Hu api a e
St nm hn opt hn uct
Ne e
v s o s C c c r
Go Inve a se Bu v iro Te Ad Te ast
& E En fr
s In
nes
si
Bu
16Victoria
Building Human Capital
Victoria (VIC) saw a slight shift in digital readiness for 2020, with a
drop in its score from 16.07 to 14.32. This decrease was sufficient
for it to lose its second ranked position to long-time rival NSW and
move to third position which came about primarily due to drops in
scores for Technology Adoption and Technology Infrastructure.
Victoria did however report strong performance improvement in its
score for Start-up Environment, which rose from 2.04 to 2.25, and
was sufficient to see it overtake the ACT and move into second place
behind NSW. This result reflects the ongoing activity of LaunchVic
in supporting business creation, as well as the impact of ecosystem
partners such as the York Butter Factory. And while NSW might have
the stronger reputation for incubating start-ups overall, Victoria
remains home to many of the country’s digital business success
stories, including REA Group, seek, carsales.com.au and Envato.
Victoria’s fourth place ranking for Human Capital came despite
Victoria ranking second for post-school qualifications and third
in scores in mathematics. This score may be bolstered in future
years by programs such as the Victorian Department of Education’s
Connected Learners Program, which has seen the Department
invest in upgraded Wi-Fi and the doubling of internet speeds for
rural schools, while also introducing new virtual conferencing and
collaboration tools across all government schools.
Significant opportunity exists to lift Technology Infrastructure, where
Victoria fell from fourth to sixth place, through greater investment in
sunrise technologies such as electric vehicles and smart transport
systems, as well as in renewable energy.
VIC
3.81 0.84 2.00 1.82 2.25 1.78 1.84
3.87 1.47 2.18 1.84 2.04 2.46 2.22
Ranking
#3
DRI 2020
14.32
DRI 2018
16.07
c t y y
si en nt
g
in s an l up og n og re
Ba eds m o s m ta r t- nt l
o i o l
o u
rn tme f D ine Hu api a e
St nm hn opt hn uct
Ne e
v s o s C c c r
Go Inve a se Bu v iro Te Ad Te ast
& E En fr
s In
nes
si
Bu
17Western Australia
Mining Digital Success Stories
Western Australia (WA) retained its fourth ranked position for 2020,
despite the ups and downs of the mining industry that tend to drive
its overall economy. WA recorded gains in Technology Infrastructure,
where it moved from seventh to fourth place, but dropped from third
to sixth place for Ease of Doing Business due to low SMB confidence
and low SMB support for government policies.
WA also recorded a slight improvement in its ranking for Technology
Adoption, and further uplift may come about should industry
generally learn from the pioneering work in the resources sector in
the use of technologies such as the Internet of Things, automation,
and Artificial Intelligence. The efforts of the state’s higher education
institutions will provide a multiplying effect here, especially innovative
programs such as the micro-credential program created by Curtin
University that seeks to provide training in more accessible ways.
This suggests there is more work to be done by the government to
ensure that the know-how being developed in the resources sector
can be spread across other industries. Future gains should also flow
from the clear priorities that the WA state government has set in
relation to the innovation economy, human capital and health and
wellbeing, including policies designed to improve access and equity,
and to ensure all citizens and businesses benefit from a thriving
economy.
Realising these gains will, however, require ongoing investing in
network infrastructure to help cover the vast distances and ensure
that the benefits of ongoing innovation policy flow to all corners of
the state – a requirement that has been shown clearly with the recent
travel restrictions imposed in response to COVID-19.
WA 3.28
3.66
1.22
1.33
1.33
2.34
1.90
2.20
1.08
1.22
1.95
2.32
2.33
0.92
Ranking
#4
DRI 2020
13.09
DRI 2018
13.99
c t y y
si en nt
g
in s an l up og n og re
Ba eds m o s m ta r t- nt l
o i o l
o u
rn tme f D ine Hu api a e
St nm hn opt hn uct
Ne e
v s o s C c c r
Go Inve a se Bu v iro Te Ad Te ast
& E En fr
s In
nes
si
Bu
18Summary of Results
ACT 3.76
3.76
2.06
1.95
1.68
3.00
2.99
3.28
2.08
2.57
2.00
2.81
3.08
3.78 NSW 3.70
3.69
1.33
1.74
2.31
2.47
1.58
1.65
2.90
2.14
1.68
1.56
1.59
2.33
Ranking Ranking
#1 #2
DRI 2020 DRI 2020
17.64 15.10
DRI 2018 DRI 2018
21.14 15.58
c t y y c t y y
si en t
g
in s an up og og si en t
g
in s an up og og
Ba eds Do es m tal t- t ol ion ol ure Ba eds Do es m tal t- t ol ion ol ure
nm en Hu api ar en nm en Hu api ar en
Ne ver stm of sin St nm c hn opt c hn uct Ne ver stm of sin St nm c hn opt c hn uct
C r C r
Go ve se Bu vi
ro Te Ad Te ast Go ve se Bu vi
ro Te Ad Te ast
& In Ea En fr & In Ea En fr
ss In ss In
n e n e
si si
Bu Bu
VIC WA
3.81 0.84 2.00 1.82 2.25 1.78 1.84 3.28 1.22 1.33 1.90 1.08 1.95 2.33
3.87 1.47 2.18 1.84 2.04 2.46 2.22 3.66 1.33 2.34 2.20 1.22 2.32 0.92
Ranking Ranking
#3 #4
DRI 2020 DRI 2020
14.32 13.09
DRI 2018 DRI 2018
16.07 13.99
si
c nt
e t
g
in s an up gy gy si
c t
en t
g
in s an up gy gy
Ba eds Do es m tal t- t lo n lo re Ba eds Do es m tal t- t lo n lo re
nm en Hu api ar en no tio no tu nm en Hu api ar en no tio no tu
Ne ver stm of sin C St nm ch dop ch truc N e
v
r
e st m of sin C St nm ch dop ch truc
e u o e e e u o e e
Go ve s B vi
r T A T as Go ve s B vi
r T A T as
& In Ea En fr & In Ea En fr
ss In ss In
i ne i ne
B us Bus
TAS 2.86
2.86
0.82
1.66
3.11
1.85
0.46
0.72
0.28
0.04
1.71
1.10
3.77
1.43 QLD 3.60
3.37
0.63
0.79
1.29
1.77
1.59
1.83
1.57
1.48
1.93
1.16
2.01
2.33
Ranking Ranking
#5 #6
DRI 2020 DRI 2020
13.00 12.62
DRI 2018 DRI 2018
9.65 12.74
c t y y c t y y
si en t
g
in s an up og og si en t
g
in s an up og og
Ba eds Do es m tal t- t ol ion ol ure Ba eds Do es m tal t- t ol ion ol ure
nm en Hu api ar en nm en Hu api ar en
Ne ver stm of sin St nm c hn opt c hn uct Ne ver stm of sin St nm c hn opt c hn uct
C r C r
Go ve se Bu vi
ro Te Ad Te ast Go ve se Bu vi
ro Te Ad Te ast
& In Ea En fr & In Ea En fr
ss In ss In
n e n e
si si
Bu Bu
SA 3.64
3.66
0.84
0.83
2.28
1.78
0.39
0.94
1.11
0.95
1.00
1.28
2.86
1.53 NT 0.00
0.00
1.30
1.25
0.91
0.53
2.48
1.90
0.00
0.70
0.74
0.35
1.00
0.06
Ranking Ranking
#7 #8
DRI 2020 DRI 2020
12.13 6.43
DRI 2018 DRI 2018
10.98 4.80
si
c nt
e t
g
in s an up gy gy si
c t
en t
g
in s an up gy gy
Ba eds Do es m tal t- t lo n lo re Ba eds Do es m tal t- t lo n lo re
nm en Hu api ar en no tio no tu nm en Hu api ar en no tio no tu
Ne ver stm of sin C St nm ch dop ch truc N e
v
r
e st m of sin C St nm ch dop ch truc
e u o e e e u o e e
Go ve s B vi
r T A T as Go ve s B vi
r T A T as
& In Ea En fr & In Ea En fr
ss In ss In
i ne i ne
Bus Bus
1920 20
Conclusion
While many states and territories made good progress         credential programs that can rapidly upskill workers
in lifting their Digital Readiness Index performance for     with new digital capabilities. It also means lifting levels
2020, the results demonstrate the continued need for         of Technology Adoption in the short term to ensure that
ongoing activity to maximise the benefits of investments     organisations can utilise the tools available to them to
made so far to ensure they are shared across Australian      drive the greatest possible benefit. New industries such
society.                                                     as renewable energy will play a key role in job creation
                                                             and will require a highly digitally literate workforce,
As the COVID-19 crisis and subsequent lockdowns
                                                             including digitally skilled trade workers.
have shown, having a strong digital capability is critical
for building an adaptable and resilient society. Many        Investments in digital readiness will provide immediate
organisations were only able to continue functioning         benefits for the post COVID-19 economy, and they will
through the crisis due to their existing investments in      pay dividends in the long term by seeding capabilities
digital infrastructure and capabilities. This can be seen    that will ensure Australia retains or builds on its position
clearly in Victoria, where the Department of Education’s     in comparison to international peers.
investment in wireless networking and collaboration
                                                             These investments will also serve to help close
technology from Cisco proved vital in delivering distance
                                                             Australia’s digital divide. In the 2018 report we examined
learning to tens of thousands of students.
                                                             the notion of the digital divide within Australian society
Now, as Australia begins to cautiously emerge from           and discussed the need for investment in digital
the crisis, it enters into an era of heightened business     readiness as a mechanism for ensuring that the digital
and social uncertainty. With the Australian Federal          dividend is spread evenly. While Australia has made
Government having announced the greatest budget              some steps towards narrowing the gap, more work
deficit since wartime, and the long-term outlook for         remains to be done, and the COVID-19 crisis has
economic growth appearing grim, Australia will need          highlighted the urgency of that work.
to maximise every advantage to improve economic
                                                             In short, digital readiness is a key factor in building a
performance and citizen outcomes, especially if it is to
                                                             resilient society. COVID-19 is unlikely to be the last
lift overall productivity levels.
                                                             crisis that Australia faces this decade, and our ability to
Investments in digital readiness provide a clear             respond to future crises and minimise their impact will
mechanism for doing this. Specifically, this means           greatly depend on the investments we make in digital
improving efforts in the development of Human Capital,       readiness.
to ensure the workforce has the skills needed to design
                                                             It is vital that all elements of Australian society –
and deliver strong digital outcomes for business and
                                                             government, business and individuals – work together to
government over the long term, as well as being able
                                                             build our digital future – and take shared responsibility
to defend this digital infrastructure. This includes the
                                                             for ensuring that Australia’s digital future is one where all
need for investment in so-called ‘blue tech’ skills
                                                             people can feel happy, safe and prosperous.
in the TAFE sector, and the development of micro

                                                                                                                        21
You can also read