HOUSE OF REPRESENTATIVES STANDING COMMITTEE ON ECONOMICS REVIEW OF THE FOUR MAJOR BANKS - COVID-19 UPDATE - NAB News

Page created by Russell Hughes
 
CONTINUE READING
HOUSE OF REPRESENTATIVES STANDING COMMITTEE ON ECONOMICS REVIEW OF THE FOUR MAJOR BANKS - COVID-19 UPDATE - NAB News
National Australia Bank Limited
A National Australia Bank Group Company
800 Bourke Street
Docklands VIC 3008

Wednesday, 31 March 2021

HOUSE OF REPRESENTATIVES STANDING COMMITTEE ON ECONOMICS
REVIEW OF THE FOUR MAJOR BANKS – COVID-19 UPDATE
The Committee requested that NAB provide quarterly written updates (to be published on the Committee’s
website) outlining measures taken in response to the COVID-19 pandemic. This response provides the
Committee with an update for Q1 2021.
Overview
Since the last update to the Committee in December 2020, NAB has continued to support customers impacted
by COVID-19. NAB’s total loan deferral balances are now less than $1bn, down from the peak of $58bn of
deferral balances for our customers, in June 2020. NAB is continuing to work with the small number of
customers who remain on temporary deferral arrangements to find the best way forward for them.
Separately, NAB has implemented various support measures for customers and communities impacted by
the recent flooding in New South Wales.
Additionally, please find attached three recent reports (referenced in this update) prepared by NAB Group
Economics, for the Committee’s information:
     1. NAB Economics Data Insights (week ending 20 March 2021)
     2. NAB Monthly Business Survey (February data)
     3. NAB Special Insight Report ‘Life in the Lucky Country’

Support for flood-affected customers and communities
We encourage customers affected by the recent flooding in New South Wales and Queensland to contact
NAB to discuss the financial relief available. This includes credit card and personal loan relief, deferral of
principal and leasing payments, and waiving fees and charges for withdrawing term deposits early.
NAB has activated a Disaster Relief Fund of up to $3 million, to support our customers and their communities
impacted by the NSW floods. The program of support includes:
    •    $2,000 grants to help provide immediate support for NAB customers who have had their homes
         severely impacted, covering costs such as temporary accommodation, food and clothing;
    •    $2,000 grants for businesses, to help restart or reopen, cover the cost of damaged
         property/equipment, and for loss of stock or livestock;
    •    A $100,000 donation to the NSW State Emergency Service; and
    •    A $100,000 donation to GIVIT’s Severe Storms and Flooding Appeal. NAB will further match up to
         $100,000 of customer donations to GIVIT.

Insights on consumption levels
NAB Group Economics continues to publish aggregated customer transaction data fortnightly, categorised
by industry segment. These publications provide insight into the segments of the economy which are most
affected by the impacts of COVID-19.
The latest release of data was for the week ending 20 March. Following strong periods of consumption
growth, the latest data shows a clear weakening here, relative to the start of 2021. The spike in retail
consumption is returning to normal levels, after the increased spending on household goods and electronics
throughout 2020. Retail consumption is down 6.6% nationally and hospitality consumption is down 4.2%
from January 2021.

National Australia Bank Limited ABN 12 004 044 937 AFSL and Australian Credit Licence 230686
HOUSE OF REPRESENTATIVES STANDING COMMITTEE ON ECONOMICS REVIEW OF THE FOUR MAJOR BANKS - COVID-19 UPDATE - NAB News
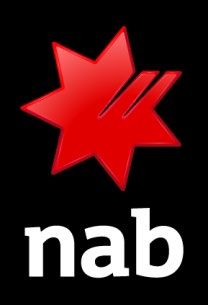
Year-on-year consumption growth at a state level has seen falls across the board, however the changes here
are largely a reflection of the events of March 2020 with the onset of the pandemic. The states with the
strongest year-on-year consumption growth gains in 2020 have generally recorded the largest falls, with the
ACT at -8.9%, SA at -3.6% and Victoria at -2.4%.

The detailed report is attached.
Improved business confidence and conditions
Business confidence continues to rise and is currently at +16. This is the highest level since early 2010. It
represents an increase across all states and all industry sectors, except retail. Business conditions are at +15,
which is an increase from a drop in January and back on par with December 2020. This is the highest level
recorded since August 2018. Conditions are strongest in mining and retail and are weakest in construction.
Western Australia leads the nation in both business confidence and business conditions measures. Victoria
has made gains in both measures, reflecting the State’s growth as restrictions have continued to ease.
SME business confidence is at its highest level since NAB began tracking this measure in 2006. Victoria
reported the largest gain here, reflecting improved small business conditions following the easing of
lockdown restrictions. Overall, Victoria still lags behind the other states in these measures. The largest
increase in SME business confidence was reported in the accommodation, cafes & restaurants sector, which
experienced an increase of 48 points.
The complete report is attached.
Optimism about the future of Australia
The NAB Behavioural Economics team recently published its annual Special Insight Report: ‘Life in the Lucky
Country’, measuring the views of 2,000 Australians of varied backgrounds on Australia’s prosperity. Despite
the events of 2020, results indicate that Australians have emerged more positive. More respondents than
ever before agree that Australia is a great place to live (94% in 2021, 88% in in 2020). This was driven by
access to open spaces such as beaches and parks, Australia’s relative success in managing COVID, and the
general lifestyle and friendliness of people.
Australians are also far more optimistic about the future liveability of Australia. 68% of respondents think
Australia will be a great place to live in 10 years’ time, up from 55% from last year.
The full report is attached.

Support for first home buyers
NAB continues to support the Federal Government’s initiatives for first home buyers and has helped over
4,300 customers purchase their first home under the First Home Loan Deposit Scheme (FHLDS). We have also
supported approximately 2,000 customers under the ‘New Homes’ extension of the FHLDS.

COVID-19 loan deferral data
NAB has a small number of customers that remain on temporary loan deferral arrangements.
As at 28 February 2021:
    • Total loan deferrals (balances) of less than $1bn, down from peak of $58bn in June 2020.
    • Home loan deferrals (balances) of $0.5bn (0.2% of portfolio), down from peak of $32bn (12.3% of
        portfolio) in June 2020.
    • SME loan deferrals (balances) of $0.1bn (0.2% of portfolio), down from peak of $15bn (17.6% of
        portfolio) in June 2020.
    • Other loan deferrals incl. loans to non-residents, loans to non-SME businesses and loans for personal
        purposes (balances) of $239m (0.2% of portfolio), down from peak of $10.693b (7% of portfolio) in
        June 2020.
    • Total loan deferrals (no. of facilities) of 1,488, down from peak of 115,780 in June 2020.
    • Home loan deferrals (no. of facilities) of 1,037 (0.1% of portfolio), down from peak of 67,012 (8.8%
        of portfolio) in June 2020.
    • SME loan deferrals (no. of facilities) of 270 (0.1% of portfolio), down from peak of 36,422 (8.0% of
        portfolio) in June 2020.
    • Other loan deferrals incl. loans to non-residents, loans to non-SME businesses and loans for personal
        purposes (no. of facilities) of 181 (0.01% of portfolio), down from a peak of 12,346 (0.8% of portfolio)
        in June 2020

National Australia Bank Limited ABN 12 004 044 937 AFSL and Australian Credit Licence 230686
HOUSE OF REPRESENTATIVES STANDING COMMITTEE ON ECONOMICS REVIEW OF THE FOUR MAJOR BANKS - COVID-19 UPDATE - NAB News
Approach to customers requiring further support
NAB understands that some customers may need further assistance. We encourage customers in need of
support to contact us.
The NAB Assist team will work with Personal Banking customers to find the best solution for them. In
December 2020, NAB CEO Ross McEwan wrote to 4 million customers, to remind them that NAB will:
    •    treat every single customer fairly and individually;
    •    show understanding that loan repayments are not our customers’ only bills;
    •    provide our customers with clear and simple information about their options; and
    •    work to get our customers to the other side in the best possible position.

Our Business Customer Care team continues to offer support to our Business Banking customers and will
offer loans under the SME Recovery Loan scheme.

NAB welcomes the Federal Government’s announcement of the scheme and believes the package is a
thoughtful extension to existing SME Guarantee Scheme, with the increase in loan term from five to ten
years a particularly welcome feature. We also welcome the extension of this scheme to customers affected
by the recent floods. NAB is engaging closely with the Federal Department of Treasury on the final scheme
details and is developing a loan product that will be available to customers from early April. NAB has
approved more 6,500 Business Support Loans under phase 1 and phase 2 of the existing SME Guarantee
Scheme.

National Australia Bank Limited ABN 12 004 044 937 AFSL and Australian Credit Licence 230686
Early release of superannuation

Our MLC Wealth business (to be sold to IOOF subject to regulatory approvals), has paid approximately $1.36
billion in early release superannuation payments. The COVID-19 Early Release Scheme for superannuation
played an important role in the pandemic. Given that superannuation is a long-term investment and sets
people up for their retirement, MLC continues to engage with its members to talk about how they can get
their super savings back on track.

National Australia Bank Limited ABN 12 004 044 937 AFSL and Australian Credit Licence 230686
EMBARGOED UNTIL 11:30AM 25 MARCH 2021
NAB Cashless Retail Sales Index

NAB ECONOMICS DATA INSIGHTS
WEEK ENDING 20 MARCH 2021
COMMENTS FROM NAB GROUP CHIEF ECONOMIST ALAN OSTER
•     During these extraordinary times, NAB has taken the decision to publish aggregated customer data categorised
      by industry segment with the view to helping provide clarity around which segments of the economy have been
      most affected by the broader macroeconomic trends at play. NAB takes data privacy very seriously. All customer
      transaction data has been aggregated and no individual’s data is specifically identified or analysed as part of this
      process. The data used in this report will not be sold or made publicly available, but insights from the data will be
      shared with the Australian people.
•     As we are now squarely one year from the onset of the first Australian coronavirus lockdowns, what then can we
      deduce from the latest weekly data? Firstly, there is a clear weakening in the consumer data relative to where we
      were at the start of 2021, and this doesn’t appear to be seasonal. Retail is down 6.6% from first week of January
      2021 and hospitality down 4.2%. With total consumption essentially flat, some other services have gained.
•     However, it is important to consider just how exceptional 2020 was for many parts of retail. Household goods,
      electronic goods and department stores all surged on people working from home, requiring extra equipment and
      upgrading their living spaces. But this trend was likely to have been a one-off, and we are now seeing retail return
      to more “normal” levels. Hospitality had a very tough 2020, and while the uptick late in the year was very welcome,
      the more subdued performance recently is less so.
•     In index terms (2019 base), for the week ending 20 March 2021, the overall consumption series (+123) is above
      where it was for the same week 2020 (+109) on a weekly basis. In year on year growth terms for week 11 of 2021,
      growth was slightly negative (-2.3%). Bear in mind though that the same week 2020 was up 9%, so much of this
      y/y comparison now is really the base effects from the 2020 jump.
•     State y/y growth likewise needs to be read in this context, with the headline changes largely a reflection of what
      happened a year ago. Some of the states with the sharpest falls, such as the ACT (-8.9%), NSW (-2.5%), SA (-3.6%),
      VIC (-2.4%) had recorded some of the strongest gains in 2020. In contrast, the slowest state for the same period
      2020, WA, was virtually flat last week (-0.1%, y/y). With no lockdowns recently, state results are more aligned
      than they were for much of 2020.
•     Overall inward credits growth slowed to around 1% last week. But again this reflects technical issues. In this case,
      a big fall in finance (around -7.2% and especially asset servicing down around -25.4%) has moved the dial
      substantially. If we exclude finance, business credits are up 7.5% y/y.
•     JobKeeper is scheduled to end around a week from now. While our data showed many businesses heavily
      dependent on the program last year, it is now only contributing a small amount to business in aggregate. However,
      some industries (such as international tourism) are substantially more dependent than the headline data suggests.

    WEEKLY INDEX- BASE RESET ANNUALLY                          RETAIL TRADE BY INDUSTRY GROUP
    180                                                          80%
              Overall                     Retail                                                                                                (% change year-on-year)
    160                                                          60%
              Hospitality                 Overall (2020)
              Retail (2020)               Hospitality(2020)      40%
    140
    120                                                          20%

    100                                                           0%

    80                                                          -20%

    60                                                          -40%
                                                                                                                                                                                Houseware and Textile Goods…
                                                                       Clothing, Footwear and Personal

                                                                                                                                                                                                                                               Motor Vehicle Parts and Tyre
                                                                                                                             Electrical and Electronic Goods

                                                                                                                                                               Fuel Retailing
                                                                                                         Department Stores

                                                                                                                                                                                                                                                                              Motor Vehicle Retailing

                                                                                                                                                                                                                                                                                                                                                                         Specialised Food Retailing

                                                                                                                                                                                                                                                                                                                                                                                                          Supermarket and Grocery Stores
                                                                                                                                                                                                               Hardware, Building and Garden

                                                                                                                                                                                                                                                                                                        Pharmaceutical and Other Store-

                                                                                                                                                                                                                                                                                                                                          Recreational Goods Retailing
                                                                                                                                                                                 Furniture, Floor Coverings,

    40
                                                                              Accessory Retailing

                                                                                                                                                                                                                    Supplies Retailing

                                                                                                                                                                                                                                                                                                               Based Retailing

    20
                                                                                                                                                                                                                                                       Retailing
                                                                                                                                         Retailing
            3-Apr-21

           16-Oct-21
           30-Oct-21
           23-Jan-21

           20-Feb-21
            6-Mar-21

           17-Apr-21

            10-Jul-21
            24-Jul-21

           18-Sep-21
            7-Aug-21

          13-Nov-21
          27-Nov-21
          11-Dec-21
          25-Dec-21
          20-Mar-21

           1-May-21

          21-Aug-21
            4-Sep-21

            2-Oct-21
             9-Jan-21

            6-Feb-21

          15-May-21
          29-May-21
           12-Jun-21
           26-Jun-21

                                                                                                                                                                                                                                                                                                                                                                                                      1
-

                                                                                                                                                                      40%

                                                                                                                                                 -60%
                                                                                                                                                        -10%

              -5.0%
                             0.0%
                                         5.0%
                                                  10.0%
                                                             15.0%
                                                                       20.0%
                                                                                 25.0%
                                                                                                                                                                                                                                                                                                          50
                                                                                                                                                                                                                                                                                                               100
                                                                                                                                                                                                                                                                                                                     150
                                                                                                                                                                                                                                                                                                                           200
                                                                                                                                                                                                                                                                                                                                 250
                                                                                                                                                                                                                                                                                                                                        300
                                                                                                                                                                                                                                                                                                                                                                               350
                                                                                                                                       Jan-20
21-Mar-20                                                                 19.7%
                                                                             21.4%                                                                                                                                                                                                          Jan-19
 04-Apr-20                                                                    23.6%
                                                                              23.1%                                                    Feb-20
 18-Apr-20                                                                19.3%
                                                                             21.5%                                                                                                                                                                                                          Feb-19
02-May-20                                                            15.6%                                                             Mar-20
                                                                     15.7%
16-May-20                                                   11.0%
                                                            11.2%
30-May-20                                                 9.8%                                                                         Apr-20                                                                                                                                               Mar-19

                                                                                                                                                                            Construction
                                              5.9%
 13-Jun-20                                    5.7%
                                         3.5%
 27-Jun-20-1.5%                                                                                                                        May-20                                                                                                                                               Apr-19
                                      1.7%
  11-Jul-20                         0.3%
                                     0.8%                                                                                              Jun-20
  25-Jul-20                         0.3%
           -0.9%                                                                                                                                                                                                                                                                            May-19

                                                                                                                                                                            Healthcare & Social Assist.
08-Aug-20                                3.4%
            -0.7%                                                                                                                       Jul-20
22-Aug-20                               2.8%

                                                                                                                                                                            Accommodation & Food Serv.
                                                                                                                                                                            Agriculture, Forestry & Fishing
             -0.1%                                                                                                                                                                                                                                                                          Jun-19
 05-Sep-20                             2.1%
                                             5.6%                                                                                      Aug-20
 19-Sep-20                                    6.0%
                                             5.2%
 03-Oct-20                                4.2%                                                                                         Sep-20
                                                                                                                                                                                                                                                                                             Jul-19
                                           4.3%
 17-Oct-20                            1.5%
                                    0.6%
 31-Oct-20-0.6%                                                                                                                        Oct-20                                                                                                                                               Aug-19
                                        2.7%
                                                                                                                                                                                                                                                                                                                                       Arts and Recreation Services

14-Nov-20                               2.5%
                                                6.8%
28-Nov-20                                    5.6%                                                                                      Nov-20

                                                                                                                                                                            Total
                                                 7.7%                                                                                                                                                                                                                                       Sep-19
12-Dec-20                                          8.7%
                                              5.8%                                                                                     Dec-20
26-Dec-20                                               12.1%
                                                                                                                                                                                                                                                                                                                                       Accommodation and Food Services

                                            5.0%                                                                                                                                                                                                                                            Oct-19
 09-Jan-21                                  4.7%
                                                  8.3%                                                                                 Jan-21
 23-Jan-21                                          9.2%
                                               6.4%
 06-Feb-21                                                 14.3%                                                                                                                                                                                                                            Nov-19
                                                         12.6%                                                                         Feb-21

                                                                                                                                                                            Education & Training
                                                                                                                                                                                                                                                                                                                                       Electricity, Gas, Water and Waste Services

 20-Feb-21                                              12.2%

                                                                                                                                                                            Arts & Recreation Serv.

                                                                                                  PAYMENT INFLOWS INTO NAB MERCHANTS
                                                                                                                                                                            Admin. & Support Serv.
                                                     10.2%
06-Mar-21                                         8.2%
                                                                                                                                                                                                                                                                                                                                       Information Media and Telecommunications

                                        2.9%                                                                                           Mar-21                                                                                                                                               Dec-19
20-Mar-21                            1.0%
                                                                                                                                       Apr-21                                                                                                                                               Jan-20

                                                                                                                                                                                                                                                                                            Feb-20

                                    0%
                                            10%
                                                    20%
                                                             30%
                                                                      40%
                                                                               50%

            -20%
                      -10%
                                                                                            60%
                                                                                                                                                                            40%

                                                                                                                                                 -60%
                                                                                                                                                               -10%
  Feb-20                                                                                                                                                                                                                                                                                    Mar-20
                                                                                                                                       Jan-20

 Mar-20                                                                                                                                Feb-20                                                                                                                                               Apr-20
                                                                                                                                                                                                                                                                                                                                       Construction

                                                                                                                                       Mar-20

                                                                                     Corporate
  Apr-20                                                                                                                                                                                                                                                                                    May-20

                                                                                                                                                                                 Other Serv.
                                                                                                                                                                                 Retail Trade
                                                                                                                                       Apr-20
                                                                                                                                                                                                                                                                                                                                                                                         CONSUMPTION SPENDING BY INDUSTRY (INDEX, 100 = JAN 2019)

 May-20

                                                                                                                                                                                 Manufacturing
                                                                                                                                                                                                                                                                                            Jun-20
                                                                                                                                       May-20
  Jun-20                                                                                                                                                                                                                                                                                     Jul-20

                                                                                     Large
                                                                                                                                       Jun-20
   Jul-20                                                                                                                                                                                                                                                                                   Aug-20
                                                                                                                                        Jul-20
 Aug-20
                                                                                                                                       Aug-20                                                                                                                                               Sep-20
                                                                                                                                                                                                                                                                                                                                       Health Care and Social Assistance

  Sep-20                                                                                                                               Sep-20

                                                                                     Medium
                                                                                                                                                                                                                                                                                            Oct-20
                                                                                                                                                                                                                                                                                                                                       Administrative and Support Services

  Oct-20                                                                                                                               Oct-20
                                                                                                                                                                                                                                                                                            Nov-20
                                                                                                                                       Nov-20
 Nov-20
                                                                                                                                                                                 Mining

                                                                                                                                                                                                                                                                                            Dec-20
                                                                                                                                                                                                                   PAYMENT INFLOWS INTO NAB MERCHANTS (6 WEEK ROLLING AVERAGE YOY CHANGE)
                                                                                                                                                                                                                                                                                                                                       Professional, Scientific and Technical Services

                                                                                                  RETAIL TRADE BY INDUSTRY GROUP
                                                                                                                                       Dec-20
 Dec-20

                                                                                     Emerging
                                                                                                                                       Jan-21                                                                                                                                               Jan-21
  Jan-21
                                                                                                                                       Feb-21                                                                                                                                               Feb-21
  Feb-21                                                                                                                               Mar-21
                                                                                                                                                                                                                                                                                            Mar-21
                                                                                                                                                                                 Prof., Scientific & Tech. Serv.

                                                                                     Small
                                                                                                                                                                                 Transport, Postal & W/housing

 Mar-21                                                                                                                                Apr-21
AUTHORS
 Alan Oster                                                  Dean Pearson
 Group Chief Economist                                       Head of Behavioural & Industry Economics
 Alan.Oster@nab.com.au                                       Dean.Pearson@nab.com.au
 +(61 0) 414 444 652                                         +(61 0) 457 517 342

 Brien McDonald                                              Robert De Iure
 Associate Director - Economics                              Associate Director - Economics
 Brien.McDonald@nab.com.au                                   Robert.De.Iure@nab.com.au
 +(61 0) 455 052 520                                         +(61 0) 477 723 769

 Steven Wu                                                   Phin Ziebell
 Associate Director - Economics                              Associate Director - Economics
 Steven.A.Wu@nab.com.au                                      Phin.Ziebell@nab.com.au
 +(61 0) 472 808 952                                         +(61 0) 475 940 662

Important Notice
This document has been prepared by National Australia Bank Limited ABN 12 004 044 937 AFSL 230686 ("NAB"). Any
advice contained in this document has been prepared without taking into account your objectives, financial situation
or needs. Before acting on any advice in this document, NAB recommends that you consider whether the advice is
appropriate for your circumstances.
NAB recommends that you obtain and consider the relevant Product Disclosure Statement or other disclosure
document, before making any decision about a product including whether to acquire or to continue to hold it.
Please click here to view our disclaimer and terms of use.
EMBARGOED UNTIL: 11:30AM AEDT, 9 MARCH 2021
NAB MONTHLY BUSINESS SURVEY FEBRUARY 2021
BUSINESS CONDITIONS BOUNCE, CONFIDENCE RISES FURTHER
NAB Australian Economics
Key messages: The survey results were strong in February. Business confidence rose further in February to
reach 16 index points, its highest level since early 2010, with all states and industries reporting gains, except for
retail. Business conditions bounced to return to around multi-year highs at 15 index points, after slipping in the
month prior, with trading, profitability and employment conditions all marking solid improvements. Conditions
remain very strong in retail, wholesale, mining and professional services, while construction, personal services
and transport conditions continue to lag. Elsewhere, capacity utilisation and capex continue to rise and have
now exceeded pre-virus levels and their long-run averages – an encouraging sign that the turnaround in
business conditions and steady improvement in confidence is translating to higher capacity utilisation and
increased investment. The survey continues to point to a robust recovery in the business sector, despite some
tapering of government support beginning in late 2020. This is a positive sign for the economy, where ongoing
strength in the business and household sector is needed to sustain the recovery.

HIGHLIGHTS
• How confident are businesses? Confidence rose 4pts to a well-above average +16 index points.
• How did business conditions fare? Conditions rebounded to +15 index points – matching its December reading, which was
      the highest level recorded since August 2018.
• What components contributed to the result? All three sub-components rose in the month, with trading conditions leading
      the rise (up 8pts) and smaller gains in the employment index (up 5pts) and profitability (up 4pts).
• What is the survey signalling for jobs growth? The employment index suggests continued above-average jobs growth, with
      more firms reporting higher employment over the month than firms reporting lower employment.
• Which industries are driving conditions? The rise in conditions was broad-based across industries with the exception of
      retail, rec & personal and mining, although all three remain at strong levels in the range of 18 to 22 index points. Wholesale
      led the improvement in the month (up 29pts), but all industries reported conditions in positive territory. Overall, in trend
      terms conditions remain strongest in mining and retail, while weakest in construction.
•     Which industries are most confident? Confidence rose across all industries except retail which fell 4pts. Mining led the gains
      in the month although rec & personal and manufacturing also recorded large increases. In trend terms, rec & personal and
      retail confidence lags the other industries, suggesting businesses in these areas are the least optimistic about further gains for
      their industry.
•     Where are we seeing the best conditions by state? The improvement in conditions was led by large gains in NSW and WA,
      which offset falls in Tas and SA. In trend terms, WA is highest, while NSW, Vic and Tas are lagging, albeit recording similar
      above-average conditions at 9-11 index points.
•     What is confidence like across the states? Confidence rose across states and all states are recording strong levels. In trend
      terms, confidence is highest in WA and lowest in Tasmania.
•     Are leading indicators suggesting further improvement? Capacity utilisation edged up in the month and is now above its
      long-run average and its pre-COVID level. Forward orders alos rose and are now well above average.
•     What does the survey suggest about inflation and wages? Generally, price pressures remain soft with final product price
      growth remaining sluggish, although retail price inflation picked up. Labour costs growth also strengthened.
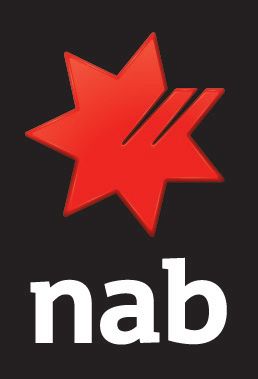
    TABLE 1: KEY STATISTICS                                                                           CHART 1: CONDITIONS AND CONFIDENCE RISE
                                                Dec-20     Jan-21      Feb-21
                                                         Net balance
                                                                                                        30
    Business confidence                              6         12           16                          20
    Business conditions                             15           9          15                          10
      Trading                                       23         13           21                           0
      Profitability                                 14         13           17                         -10
      Employment                                    10           3           8                         -20
    Forward orders                                   3           3           8                         -30
    Stocks                                           0           2           2                         -40
    Exports                                         -4          -4          -2
                                                                                                       -50
                                                  % change at quarterly rate
    Labour costs                                   0.8        0.7          1.0                         -60
    Purchase costs                                 1.0        0.7          0.6                         -70
    Final products prices                          0.1        0.2          0.2                            2010            2012          2014          2016           2018          2020
     Retail prices                                 1.1        0.7          1.0
                                                          Per cent                                                    Business Confidence                       Business Conditions
     Capacity utilisation rate                      80.8       81.1        81.8                          * Dotted lines are long-run averages since Mar-97.
All data seasonally adjusted and subject to revision. Fieldwork for this survey was conducted from 18 Febraury to 1 March 2021, covering over 530 firms across the non-farm business sector.
Next release date: 13 April 2021 .

Contacts: Alan Oster – Chief Economist, Kaixin Owyong – Senior Economist, Gareth Spence – Senior Economist
© National Australia Bank Limited ABN 12 004 044 937 AFSL and Australian Credit Licence 230686
NAB MONTHLY BUSINESS SURVEY - THEME OF THE MONTH
 CAPACITY UTILISAITON POINTS TO FURTHER INCREASES IN ACITIVTY       CHART 2: CAPACITY UTILISATION (%)
 • Capacity utilisation increased further in February, rising to    86
    81.8% – its highest level since mid-to-late 2019. Capacity
    utilisation has now risen by 9.7ppts since reaching a           84

    trough in activity in April 2020.
                                                                    82

 • By industry, the gains in capacity utilisation were led by an    80
    increase in transport & utilities and wholesale, but all
    industries saw an increase. Capacity utilisation continues      78
    to be highest in retail trade and wholesale but is now also
                                                                    76
    above average in manufacturing as well. In contrast,
    utilisation remains below average in construction, mining       74
    and recreation & personal services (which continues to see                       Quarterly
    ongoing restrictions). Finance business & property services     72
                                                                                     Monthly
    and transport & utilities are broadly around average.
                                                                    70
                                                                      1989    1993   1997      2001        2005     2009      2013      2017     2021
 • The survey measure of capacity utilisation has tracked
    activity fairly well over the past year – capturing not just    CHART 3: CAPACITY UTILISATION BY INDUSTRY (%)
    the timing of impacts from major lockdowns but also the
                                                                    95
    impact of changing consumer spending patterns across                                    Feb-20         Apr-20     Feb-21         Average
    industries. This is clearest in retail and wholesale, which     90
    has benefited from increased spending due to remote             85
    working, online shopping and substitution away from             80
    spending on services which were restricted.                     75
                                                                    70
 • With capacity utilisation now above average, it suggests
                                                                    65
    that the economy is likely to have recovered its pre-COVID
                                                                    60
    level in Q1 2021, a little earlier than NAB forecasts. Beyond
    this, capacity utilisation will be an important indicator of    55
    inflationary pressure in the economy, although there is         50
    elevated uncertainty around the underlying pace of
    growth in the economy.

 • Increased capacity utilisation will put upward pressure on
    employment and capital expenditure (capex) plans going
    forward. Notably, capex had lagged the recovery in the
    survey’s activity variables through 2020, but has now           CHART 4: CAPEX BY INDUSTRY (%)
    turned positive and is at its highest level since mid-2019.
                                                                         15                                                                       15
 • By industry, capex is currently highest in retail and above                                   Current            Average
    average in all industries with the exception of mining and
                                                                         10                                                                       10
    rec & personal services. Encouragingly, 12-month
    expectations from the Q4 NAB Quarterly Business survey
    are at a relatively high level in aggregate. Beyond this, the        5                                                                        5
    ABS capex survey points to a further substantial rise in
    2021/22 – though the first estimates in this data only have
                                                                         0                                                                        0
    a loose relationship with final outcomes.

 • Business investment is likely to be a key swing variable
                                                                         -5                                                                       -5
    over the next couple of years. As a share of GDP business
    investment had fallen to a relatively low level, with little
    evidence of a material pickup in the pipeline. The impact
    of interest rates on investment remains uncertain, with
    demand and cashflow alongside capacity utilisaiton likely
    the key determinants. For now, the rebound in business
    conditions and capacity utilisation is encouraging.
    However, uncertainty remains high and a likely
    impediment to investment so we will continue to closely
    watch business confidence.

                                                                                                                                               Page | 2
NAB MONTHLY BUSINESS SURVEY – CONDITIONS AND CONFIDENCE
CHART 5: BUSINESS CONFIDENCE (NET BALANCE)                               CHART 6: BUSINESS CONDITIONS (NET BALANCE)
                                                                          25
 20                                                                       20
 10                                                                       15
  0                                                                       10
                                                                           5
-10                                                                        0
-20                                                                       -5
-30                                                                      -10
                                                                         -15
-40                                                                      -20
-50                                                                      -25
-60                                                                      -30
                                                                         -35
-70                                                                      -40
   Feb-18 Aug-18      Feb-19 Aug-19           Feb-20 Aug-20     Feb-21      Feb-18 Aug-18      Feb-19 Aug-19            Feb-20 Aug-20         Feb-21
                Seasonally adjusted                   Trend                               Seasonally adjusted                      Trend

CHART 7: COMPONENTS OF BUSINESS CONDITIONS, NET BALANCE, S.A.            CHART 8: BUSINESS CONDITIONS AND BUSINESS CONFIDENCE
                                                                          30
 30
                                                                          20
 20                                                                       10
                                                                           0
 10
                                                                         -10
  0                                                                      -20
                                                                         -30
-10
                                                                         -40
-20                                                                      -50
                                                                         -60
-30
                                                                         -70
-40                                                                         1998   2001    2004     2007        2010     2013    2016        2019
   Feb-18 Aug-18 Feb-19 Aug-19 Feb-20 Aug-20 Feb-21                                Business Confidence                 Business Conditions
           Trading            Profitability          Employment           * Dotted lines are long-run averages since Mar-97.

CHART 9: BUSINESS CONDITIONS BY INDUSTRY, LATEST MONTH (TREND)           CHART 10: BUSINESS CONDITIONS BY STATE, LATEST MONTH (TREND)
 35                                                                      25
 30
 25                                                                      20
 20
 15                                                                      15
 10
  5                                                                      10
  0
                Business Conditions       Business Confidence
 -5                                                                       5

                                                                          0

                                                                                          Business Conditions          Business Confidence

                                                                                                                                               Page | 3
NAB MONTHLY BUSINESS SURVEY – FORWARD AND OTHER INDICATORS
CHART 11: FORWARD ORDERS (NET BALANCE)                           CHART 12: CAPITAL EXPENDITURE (NET BALANCE)
                                                                  20
 10
                                                                  10
  0
                                                                   0
-10
                                                                 -10
-20                                                              -20
-30                                                              -30

-40                                                              -40
   Feb-18 Aug-18 Feb-19 Aug-19 Feb-20 Aug-20 Feb-21                 Feb-18 Aug-18 Feb-19 Aug-19 Feb-20 Aug-20 Feb-21
                 Seasonally adjusted              Trend                                   Seasonally adjusted                               Trend

CHART 13: CAPACITY UTILISATION AND UNEMPLOYMENT                  CHART 14: CAPACITY UTILISATION (PPT DEVIATION FROM LR AVE, TREND)
 %                                                          %
10                                                          71   15

 9                                                          73   10
 8                                                          75     5
 7                                                          77     0
 6                                                          79    -5
 5                                                          81
                                                                 -10
 4                                                          83                     5yr range
                                                                 -15
 3                                                          85                  Current

  2008    2010     2012    2014    2016   2018    2020           -20
      Unemp rate (LHS)                 Unemp rate, trend (LHS)
      Cap use (RHS)                    Cap use, trend (RHS)

CHART 15: STOCKS (NET BALANCE)                                   CHART 16: CASH FLOW (NET BALANCE)
 12                                                               60
  8                                                               50
  4                                                               40
                                                                  30
  0
                                                                  20
 -4
                                                                  10
 -8                                                                0
-12                                                              -10
-16                                                              -20
   Feb-18 Aug-18 Feb-19 Aug-19 Feb-20 Aug-20 Feb-21                 Feb-18 Aug-18 Feb-19 Aug-19 Feb-20 Aug-20 Feb-21
                 Seasonally adjusted              Trend                                          Index                                Trend

CHART 17: EXPORTS (NET BALANCE)                                  CHART 18: BORROWING CONDITIONS (% OF FIRMS)
                                                                                               Borrowing conditions (% of firms)
  4                                                              100
  2
                                                                  80
  0
 -2                                                               60

 -4
                                                                  40
 -6
 -8                                                               20

-10                                                                0
   Feb-18 Aug-18 Feb-19 Aug-19 Feb-20 Aug-20 Feb-21                     IV            I                II                III          IV               I
                 Seasonally adjusted              Trend                2019                                    2020                               2021

                                                                              More difficult       Unchanged          Easier   No borrowing required

                                                                                                                                                           Page | 4
NAB MONTHLY BUSINESS SURVEY - DETAIL BY STATE AND INDUSTRY
CHART 19: BUSINESS CONDITIONS BY STATE (NET BAL., TREND)        CHART 20: BUSINESS CONDITIONS BY STATE (NET BAL., TREND)
 40                                                              40
 30                                                              30
 20                                                              20
 10                                                              10
  0                                                               0
-10                                                             -10
-20                                                             -20
-30                                                             -30
-40                                                             -40
   Feb-19 Jun-19 Oct-19 Feb-20 Jun-20 Oct-20 Feb-21                Feb-19 Jun-19 Oct-19 Feb-20 Jun-20 Oct-20 Feb-21
           Australia        NSW            VIC           QLD               Australia          WA           SA           TAS

CHART 21: BUSINESS CONFIDENCE BY STATE (NET BAL., TREND)        CHART 22: BUSINESS CONFIDENCE BY STATE (NET BAL., TREND)
 20                                                              20
 10                                                              10
  0                                                               0
-10                                                             -10
-20                                                             -20
-30                                                             -30
-40                                                             -40
-50                                                             -50
   Feb-19 Jun-19 Oct-19 Feb-20 Jun-20 Oct-20 Feb-21                Feb-19 Jun-19 Oct-19 Feb-20 Jun-20 Oct-20 Feb-21
           Australia        NSW            VIC           QLD               Australia          WA           SA           TAS

CHART 23: BUSINESS CONDITIONS BY INDUSTRY (NET BAL., TREND)     CHART 24: BUSINESS CONDITIONS BY INDUSTRY (NET BAL., TREND)
 40                                                              40
 30                                                              30
 20                                                              20
 10                                                              10
  0                                                               0
-10                                                             -10
-20                                                             -20
-30                                                             -30
-40                                                             -40
-50                                                             -50
   Feb-19 Jun-19 Oct-19 Feb-20 Jun-20 Oct-20 Feb-21                Feb-19 Jun-19 Oct-19 Feb-20 Jun-20 Oct-20 Feb-21
          Mining                          Manufacturing                Retail                          Wholesale
          Construction                    Transport/Utilities          Finance/Bus/Property            Rec & personal services

                                                                                                                           Page | 5
NAB MONTHLY BUSINESS SURVEY - EMPLOYMENT, WAGES AND PRICES
CHART 25: EMPLOYMENT                                                       CHART 26: EMPLOYMENT (NAB VS ABS)
 20                                                                         0.6                                                         25
                                                                                                                                        20
 10                                                                         0.4                                                         15
                                                                                                                                        10
  0                                                                         0.2                                                         5
                                                                                                                                        0
-10                                                                           0
                                                                                                                                        -5
                                                                           -0.2                                                         -10
-20                                                                                                                                     -15
                                                                           -0.4                                                         -20
-30
                                                                                                                                        -25
-40                                                                        -0.6                                                         -30
   Feb-19     Jun-19     Oct-19   Feb-20      Jun-20   Oct-20     Feb-21       1999 2002 2005 2008 2011 2014 2017 2020
                  Seasonally Adjusted                    Trend                      ABS % p.m. trend (LHS)         NAB trend net bal. (RHS)

CHART 27: EMPLOYMENT BY INDUSTRY                                           CHART 28: LABOUR COSTS GROWTH
 30                                                                         3.0                                                           5.0
 20                                                                                                                                       4.5
                                                                            2.0                                                           4.0
 10                                                                                                                                       3.5
                                                                            1.0
  0                                                                                                                                       3.0
-10                                                                         0.0                                                           2.5
                                                                                                                                          2.0
-20                                                                        -1.0                                                           1.5
-30                                                                                                                                       1.0
                                                                           -2.0
-40                                                                                                                                       0.5
   Feb-19     Jun-19     Oct-19   Feb-20      Jun-20   Oct-20     Feb-21   -3.0                                                           0.0
            Mining                Manuf                  Constn               Mar-97 Apr-01 May-05 Jun-09          Jul-13   Aug-17
            Retail                Wsale                  Transp                      Labour Costs (NAB Survey, lhs)
            Fin, bus, prop        Rec, pers                                          ABS Private Wage Price Index (y/y % change, RHS)

CHART 29: COSTS AND PRICES (% CHANGE AT A QUARTERLY RATE)                  CHART 30: RETAIL PRICES (% CHANGE AT A QUARTERLY RATE)
 1.5                                                                        1.5
 1.0
 0.5                                                                        1.0
 0.0
                                                                            0.5
-0.5
-1.0
                                                                            0.0
-1.5
-2.0                                                                       -0.5
-2.5
-3.0                                                                       -1.0
    Feb-18 Aug-18 Feb-19 Aug-19 Feb-20 Aug-20 Feb-21                           Feb-18 Aug-18 Feb-19 Aug-19 Feb-20 Aug-20 Feb-21
            Labour           Product Price             Purchase Costs                                    Retail Prices

                                                                                                                                     Page | 6
CONTACTS
Alan Oster, Group Chief Economist
Alan.Oster@nab.com.au
+61 0 414 444 652

Gareth Spence, Senior Economist
gareth.spence@nab.com.au
+61 0 436 606 175

Kaixin Owyong, Senior Economist
Kaixin.Owyong@nab.com.au
+61 0 436 679 908

Important Notice
This document has been prepared by National Australia Bank Limited ABN 12 004 044 937 AFSL 230686 ("NAB"). Any
advice contained in this document has been prepared without taking into account your objectives, financial situation
or needs. Before acting on any advice in this document, NAB recommends that you consider whether the advice is
appropriate for your circumstances.
NAB recommends that you obtain and consider the relevant Product Disclosure Statement or other disclosure
document, before making any decision about a product including whether to acquire or to continue to hold it.
Please click here to view our disclaimer and terms of use.

                                                                                                             Page | 7
APPENDIX: LIST OF SERIES AVAILABLE TO SUBSCRIBERS^
MONTHLY BUSINESS SURVEY*
  Business Confidence                         Net balance
  Business Conditions                         Net balance
  Trading Conditions                          Net balance
  Profitability                               Net balance
  Employment                                  Net balance
  Forward Orders                              Net balance
  Stocks                                      Net balance
  Exports                                     Net balance
  Capital Expenditure (Capex)                 Net balance
  Cash Flow                                   Net balance
  Labour Costs                                % change at quarterly rate
  Purchase Costs                              % change at quarterly rate
  Final Prices                                % change at quarterly rate
  Capacity Utilisation                        Per cent
  Borrowing Demand & Conditions               %; net balance
  All series available on an industry basis for:
  Mining
  Manufacturing
  Construction
  Retail trade
  Wholesale trade
  Transport / Utilities
  Finance / Property / Business Services
  Recreation / Personal Services

  All available on a state basis for:
  New South Wales
  Victoria
  Queensland
  WA
  SA/NT
  Tasmania

*All data available in original, seasonally adjusted and trend terms.

^Subscribers also receive a copy of the Subscriber details publication which contains a variety of extra charts and tables.

                                                                                                                        Page | 8
QUARTERLY BUSINESS SURVEY*
  Business Confidence                                                Margins (current, next 3 mth)
  Business Conditions (current, next 3 mth, next 12 mth)             Overheads (current, next 3 mth)
  Trading conditions (current, next 3 mth, next 12 mth)              Productivity growth
  Profitability (current, next 3 mth, next 12 mth)                   Number of employees
  Employment (current, next 3 mth, next 12 mth)                      Hours worked
  Forward orders (current, next 3 mth)                               Gross Sales
  Stocks (current, next 3 mth)                                       Output/sales growth (current fiscal year)
  Export orders (current, next 3 mth)                                Average earnings (current fiscal year)
  Capital expenditure (current, next 3 mth, next 12 mth, fiscal
  year)                                                              Short term interest rate
  Required rate of return on investment                              Exporters hedged FX exposure (%)
  Cash flow                                                          Importers hedged FX exposure (%)
  Labour costs (current, next 3 mth)                                 Months hedged (exporters)
  Purchase costs (current, next 3 mth)                               Months hedged (importers)
  Final prices (current, next 3 mth)                                 Favourable hedge position (% of exporters)
  Capacity Utilisation                                               Favourable hedge position (% of importers)
  Borrowing index (current, next 3 mth)                              Affected vs not affected by AUD
                                                                     Response to AUD (downsized, reduced, overheads,
                                                                     hedging, import substitution, focus on domestic market,
  Borrowing demand (current, next 3 mth)                             other, don’t’ know)
                                                                     Driver of trading conditions (demand, wages/jobs, house
  Constraints on output (demand, labour, materials, premises &       prices, rates, exchange rate, tax/govt policy, seasonal,
  plant, finance/working capital)                                    finance/working capital, company specific, other)
                                                                     What will improve confidence (lower rates, more suitable
                                                                     labour, easier funding, government policy, higher
  Constraints on profit (capital, demand, high AUD, low AUD,         demand, higher AUD, lower AUD, easier compliance,
  interest rates, labour, tax, wages, energy costs, other)           other)
  Constraint on employment (demand, confidence, cashflow,
  suitable labour, high wages, government policy, labour not at
  full capacity, other, don’t’ know)
  All series available on an industry basis for:
  Mining (sub-groups: Mining Extraction, Mining Services)
  Manufacturing (sub-groups: food beverage & tobacco, textile clothing footwear & leather, wood & paper product, printing
  publishing & recorded media, petroleum coal chemical & associated products, non-metallic mineral product, metal product,
  machinery & equipment, other)
  Construction (sub-groups: Residential Building, Non-residential Building, Other Construction, Construction Services)
  Retail trade (sub-groups: Food, Personal & Household Goods, Motor Vehicle Retailing & Services, Other Retail)
  Wholesale trade
  Transport / Utilities
  Finance / Property / Business Services (sub-groups: Finance, Insurance, Services to Finance & Insurance, Property Services,
  Business Services)
  Recreation / Personal Services (Sub-groups: Motion picture, Radio & Television Services, Libraries Museums & the Arts), Sports
  & Recreation, Personal Services, Accommodation Cafes & Restaurants, Health Services, Education, Other Services)
  All series available on a state basis for:
  New South Wales
  Victoria
  Queensland,
  WA
  SA/NT
  Tasmania
*Data available in original, seasonally adjusted and trend terms.

                                                                                                                          Page | 9
NAB SPECIAL INSIGHT REPORT
LIFE IN THE ‘LUCKY COUNTRY’ 2021: IS AUSTRALIA STILL A GREAT
PLACE TO LIVE, WHAT MAKES IT GREAT & WHAT OF THE FUTURE?

EXECUTIVE SUMMARY:
AUSTRALIA: A GREAT PLACE TO LIVE NOW

        AUSTRALIA - A GREAT PLACE TO LIVE NOW?

AUSTRALIANS WHO BELIEVE AUSTRALIA IS A GREAT PLACE TO LIVE NOW
…
WHAT MAKES AUSTRALIA A GREAT PLACE TO LIVE   HOW HAVE PERCEPTIONS OF AUSTRALIA CHANGED
                 2021                                    SINCE LAST YEAR?
AUSTRALIA: A GREAT PLACE TO LIVE IN NEXT 10 YRS   AUSTRALIA - A GREAT PLACE TO LIVE IN NEXT 10 YRS

AUSTRALIANS WHO BELIEVE AUSTRALIA WILL STILL BE A GREAT PLACE TO LIVE IN 10 YEARS’ TIME
…

             WILL IT GET BETTER OR WORSE IN THE NEXT 10 YEARS?

*net balance (improve/deteriorate) e.g. 32% expect economy to improve; 21% to deteriorate so
on balance +11% expect things to improve (i.e. optimists outweigh pessimists).

         HOW PERCEPTIONS HAVE CHANGED SINCE LAST YEAR (NET*)
…

DOES AUSTRALIA HAVE A CLEAR SHARED VISION FOR WHERE   DO YOU BELIEVE YOU HAVE A VOICE IN SHAPING WHERE
     WE'RE HEADED AS A NATION IN 10 YEARS TIME?        AUSTRALIA HEADED AS A NATION IN 10 YEARS TIME?
APPENDIX 1
WHAT MAKES AUSTRALIA A GREAT PLACE TO LIVE 2021:
TOP 10 BY STATE/TERRITORY

    WHAT MAKES AUSTRALIA A GREAT PLACE TO LIVE   WHAT MAKES AUSTRALIA A GREAT PLACE TO LIVE   WHAT MAKES AUSTRALIA A GREAT PLACE TO LIVE
                2021: TOP 15 NSW                             2021: TOP 15 ACT                              2021: TOP 15 VIC

   WHAT MAKES AUSTRALIA A GREAT PLACE TO LIVE    WHAT MAKES AUSTRALIA A GREAT PLACE TO LIVE   WHAT MAKES AUSTRALIA A GREAT PLACE TO LIVE
               2021: TOP 15 QLD                               2021: TOP 15 SA                              2021: TOP 15 NT

   WHAT MAKES AUSTRALIA A GREAT PLACE TO LIVE    WHAT MAKES AUSTRALIA A GREAT PLACE TO LIVE
                2021: TOP 15 WA                              2021: TOP 15 TAS
APPENDIX 2
WILL LIVEABILITY FACTORS IMPROVE OR DETERIORATE IN THE NEXT 10 YEARS?
BY STATE/TERRITORY?
   IMPROVE/DETERIORATE IN NEXT 10 YRS (NET): NSW    IMPROVE/DETERIORATE IN NEXT 10 YRS (NET): ACT   IMPROVE/DETERIORATE IN NEXT 10 YRS (NET): VIC

    IMPROVE/DETERIORATE IN NEXT 10 YRS (NET): QLD   IMPROVE/DETERIORATE IN NEXT 10 YRS (NET): SA    IMPROVE/DETERIORATE IN NEXT 10 YRS (NET): NT

    IMPROVE/DETERIORATE IN NEXT 10 YRS (NET): WA    IMPROVE/DETERIORATE IN NEXT 10 YRS (NET): TAS
CONTACT THE AUTHORS
You can also read