ESO Forward Plan 2019-21 - 22 January 2019 - National Grid ESO
←
→
Page content transcription
If your browser does not render page correctly, please read the page content below

ESO Forward Plan 2019-21

              22 January 2019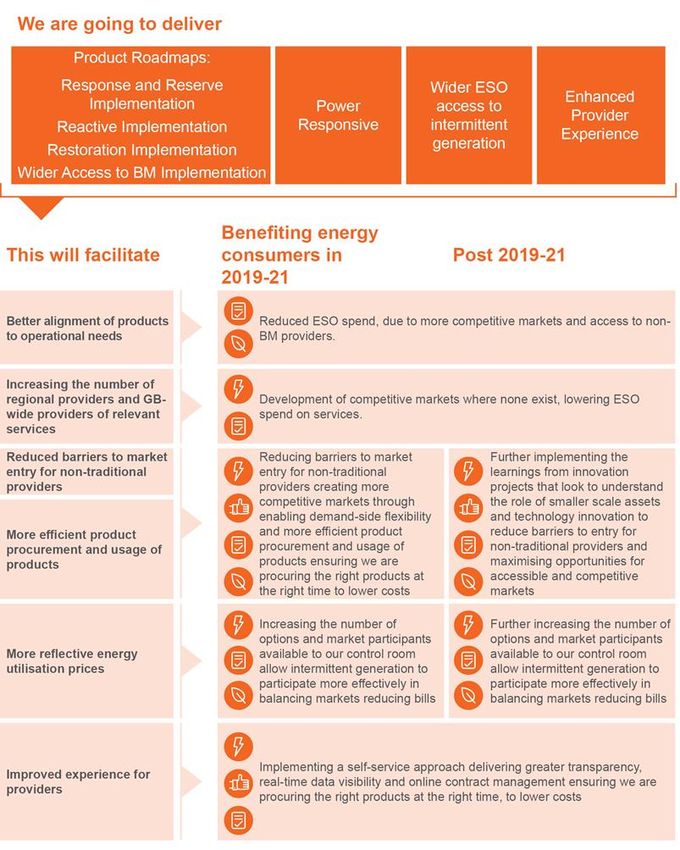
ESO Forward
 Plan 2019-21

Fintan Slye
Head of UK System Operator

Kayte O’Neill
Head of Strategy & Regulation
Housekeeping & Agenda

           Break - 11.15-11.30   Lunch - 13.10
3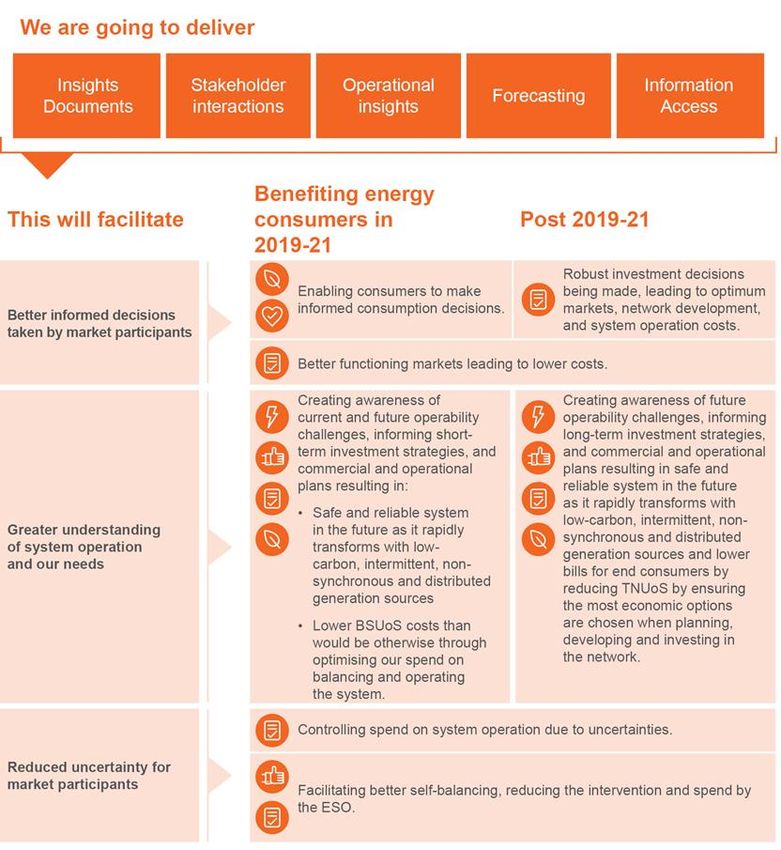
Our Forward Plan

           ESO Forward Plan                  ESO Draft Forward
              2018-2019                       Plan 2019-2021

                              Long Term Vision

                   Plan of work and our plan to deliver
                      consumer benefit in 2019-21

                          Performance metrics

                   Stakeholder engagement approach
4
Our SO Mission focuses us on delivering value

We keep the lights on and the gas flowing round the clock for GB energy
consumers; we play an essential role in enabling the transition to a more
sustainable energy future.

Therefore we believe that:
•   We deliver value for consumers first and foremost, while also ensuring that we build and
    maintain trusted partnerships with our customers and stakeholders
•   We influence the energy debate positively with our independent perspective
•   Through using markets, data and networks in new ways across gas and electricity, we
    help move GB towards a more reliable, affordable and sustainable energy world
•   An incentivised for-profit model ensures we deliver the best long-term outcomes for
    consumers, society and the GB economy

5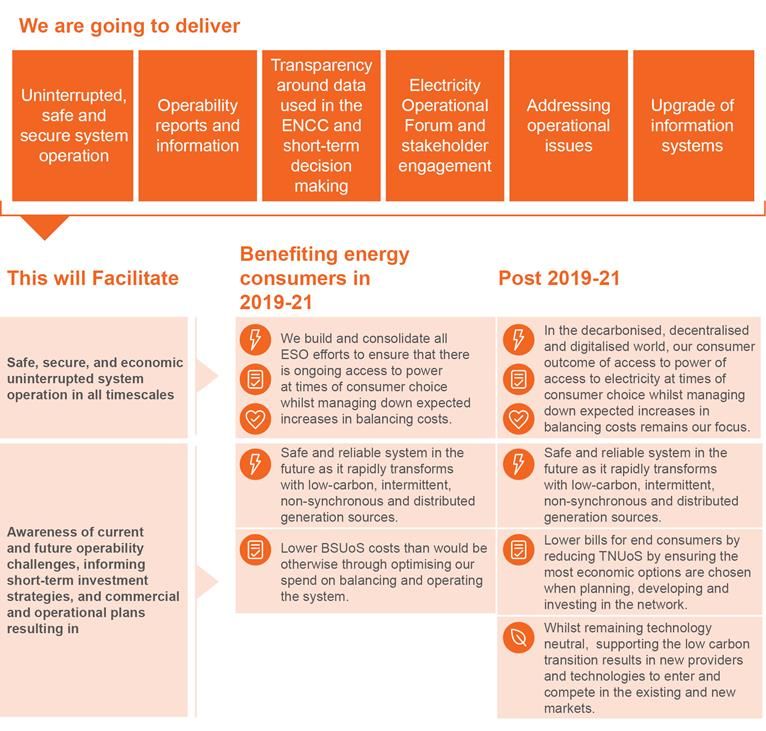
Delivering consumer benefit

    Improved safety               Lower Bills              Improved               Benefits for             Reduced
      & reliability                                        Quality of          Society as a whole        Environmental
                                                            Service                                        Damage

                                    Average electricity customer’s year bill
                                                2017/18: £577
   6

Source: March 2018 estimated network costs via https://www.ofgem.gov.uk/data-portal/network-indicators
Our four ESO roles

                                              Richard Smith, Head of Commercial
                                              Ro Quinn, Head of National Control

                                   #1
                                Managing
                                 system
                              balancing and
                               operability

                   #3
               Facilitating
                                                    #2
                                                Facilitating
                  whole
                                                competitive
                 system
                                                 markets
               outcomes

                                   #4
                               Supporting                  Cathy McClay,
       Julian Leslie,          competition
    Head of Networks                                       Head of Future Markets
                               in networks

7
Delivering exceeding outcomes in 2019-21
    Operations

      Uninterrupted, safe   Managing system        Operability       Energy          Data
      and secure system     balancing costs         reports        forecasting      portal
          operation

    Markets

         Reforms of           Wider access to     Thought leadership on     Transform industry
     balancing services           the BM            electricity network        frameworks
                                                         charging

    Networks

        Commercial contracts        Whole electricity   Whole system data       Pathfinder
        and enhanced systems        system thought        exchange &         projects & study
         to facilitate balancing      leadership           operability            tools
8          services from DER
Shaping our plan: next steps

                          Final Forward Plan
                         2019-21 & ESO RIIO2
       Consultation       Ambition Published                      2019-20 Monthly
          Close                                                       Report

         14th                                                         22nd

        February          March            April                    May

             21st          21st                             7th

            2018-19        2018-19                     2018-19 ESO
         Monthly Report Monthly Report                  End of Year
                                                          Report

                                         Legal Separation

9
Role #1: Managing
system balancing
and operability

Richard Smith
Head of Commercial

Ro Quinn
Head of National Control
Our Long Term Vision

                 Principle 1                Principle 2
                 Support market             Drive overall efficiency
                 participants to make       and transparency in
                 informed decisions by      balancing services, taking
                 providing user friendly,   into account impacts of
                 comprehensive and          ESO actions across time
                 accurate information       horizons

11
Principle 1: Support market participants to make informed decisions by providing user friendly, comprehensive and accurate information 12
Principle 1 Deliverables
Ref    Deliverable                                 Delivery Date                                     Meeting or exceeding    Delivering
                                                                                                     baseline expectations   Consumer
                                                                                                                             Benefit
1.1    Summer Outlook                              Q1 2019-20 & 2020-21                              Meeting baseline
1.2    FES                                         Q2 2019-20 to Q3 2020-21                          Meeting baseline

1.3    Winter Outlook and Winter Review and        Q1 2019-20 to Q3 2020-21                          Meeting baseline
       consultation

1.4    Electricity Operational Forum               Q2, Q3 and Q4 2019-20 and 2020-21                 Meeting baseline

1.5    Electricity National Control Centre (ENCC) Bi-monthly open door visits in Q1, Q2, Q3, Q4      Meeting baseline
       visit days                                 2019-20 and 2020-21

1.6    Insight on balancing decisions taken        Costs for thermal constraints: Q2 2019-20.Costs   Exceeding baseline
                                                   for voltage constraints: Q3 2019-20.

1.7    Insight on constraint boundaries            Q2 2019-20                                        Exceeding baseline
1.8    Publish Forecasting Strategy Project        Q1 2019-20                                        Exceeding baseline
       roadmap
1.9    Publish half-hourly photovoltaic (PV)       Q1 2019-20                                        Exceeding baseline
       forecasts to market, 24 times a day
1.10   Publish four additional wind forecasts to   Q2 2019-20                                        Exceeding baseline
       the market
1.11   Publish an additional Day-Ahead demand Q2 2019-20                                             Exceeding baseline
       update at 12:00pm every day
1.12   Make energy forecasts more accessible via Q3 2019-20                                          Exceeding baseline
       a dedicated website and Applications
       Programming Interfaces (APIs)
1.13   Open Data                                 Data explorer page on website: Q1 2019-20           Exceeding baseline

                                                   New data portal: Q3 2019-20                       Exceeding baseline

13
Principle 1 Metrics Metric 1 - Information provision scorecard We publish data and information to the market on a regular basis; some required by our licence or code obligations and others as our commitments to the market. We will use a scorecard to summarise the information provision per quarter to show that we are continuing to provide the information needed by the market. This will include: Metric 2 – Firm Frequency Response (FFR) information provision improvement metric During this year, our performance has improved from more than 70% of tenders received being for periods when we have no requirement to less than 50% of the tenders being for periods when we have no requirement. To measure this outcome, we will measure the percentage of dynamic tenders that are submitted for periods when we do not have a requirement. Performance Benchmarks Exceeds benchmark: Less than 40% In line with benchmark: Between 40-50% Below benchmark: Greater than 50% Metric 3 – Energy forecasting accuracy metric To measure our performance, we will use the monthly forecasting accuracy of our day ahead demand forecast and day ahead Balancing Mechanism Unit (BMU) wind forecast. To do this, we will use the following steps: • Create the monthly and seasonal targets based on the average forecasting error over the past three financial years. • Compare each monthly forecasting accuracy with the predefined target to identify whether we have achieved our target for the month. • Count the number of months where we have met the target and compare it to a pre-set scale defining the success criteria. Managing and forecasting the electricity system is becoming more and more difficult. This is mainly due to the growth of distribution connected generation, change in customers’ behaviours and additional penetration of technologies such as batteries and smart meters. For this reason, we believe that, in order to achieve an annual performance in line with expectations, the metric should deliver at least five months with improved forecasting accuracy compared to the same months over the last three financial years. This means that during the year we would have improved forecasting accuracy for at least 5 out of 12 months. At the same time, we strive to improve our forecasting accuracy across the whole year to provide added value to market participants and consumers. Performance Benchmarks Exceeds benchmark: 8-12 months In line with benchmark: 5-7 months Below benchmark:0-4 months 14
Principle 2: Drive overall efficiency and transparency in balancing services, taking into
account impacts of ESO actions across time horizons

15
Forward Plan Deliverables for 19/20 - Principle 2
                                                                                          Meeting or
                                                                                          Exceeding    Delivery   Delivering
     Activities                            Deliverables                                   Baseline     Date       Consumer Benefit

1    Uninterrupted safe, secure system     Security Metrics                               Meeting
     operation

2    Operability reports and information   Operability Strategy report and updates        Exceeding    Q1 & Q3
                                                                                                       19/20

3    Transparency around our data used     Publication of operational planning data       Exceeding    Q1 19/20
     in our ENCC and close-to-real-time
     decision making                       Future of the ENCC                             Exceeding    Q1 19/20

4    Electricity Operational Forum and     Electricity Operational Forum                  Meeting
     Stakeholder engagement

5    Addressing operational issues         Rollout of loss of Main Protection Settings,   Exceeding    19/20
                                           including procurement methodology, tender
                                           rounds, reviewing methodology

6    Upgrade Information Systems           Frequency and Time Equipment                   Meeting      Q4 19/20

                                           Ancillary services dispatch platform (ADSP)    Meeting      Q2 19/20

                                           European Network Codes                         Exceeding    Q3 19/20

                                           Pi gateway refresh (Scottish Tos)              Meeting      Q4 19/20

7    Balancing Cost Management             Balancing Metric

16
Forward Plan Metric for 2019/20 – Principle 2
Benchmark Adjustments
A new simple benchmark for In recognition that there are a number of foreseeable fundamental drivers that might impact balancing costs but
expected balancing costs will be which historical costs might not reflect, we will also include additional adjustments. The adjustments for these
derived from the application of a foreseeable fundamental drivers this year are:
linear trend through five year
moving averages of historic HVDC availability South East reinforcement work
balancing cost (excluding Black
Start), beginning with the rolling Availability of the Western HVDC Link will continue to have We anticipate higher costs in operating the system caused
mean for 2009-2013 to 2013-17. a downward impact on the rolling average, reducing the by the unavailability of transmission assets in the South East
constraint spend we would anticipate for managing flows of the network. This will be for 12 weeks and is to deliver
We intend to use historical data to from Scotland into England. reinforcements recommended by the Network Options
develop a baseline of costs. By Assessment (NOA) process.
applying a historical dataset that We forecast a reduction in balancing spend of
intrinsically reflects a broad range £136.4m We forecast an increased balancing spend of
of operational situations we can £60m to manage transmission network flows
capture a sufficient number of during this work.
observations that the System
Operator has encountered to RoCoF and Vector Shift Other Drivers
establish a baseline for costs.
A programme of work is planned to start in 2019-20 to Scottish Security – additional cost to manager generator
change the settings of existing RoCoF relays and replace outages in Scotland
The historical data Vector Shift relays
produces a benchmark for Capacity Market Suspension could increase balancing costs
We forecast an increased balancing spend of where margins are short
2019-20 of £1018.7m £100m and £10m for direct payments to
generators to change their settings
Overall Benchmark
for 2019-20
£1052.3m
17Shape our Forward Plan #FPr1 https://www.sli.do/
Role #2:
Facilitating
competitive
markets
Cathy McClay
Head of Future Markets
Our Long Term Vision

                 Principle 3                    Principle 4
                 Ensure the rules and           Promote competition in
                 processes for procuring        the wholesale and
                 balancing services             capacity markets
                 maximises competition
                 where possible and are
                 simple, fair and transparent

20
Principle 3: Ensure the rules and processes for procuring balancing services maximises competition where possible and are simple, fair and transparent 21
Principle 3 Deliverables
Ref    Deliverable                                                          Delivery Date      Meeting or exceeding    Delivering
                                                                                               baseline expectations   consumer
                                                                                                                       benefits
3.1    Rollout of full functionality in frequency response auction trial    Q2 2019-20         Exceeding baseline
3.2    Report on development of new frequency response product suite        Q4 2020-21         Exceeding baseline

3.3    Report on auction trial                                              Q1 2021-21         Exceeding baseline
3.4    Market design for reformed reserve products                          Q4 2019-20         Exceeding baseline
3.5    Report on our plan for retaining standard products                   Q1 2019-20         Meeting baseline

3.6    Start migration of non-BM Short-Term Operating Reserve (STOR)        Q2 2019-20         Meeting baseline
       providers to ASDP
3.7    Implementation of Pan-European replacement reserve standard          Throughout 2019-   Meeting baseline
       products                                                             21
3.8    Communicate reactive power requirements & historic spend             Q2 2019-20         Exceeding baseline
3.9    Implement approach for efficient reactive power flows between        Q2 2020-21         Exceeding baseline
       networks
3.10   Work with industry to determine future role for reactive power and   Q4 2018-19 – Q2    Exceeding baseline
       design more competitive reactive power services                      2020-21
3.11   Commence implementation plan to enable rollout new approach to       Q3 2020-21         Exceeding baseline
       competitive reactive power services

3.12   Power Potential trial with UK Power Networks (UKPN)                  Q2 – Q4 2019-20    Exceeding baseline
3.13   Review learning from Power Potential                                 Q4 2019-20         Meeting baseline
3.14   Alternative Approaches to Restoration                                Q1 2019-20         Exceeding baseline
3.15   Develop and evolve a market approach for the procurement of Black    Q4 2019-20         Exceeding baseline
       Start services

22
Principle 3 Deliverables
Ref Deliverable Delivery Date Meeting or Delivering
exceeding baseline Consumer Benefit
expectations
3.16 Deliver innovation projects to unlock demand flexibility Q1-Q4 2019-20 Exceeding baseline
3.17 Power Responsive Stakeholder Engagement Q1 2019-20 – Q4 Meeting baseline
2020-21
3.18 Clearer accession requirements for BM participation and enable Q1 2019-20 Meeting baseline
aggregated BMU participation in balancing services
3.19 Use better technology/systems to improve efficiency of installing Delivery Meeting baseline
communications with BM providers and optimising BMU dispatch throughout 2019-
20
3.20 Support industry work on providing and delivering against Physical Q3 2019-20 Meeting baseline
Notifications (ELEXON led) and also support on work on accurate
settlement for behind the meter
3.21 Raise code modification to apply Power Available consistently across Q1 2019-20 Meeting baseline
technical & commercial codes
3.22 Publish Power Park Module signal best practice guide Q2 2019-20 Exceeding baseline
3.23 Deliver Power Available integration phase 1 Q3 2019-20 Exceeding baseline
3.24 Publish wider strategy on flexibility from intermittent generation Q4 2019-20 Exceeding baseline
3.25 Deliver Power Available integration phase 2 Q1 2020-21 Exceeding baseline
3.26 Feedback approach Q1 2019-20 Meeting baseline
3.27 Improved online resources Q1 2019-20 Meeting baseline
23Principle 3 Metrics
Metric 5 - Provider Journey Feedback
Metric
Feedback score from the four key points identified in the provider journey:
1. Onboarding Survey Questions
1.1 I found it easy to find the information I needed?
1.2 I was provided with information of sufficient quality to enable me to make an informed decision?
1.3 What can we do to improve the accessibility of our information? (Free comments box)
Tendering
1.4 What type of participant are you?
1.5 I have the information I need to understand Firm Frequency Response tender results. On a scale of 1-5, with 1
for disagree and 5 for agree.
1.6 On a scale of 1-5, with 5 being the most useful how would you rate the usefulness of the Firm Frequency
Response results webinar?
1.6 What can we do to improve transparency of the Firm Frequency Response tender results?
Contracting
Query management
(Questions 1 & 2 are rated on a 5-point scales: strongly agree to strongly disagree)
Performance Benchmarks
Exceeds benchmark: average of 3.5/5 or above
In line with benchmark: average of 2.5 or above
Below benchmark: average less than 2.5
24Principle 3 Metrics Metric 6 - Reform of balancing services markets Metric Metric part one: This metric will measure how reforms are facilitating the entry of non-traditional providers into balancing markets. We will map service provider technology types against current services and the accessibility of these services has been categorised into three groups: • Red – significant barriers to entry with no solution implemented • Amber – interim solution implemented • Green – Interim solution implemented to enable commercial access Metric part two: This metric will measure the direction of travel away from bilateral arrangements, towards open and accessible market opportunities. We have attributed balancing spend to three categories that describe the openness of the procurement approach: • Commercial (bilateral) • Mandatory • Tendered On a quarterly basis information will be presented in a chart for each service that shows cumulative spend broken down into the three categories of procurement approach to provide supporting narrative on our progress. Performance Benchmarks Exceeds benchmark: Completing >75% of deliverables, and the shift in service accessibility, would constitute the metric exceeding the benchmark. In line with benchmark: Completing 50-75% deliverables, and the associated shift in service accessibility, would constitute the metric being inline with the benchmark. Below benchmark: Completing
Principle 4: Promote competition in the wholesale and capacity markets

26
Principle 4 Deliverables
Ref Deliverable Delivery Date Meeting or exceeding Delivering
baseline expectations Consumer Benefits
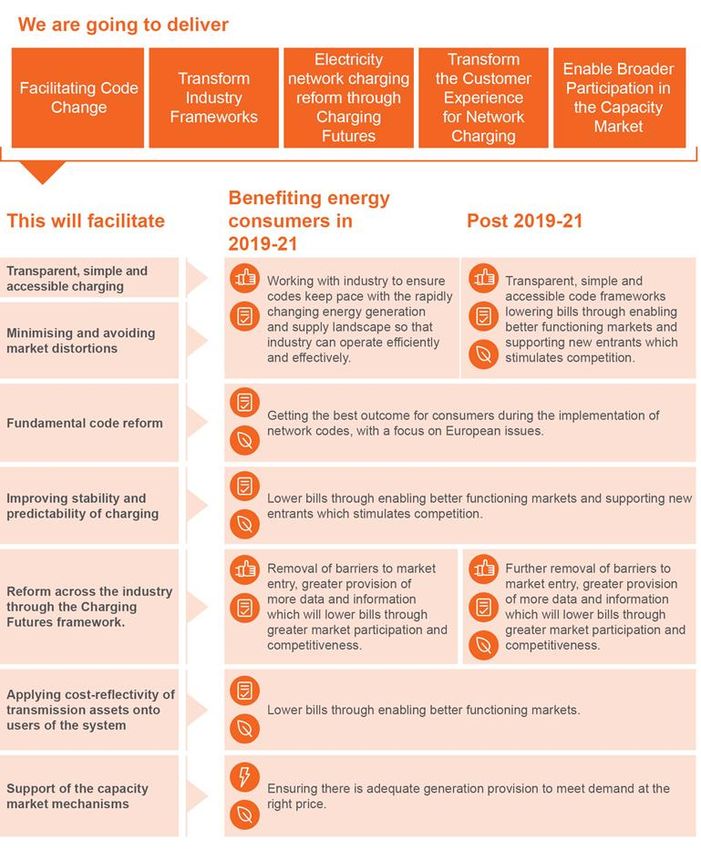
4.1 Meeting calendar & transparency of workgroups Q1 2019-20 Meeting baseline
4.2 Governance process FAQs, improved guidance material Q2 2019-20 Meeting baseline
and critical friend review
4.3 Facilitation of pre-modification discussions Q3 2019-20 Meeting baseline
4.4 Incorporation of all 14 Code Administrator Code of Practice Q3 2019-20 Meeting baseline
(CACoP) Principles
4.5 Engage all parties to understand information requirements Q1 2019-20 Meeting baseline
for code modifications and provide executive summaries
on modifications
4.6 Code administrator website Q3 2019-20 Meeting baseline
4.7 Governance surgeries Q2 2019-20 Exceeding baseline
4.8 Historical timelines & horizon scanning: cross-code Q2 2019-20 Exceeding baseline
4.9 Horizon scanning: strategic Q3 2019-20 Exceeding baseline
4.10 Stakeholder seminars Q4 2019-20 Exceeding Baseline
4.11 Leadership in the successful transformation of electricity Q2 2019-20 Exceeding baseline
access and charging
4.12 Leadership in the Energy Codes Review Q1 2019-20 Exceeding baseline
4.13 Working for you on European matters Q1 2019-20 Exceeding baseline
4.14 Unlocking whole system network development Q1 2019-20 Exceeding baseline
opportunities
4.15 Developing and driving targeted market improvements Q1 2019-20 Exceeding baseline
4.16 Facilitate electricity network charging reform through 2019-21 Exceeding baseline
Charging Futures
27Principle 4 Deliverables
Ref Deliverable Delivery Date Meeting or Delivering Consumer
exceeding baseline Benefits
expectations
4.17 Improve our ESO charging query processes Q1 2019-20 Meeting baseline
4.18 Improve understanding of our onboarding processes and 2019-20 Meeting baseline
streamline to meet our customer needs
4.19 New data reports for BSUoS Q1 2019-20 Exceeding baseline
4.20 Reform of website content in to a user-centric knowledge Q2 2019-20 Exceeding baseline
base
4.21 Publications and guidance of the impact of charging Ongoing from Q2 2019- Exceeding baseline
reform to our customers 20
4.22 Introduce new ‘new entrant’ e-learning on charging 2019-20 Exceeding baseline
4.23 Improve the digital customer experience for TNUoS, Q1 – Q4 2020-21 Exceeding baseline
BSUoS and Connection Charging Data; including the
introduction of a new NGESO billing system
4.24 Establish a ‘cross party’ approach to onboarding, mapping Q1 – Q4 2020-21 Exceeding baseline
out whole industry requirements
28Principle 4 Metrics Metric 7 - Code administrator: stakeholder satisfaction Metric We acknowledge that there is considerable effort required to successfully achieve the step change required in this area, so for 2019-20, we continue to target increased performance for each of our codes when benchmarked against our previous CACoP survey scores. Performance Benchmarks Exceeds benchmark: Increased overall performance across all of our three codes (STC/CUSC/Grid Code) in the 2020- 21 CACoP survey due to be carried out in spring 2020; benchmarked with our previous scores. In line with benchmark: no improvement in overall performance across all of our three codes (STC/CUSC/Grid Code) in the 2020-21 CACoP survey due to be carried out in spring 2020; benchmarked with our previous scores. Below benchmark: Decreased overall performance across all of our three codes (STC/CUSC/Grid Code) in the 2020- 21 CACoP survey due to be carried out in spring 2020; benchmarked with our previous scores. In addition to CACoP surveys, we will also seek feedback from our stakeholders through the use of surveys at set points in the year and following key deliverables such as the conclusion of workgroups. These survey’s will be able to target our stakeholders’ key expectations of the service we provide them and give continuous feedback for us to respond to and iterate on our improvements. Exceeds benchmark: Increased overall performance across all of our three codes (STC/CUSC/Grid Code); benchmarked with our previous scores. In line with benchmark: no improvement in overall performance across all of our three codes (STC/CUSC/Grid Code); benchmarked with our previous scores. Below benchmark: Decreased overall performance across all of our three codes (STC/CUSC/Grid Code); benchmarked with our previous scores. 29
Principle 4 Metrics
 Metric 8 - Charging Futures

 Metric
 Our success as lead secretariat should be judged against our ability to maintain the overall scores for these measures
 throughout the year. This will be calculated by periodically repeating the survey throughout the year and averaging these
 scores. These scores will then be compared against the initial baseline score .

 Performance Benchmarks
 Exceeds benchmark: Average scores from surveys undertaken throughout the year are higher than the baseline score.
 In line with benchmark: Average scores from surveys undertaken throughout the year equal the baseline score.
 Below benchmark: Engagement scores achieved throughout the year fall below the
 baseline score.

 As further evidence of the outcomes that we are achieving for Charging Futures members, we will supplement the primary
 survey measures through the continued collection of supporting metrics. Many of the secondary metrics will be determined
 through an assessment of the utilisation of the Charging Futures web portal (www.chargingfutures.com).

30
Principle 4 Metrics
 Metric 9 – Year ahead forecast vs outturn annual BSUoS

 Metric definition and targets
 This metric compares the BSUoS forecast made at the start of the financial year against outturn using the concept of an
 Absolute Percentage Error (APE)7.
 Exceeds benchmark: exceeding target is under 10%. APE.
 In line with benchmark: proposed baseline target is less than 20% APE.
 Below benchmark: underperforming greater than 20% APE.

 Performance can be driven by within year events so we won’t have a clear picture of the result until the end of the year. We
 therefore don’t expect to report on this measure on a monthly basis and introduce metric 9 at a monthly granularity.

 Metric 10 – Month ahead forecast vs outturn monthly BSUoS

 Metric
 The metric will count the occurrences of absolute percentage error (APE) for our monthly forecast with outturn data
 available at month end
 Performance Benchmarks
 Exceeds benchmark: Exceeding is meeting baseline performance and five or more forecasts less than 10% APE.
 In line with benchmark: Of the 12 forecasts over a financial year, baseline performance is less than five forecasts above
 20% APE.
 Below benchmark: five or more forecasts above 20% APE.

31
Shape our
Forward Plan

#FPr2

https://www.sli.do/
Roles #3:
Facilitating whole
system outcomes
& Role #4:
Supporting
competition in
networks

Julian Leslie
Head of Networks
Our Whole Electricity System Ambition

Our whole electricity system ambition is             The story so far:
that:                                                •   First two RDPs progressing through their
•    Planning, development, investment and               delivery phase
     operation of the GB networks will be            •   Two further RDPs well under way, with a
     optimised on a whole electricity system             fifth in early-stage development
     basis irrespective of ownership
     boundaries.                                     •   Increased engagement activity across
                                                         network users
•    Solutions to ESO challenges will be open
     to a full range of participants, facilitating   •   Regional WES solutions to transmission
     both market and asset solutions.                    needs being tested via NOA pathfinding
                                                         projects
•    Best overall value for consumers will
     be achieved, irrespective of the ESO or
     DSO performing the analysis.

34
Possible ‘Whole Electricity System’ end-state for
Network Investment, Planning & Operation
1 2 4 5 6
Invite Options Implementation
• Transmission
Planning & Operation
Network Transmission
Transmission
Recommendation
Capability Balancing
Asset Options • T Asset Build
Requirement Service Options
• Transmission • D Asset Build
Vs. • WES Smarter
Connection
Requests Distribution Grid Solutions
Distribution • WES Flexibility
• Distribution Flexibility
Asset Options Services
Connection Service Options
Impacts
3
CBA on Options
35Network Investment
Existing transmission approach to network Investment

                                                                                                                        Key:
                1                  2                                          4                    5                      Incremental
                                                 Invite Options

                                                                                  Recommendation
RIIO Baseline

                                                                                                       Implementation
                                                                                                                         improvements
                    Transmission

                    Requirement

                                                                                                                        through RIIO-T1
                      Capability
                       Network

                                                           Transmission
                                       Transmission Vs.                                                                  Currently out of
                                                             Balancing                                                     scope for T
                                       Asset Options
                                                          Service Options                                               FP deliverables to
                                                                                                                          address gaps
                                   3
                                                CBA on Options

                                       “Liaison with distribution licensees
                                         on possible distribution system
                                                    solutions”

        37
Towards a ‘Whole Electricity System’ approach to network Investment
Key:
1 2 4 5 Incremental
Invite Options
Recommendation
RIIO Baseline
Implementation
improvements
Transmission
Requirement
through RIIO-T1
Capability
Network
Transmission
Transmission Vs. Currently out of
Balancing scope for T
Asset Options
Service Options FP deliverables to
address gaps
3
CBA on Options
Enhanced network
modelling (P5) New terms for
Distribution DER Constraint
Exceeding
Distribution
Baseline
Enhanced needs Flexibility Management
Asset Options Service (P5)
assessment and Service Options
CBA modelling (P7)
New T/D Enhanced operational
Pathfinders for stability,
operational systems to access
voltage and thermal
interfaces (P5) DER services (P5)
constraint management (P7)
38Network Connection
Existing Transmission approach to network connection

                               2                                          4
                    DNO             NGESO/NGET assess                         Proceed      Key:
                                                              No Works
                  Connection       transmission impact per                     without       Incremental
RIIO Baseline

                                                               required                     improvements
                 Request per             connection          3             reinforcement   through RIIO-T1
                    DER                                                   5
                1                                               Works        Reinforce      Currently out of
                                       DNO wk24 data
                      T                                        Required     (£m; years)       scope for T

                  Connection            TO asset data                                      FP deliverables to
                                          GB model                                           address gaps
                   Request

        40
Towards a ‘Whole Electricity System’ approach to network connection
2 4
DNO NGESO/NGET assess Proceed Key:
No Works
Connection transmission impact per without Incremental
RIIO Baseline
required improvements
Request per connection 3 reinforcement through RIIO-T1
DER 5
1 Works Reinforce Currently out of
DNO wk24 data
T Required (£m; years) scope for T
Connection TO asset data FP deliverables to
GB model address gaps
Request
Commercial flexibility New process for identifying
around operational T Trigger RDP
potential RDPs (P5)
connections (P6)
WES Network Distribution
Exceeding
Baseline
Connections Data/Modelling and Flexibility
customer Proceed
Configuration Service
portal (P6)
Optimisation Options
New terms for DER Constraint
Management Service (P5)
New T/D operational Enhanced operational
interfaces (P5) systems to access
DER services (P5)
41Network Planning & Operation
Existing Transmission approach to network planning & operation

                                                                                 Key:
                1 Generation    2                3              5
                                                     Maintain    •   Wholesale     Incremental
RIIO Baseline

                 and Demand                          Energy          Market       improvements
                                      System         Balance
                                                                                 through RIIO-T1
                 Non Load-                                      •    BM
                                      Security   4                                Currently out of
                Related Works                        Maintain   •    Trades         scope for T
                                    Assessment
                 Load-Related                        System     •    Ancillary   FP deliverables to
                    Works                            Balance         Services      address gaps

        43
Towards a ‘Whole Electricity System’ approach to network planning &
operation
Key:
1 Generation 2 3 5
Maintain • Wholesale Incremental
RIIO Baseline
and Demand Energy Market improvements
System Balance
through RIIO-T1
Non Load- • BM
Security 4 Currently out of
Related Works Maintain • Trades scope for T
Assessment
Load-Related System • Ancillary FP deliverables to
Works Balance Services address gaps
New WES ways of working, driven
by decarbonisation and
Inertia
Exceeding
decentralisation
Baseline
measurement
(P6)
Roll-out of Loss of Defining roles and responsibilities
Mains Protection for voltage management across
Setting (P6) the transmission/distribution
interface (P6)
44Principle 5 Deliverables
Ref Deliverable Delivery Date Meeting or Delivering Consumer
exceeding baseline Benefit
expectations
5.1 Commercial contracts for balancing services from DER Q4 2019-20 Exceeding baselin
e
5.2 Enhanced systems to facilitate balancing services from DER Q2 2020/21 Exceeding
baseline
5.3 Automated dispatch capability for generation in highly constrained To be Exceeding
areas confirmed. baseline
5.4 RDP identification process Q3 2019-20 Exceeding baseline
45Principle 5 Metrics
Metric 11 - Whole system, unlocking cross-boundary solutions
Metric
Assessment of the performance will be on an ex-post basis, using:
1.The level of DER MW that have signed contracts to connect to the distribution networks; and
2.A narrative setting out how we have established the conditions under which these new connections have been made
possible.
The baseline date for each region is that when the conditions to facilitate further connections were established; as follows:
Region Date
South-East England 1st April 2019
South-West England 1st April 2019
This metric is designed as a measure of the effectiveness of the systems, contracts and processes we implement in 2019-
21, as measured by new capacity contracted at distribution level.
46Principle 6 Deliverables
Ref Deliverable Delivery Date Meeting or exceeding Delivering
baseline expectations Consumer Benefit
6.1 Extended roll out of enhanced whole system data Q2 2019-20 Meeting Baseline
exchange
6.2 Commercial flexibility around operational connections Q1 2019-20 Exceeding Baseline
6.3 Roll out of Loss of Mains Protection setting Commencing Q1 20 Exceeding Baseline
19-20
6.4 Defining roles and responsibility for voltage management Q3 2019-20 Exceeding Baseline
across the transmission-distribution interface
6.5 Inertia Measurement Q3 2019-20 Exceeding Baseline
6.6 Transmission Outage and Generator Availability (TOGA) Q4 2019-20 Meeting baseline
replacement
6.7 Customer journey mapping - outage planning Q1 2019-20 Meeting baseline
6.8 Connections customer portal Exceeding baseline
6.9 ESO thought leadership – how our role will evolve Q1 2019-20 Exceeding baseline
6.10 Whole Electricity System learnings paper Q2 2019-20, update Exceeding Baseline
Q2 202-/21
6.11 ENA Open Networks project 2019 ESO input Q3 2019-20 Meeting baseline
(although certain roles
may be exceeding)
6.12 Q1 2019-20 Exceeding baseline
ENA Open Networks project Whole Energy System lead
47Principle 6 Metrics Metric 12 - System access management Metric This metric looks to drive down the number of planned outages that are delayed by more than an hour or cancelled by us in the control phase due to process failure, investigating the reason for cancellations and putting in place changes into the process where appropriate to prevent a repeat. Sometimes we should cancel system access requests that have been accepted into the plan because these are no longer securable or the costs are too high. We will continue to cancel system access requests where needed; however this number should be as low as practical to avoid costs for external stakeholders and our costs in re-planning these requests. The tension between these two aspects is dynamic and so the ESO will work to reduce the number of control phase cancellations out of every 1,000 system access requests. This measure is a count of the number of outages out of every 1,000 delayed by more than an hour or cancelled within day. Performance benchmarks Current performance: 11.5 delays more than an hour or cancellations within day per 1,000 outages accepted into the master outage plan. Exceeds benchmark: Less than 10.4 per 1,000 outages (more than 10% reduction). In line with benchmark: 10.9 -10.4 per 1,000 outages (5-10% reduction). Below with benchmark: More than 10.9 per 1,000 outages (less than 5% reduction ). . 48
Principle 6 Metrics
 Metric 13 - Connections agreement management

 Metric
 This metric will measure how long it takes from the point of notification for these agreements to be updated. This metric
 drives efficient and effective management of existing connections contracts by measuring the percentage of contracts up to
 date within nine months.
 Performance benchmarks
 Current performance: = 86%.
 Exceeds benchmark: >90% of agreements to be updated within nine months of notification.
 In line with benchmark: 80-90% of agreements to be updated within nine months of notification.
 Below benchmark: < 80% of agreements to be updated within nine months of notification.

 Metric 14 - Right first time connection offers
 Metric
 To measure the quality of a customer’s connection offer we will use a right first time measure. The right first time metric will
 report all connection offers signed within a calendar month and identify if a ‘reoffer’ has been made (i.e. the offer was not
 right first time and needed rework) and what the root cause for the rework was. Any reoffers directly attributable to the ESO
 will impact the performance of the metric. Any rework driven by a TO or driven by a customer change to requirements
 during the process will be excluded from the metric performance but reported for information only.

 Performance benchmarks
 Current performance: = 94%.
 Exceeds benchmark: >95% of offers right first time.
 In line with benchmark: 95% of offers right first time.
 Below benchmark: < 95% of offers right first time.

49
Principle 7 Deliverables
Ref   Deliverable                                                   Delivery Date       Meeting or           Delivering Consumer
                                                                                        exceeding baseline   Benefits
                                                                                        expectations

7.1   Stability pathfinder                                          Q1 2019-20 to Q1    Exceeding baseline
                                                                    2020-21

7.2   South Wales and Mersey Voltage pathfinder                     Q1 to Q2 2019-20    Exceeding baseline
7.3   Pennines Voltage pathfinder                                   Q1 to Q2 2019-20    Exceeding baseline
7.4   Constraint Management Pathfinder                              Q2 to Q4 2019-20    Exceeding baseline
7.5   Voltage needs identification tools/ processes                 Q1 to Q3 2019-20    Exceeding baseline
7.6   Thermal probabilistic assessment tool / process               Q2 - Q3 2019-20     Exceeding baseline
7.7   Improve accessibility of the Electricity Ten Year Statement   Q1 2019-20 to on-   Meeting baseline
      (ETYS) and Network Development Assessment (NOA)               going
      publications

50
Principle 7 Metrics Metric 15 - NOA consumer benefit Metric This metric will count how many of the reduced-build options that have been submitted to the NOA process appear in the optimal path and, where this is the case, what their consumer value is. Further it will also include the number of non-TO solutions received for system needs assessed by a NOA style approach, and the consumer benefit these solutions deliver, where the need is not driven by network compliance. For clarity, we will only include reduced-build options that have been initiated by us as this will drive us to continue to be proactive in looking for these options. This metric will include two aspects: the number of reduced build options appearing in optimal paths and non-TO solutions, and the consumer value driven by these options. The number of options is expressed as a count and the consumer value will be based on £/kW saving for alternative options against traditional build options or against taking actions in the balancing mechanism. Performance Benchmarks Exceeds benchmark: Larger number of value-add options than target and consumer benefit greater than or equal to 10% in excess of target. In line with benchmark: Number of value-add alternative options meets target and consumer benefit within 10% of target. Below benchmark: Number of value-add alternative options below target and consumer benefit below 10% of target. 51
Shape our
Forward Plan

#FPr34

https://www.sli.do/
Preparing our Final Forward Plan

                             Final Forward Plan
                            2019-21 & ESO RIIO2
       Consultation          Ambition Published                    2019-20 Monthly
          Close                                                        Report

         14th                                                          22nd

        February               March           April                 May

                                   2019-2020 Incentives
                                    scheme goes live

                    Please send your consultation response to
                   box.soincentives.electricity@nationalgrid.com

                       Please give us feedback on today’s event:
                             #FP19-21 https://www.sli.do/
53
You can also read