Power Factor Improvement of Wind based DGs in the Distribution System Using (Fruit Fly and Cat Swarm) Optimization Techniques by Reducing the ...
←
→
Page content transcription
If your browser does not render page correctly, please read the page content below
Power Factor Improvement of Wind based DGs in the Distribution System Using
(Fruit Fly and Cat Swarm) Optimization Techniques by Reducing the Harmonics

                                   R. Sanjay Kumar1; Dr.N. Anbuselvan2*
 1
     Research Scholar, Department of Electrical and Electronics Engineering, Saveetha School of Engineering,
     Saveetha Institute of Medical and Technical Sciences, Saveetha University, Chennai, Tamil Nadu, India.
                                         1
                                           sanjaykumarr17@saveetha.com
     2*
        Project Guide, Department of Electrical and Electronics Engineering, Saveetha School of Engineering,
     Saveetha Institute of Medical and Technical Sciences, Saveetha University, Chennai, Tamil Nadu, India.
                                        2*
                                           anbuselvann.sse@saveetha.com

Abstract
Aim - This work involves a comparative analysis on two types of sizing algorithm to improve the
power factor in the distribution system by reducing the harmonics. Materials & Methods - Fruit fly
(FFA) and cat swarm (CSA) algorithm are implemented to analyze the power factor improvement
under varying insolation conditions. Results – Based on the results obtained, the Fruit fly algorithm
gives the innovative power factor of 0.89 with minimum power loss while the cat swarm algorithm
gives the power factor value of 0.81 with high power loss. Conclusion - Fruit fly algorithm provides
better power factor compared to cat swarm algorithm for the selected data set by Novel optimization
technique.

Key-words: Fruit Fly (FFA), Cat Swarm (CSA), Power Loss, Novel Optimization Technique,
Artificial Intelligence.

1. Introduction

           Distributed generation has become a promising alternative compensation of power in the
distribution system. The usage of DG source has increased rapidly in recent years (Alam, Zaheer, and
Zaid 2018). The main purpose of this research work is to improve the power factor by reducing the
harmonics. The Distributed generation (DG) system plays a vital role in recent applications such as
peak shaving, base-load power reduction, improving power quality and backup power provision
(Jazebi, Hosseinian, and Vahidi 2011).

ISSN: 2237-0722                                                                                            1070
Vol. 11 No. 4 (2021)
Received: 16.05.2021 – Accepted: 08.06.2021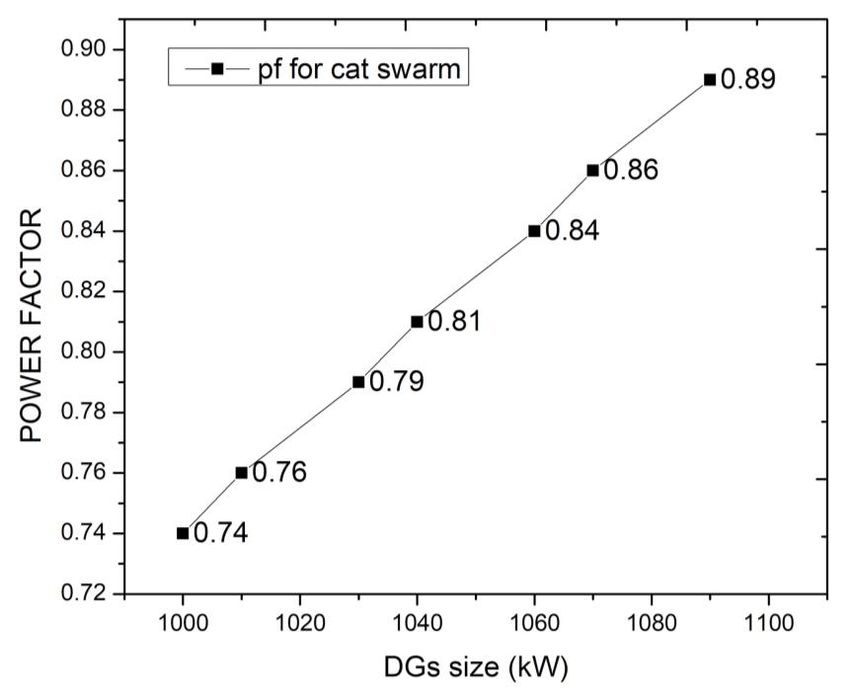
The different algorithms have been analysed and its performance and sizing has been enlisted
based on the DG system parameters (Mishra and Modi 2016). The power factor is improved by the
optimal size of DGs (Rambabu and Venkata Prasad 2014).The wind based DG and sizing approaches
for real power loss reduction and voltage stability improvement(Guan et al. 2017).Proper placement
of DGs in distribution system for maximum potential benefits (Kayal and Chanda 2013).
        Previously our team has a rich experience in working on various research projects across
multiple disciplines (Sathish and Karthick 2020; Varghese, Ramesh, and Veeraiyan 2019; S.R.
Samuel, Acharya, and Rao 2020; Venu, Raju, and Subramani 2019; M. S. Samuel et al. 2019; Venu,
Subramani, and Raju 2019; Mehta et al. 2019; Sharma et al. 2019; Malli Sureshbabu et al. 2019;
Krishnaswamy et al. 2020; Muthukrishnan et al. 2020; Gheena and Ezhilarasan 2019; Vignesh et al.
2019; Ke et al. 2019; Vijayakumar Jain et al. 2019; Jose, Ajitha, and Subbaiyan 2020). Now the
growing trend in this area motivated us to pursue this project.
        Improvement of power factor in the distribution system is a challenging factor under partial
shading due to the proper placing and sizing of DG. Various algorithms are used to improve the
power factor by reducing the harmonics. Some of the conventional algorithms are perturbing about
operational cost and high losses in the system. These methods do not efficiently improve the power
factor by reducing the harmonics. Hence an improved fruit fly method is used for optimal size of
Distributed Generation (DG). In this paper, a comparison of two sizing algorithms, fruit fly(FFA) and
cat swarm(CSA) algorithm is implemented and analyzed by Artificial Intelligence for optimal power
factor in DGs.

2. Materials and Methods

        The study was carried out in the Power Electronics laboratory at Saveetha School of
Engineering. Two algorithms have been compared and their sample size has been calculated using G
Power software and it is determined that each algorithm has 7 samples and a total of 14 sample tests
have been carried out (Bhattacharjee and Roy 2016). The incorporated G power parameter of 0.80,
and max error is fixed 0.5, mean group values 0.94 and 0.84 and standard deviation 0.07. The system
is simulated by using the Matlab code.

Distributed Generation (DG)

        The Distributed Generation (DG) is an on site generation used to inject the real and reactive
power in the distribution system to compensate the losses. DG provides significant benefits like

ISSN: 2237-0722                                                                                  1071
Vol. 11 No. 4 (2021)
Received: 16.05.2021 – Accepted: 08.06.2021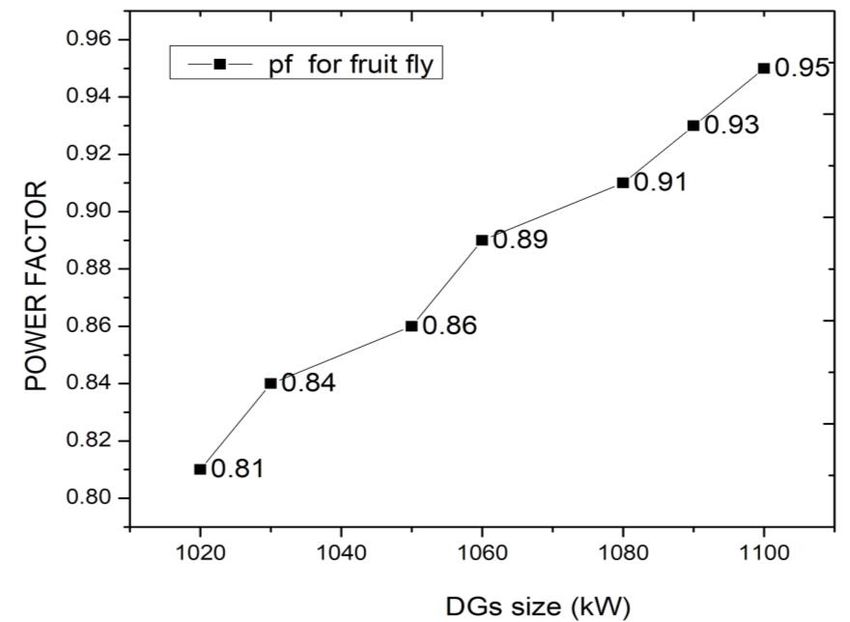
reduced energy loss during transmission and reduced load on utility transmission and distribution
lines. The Distributed Generation DG is generally modeled as PV or PQ nodes in power flow studies
for distribution system (Zevallos et al. 2021; Ramaprabha and Mathur 2008; Villalva, Gazoli, and
Filho 2009), a shunt resistance (1000 ohms) and a series resistance (0.02 ohms) (Kadir et al. 2011).
The design of DGs depends upon the power quality, dependent on type and size of DG along with
interfaces of various DG units, the total capacity of the DG is relative to the system, size of
generation is relative to a load at the interconnection point and feeder voltage regulation practice.

3. Power Factor Improvement Algorithm

Fruit Fly Algorithm

        The Fruit fly algorithm is a method of global optimization based on the food seeking
behaviour of the fruit fly. Fruit fly algorithm is relatively simple and fast. The steps involved in fruit
fly, initiating the parameter setting for upper and lower bound along initialize the original position of
x and y axis to calculate the size for DGs. Starting the main loop for the process of initializing (Das et
al. 2018). After calculating the size and placing the DGs the power factor is improved. The governing
fruit fly algorithm parameters are n=20; maxt=5e2; dim=30; lb=-100; ub=100; m=1000; pop=100;
g=10; percent=0.7; mpercent=0.5; The flow chart of Fruit fly algorithm is shown in Figure. 1

                                 Fig. 1 - Flow Chart of Fruit Fly Algorithm

ISSN: 2237-0722                                                                                         1072
Vol. 11 No. 4 (2021)
Received: 16.05.2021 – Accepted: 08.06.2021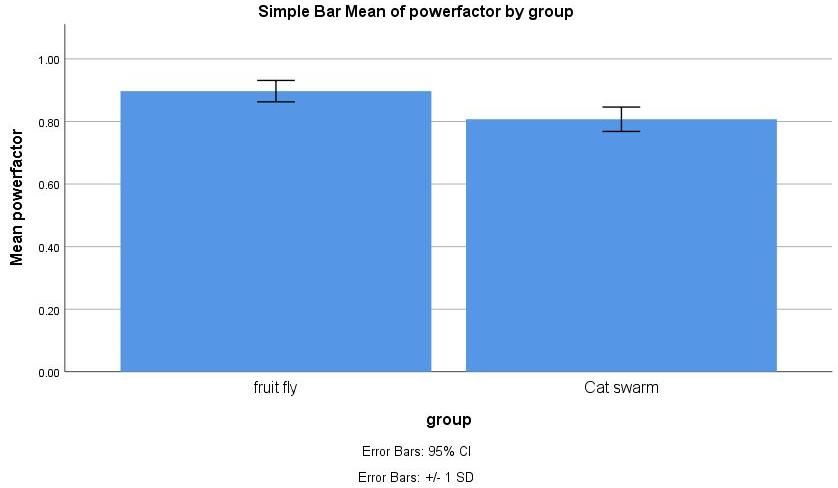
Cat Swarm Algorithm

        The Cat swarm optimization algorithm is an intelligence algorithm and has two modes of
operations seeking and tracing mode. Seeking memory pool is the number of copies generated for
each cat Seeking range of dimension is the pre-defined range of each dimension to be selected for
mutation. The optimal solution size is selected for a given problem among many alternative solutions.
(Ahmed, Rashid, and Saeed 2020). The maximizing the energy efficiency of a distribution system and
overall network performance (Das et al. 2018). The flow chart of cat swarm algorithms is shown in
Figure 2.

                                Fig. 2 - Flow Chart of Cat Swarm Algorithm

ISSN: 2237-0722                                                                                 1073
Vol. 11 No. 4 (2021)
Received: 16.05.2021 – Accepted: 08.06.2021
From the proposed fruit fly algorithm the power factor is improved in the distribution system.
The fruit fly algorithm is used to calculate the size of the DG. The reactive power loss is calculated
by summing up all losses in the line. Decelerating the optimization techniques and the limits of DG.
The voltage stability index calculates the voltage stability of each node. By determining the size of
DG the power loss is reduced. The DG placed in the system will inject the reactive power in the
distribution system so the transmission losses will be compensated.
For testing the proposed system the Matlab software version 13.0 is used and the results are
determined with different insolation set parameters. The results are validated by changing the input
size value of the Distributed generation (DG) so that there will be improvement in the obtained output
power factor. The obtained results for various inputs have been tabulated and it is calculated for both
the algorithms as on Table1 for total harmonic distribution (THD) of DGs (Kadir et al. 2011).
Using the SPSS statistical software for the independent variables THD of DGs and dependent
variables Distributed generation DGs size and power factor are analyzed.
4. Results
The Fruit fly and cat swarm algorithms for power factor improvement of DGs have been
implemented. From the Table 1 Simulated results of fruit fly and cat swarm algorithm for Distributed
Generation (DGs) for Size (KW) and Power factor at total Harmonic Distortion with THD = 3.1737
% is analysed.
Table 1 - Simulated Results of Fruit Fly and Cat Swarm Algorithm for Distributed Generation (DGs) Size (KW) and Power
Factor at constant Total Harmonic Distortion (THD)
Distributed Generation DGs THD = 3.1737 %
S. No SIZE(KW) SIZE (KW) POWER FACTOR POWER FACTOR
fruit fly cat swarm fruit fly cat swarm
1 1020 1000 0.95 0.89
2 1030 1010 0.93 0.86
3 1050 1030 0.91 0.84
4 1060 1040 0.89 0.81
5 1080 1060 0.86 0.79
6 1090 1070 0.84 0.76
7 1100 1090 0.81 0.74
ISSN: 2237-0722 1074
Vol. 11 No. 4 (2021)
Received: 16.05.2021 – Accepted: 08.06.2021Fig. 3 - Fruit Fly Algorithms Implemented for Power Factor Analysis with Respect to Various Sizes of DGs
Figure 3. shown Fruit fly algorithms implemented for power factor analysis with respect to
various sizes of DG, factor power is around 0.95 for the max size of 1100 size DGs. The output
power is increased along the optimal DGs size by harmonic variation controlled by simulation
parameters. With the DGs at respective voltage will duly cause in minimization of harmonic
distortions along the load distribution system.
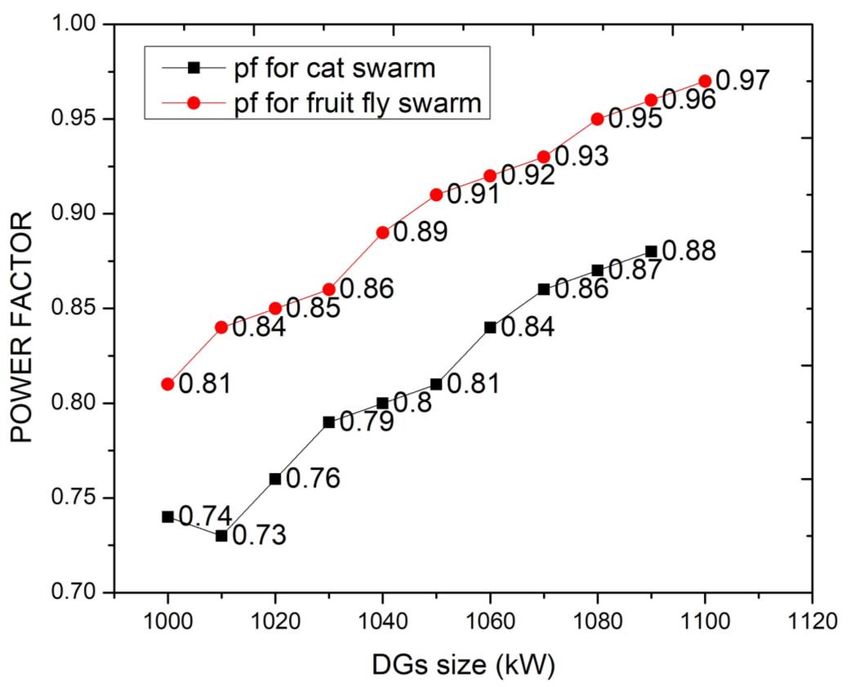
Fig. 4 - Cat Swarm Algorithms Implemented for Power Factor Analysis with Respect to various Sizes of DGs.
ISSN: 2237-0722 1075
Vol. 11 No. 4 (2021)
Received: 16.05.2021 – Accepted: 08.06.2021Figure.4 shown Cat swarm implemented for power factor analysis with respect to various size
of DGs, factor power is around the 0.89 for the max size of 1100 size DGs. Thereby power factor are
optimized along different DGs size between load range size (1020 -1110) KW, which duly to
resultant in variation of power factor level for low to high value.
Fig. 5 - Comparative analysis of both algorithms red line indicates the power factor range of fruit fly and black line
indicates power factor range of cat swarm
Figure. 5 shows a comparative analysis of fruit fly and cat swarm algorithms red line indicates
the power factor range of fruit fly algorithm and black line indicates the power factor range of cat
swarm algorithm between 0.81 to 0.97 with 0.74 to 0.88 respectively to various set size of DGs. The
size of the Distributed Generation (DG) to compensate for reactive power in the distribution system.
As a consequence of the resulting power factor slightly repetitive increase in sizing compared
between the Fruit fly algorithm and Cat swarm algorithm for different size of load in DGs. The fruit
fly algorithm is better in finding the sizing and improving the power factor compared to the cat
swarm algorithm.
ISSN: 2237-0722 1076
Vol. 11 No. 4 (2021)
Received: 16.05.2021 – Accepted: 08.06.2021Fig. 6 - Comparison of Fruit Fly and Cat swarm algorithm of mean efficiency The mean efficiency of Fruit Fly is better
than Cat swarm and the standard deviation of Fruit Fly is better than Cat swarm algorithm. X Axis: Fruit Fly vs Cat swarm
algorithm Y Axis: Mean power factor ± 1 SD
Figure 6. shows a comparative graph of Fruit Fly and Cat swarm algorithm comparison on
power factor improvement of computed Fruit Fly with Cat swarm. Fruit Fly produces better power
factor range of 0.85 to 0.89 compared to Cat swarm range about 0.80-0.86. But the standard deviation
range appears to be almost the same for both algorithms.
Independent t test analysis is carried out using the SPSS system and its mean and standard
deviation is analyzed for fruit fly and cat swarm algorithm for various sizes of DGs and power factor
is validated. From the Table 2 T-test Comparison of Fruit Fly and Cat swarm algorithm by varying
size between 1000 to 1100. Fruit Fly has a mean value of 0.8843 which is higher and Cat swarm
algorithm has lower mean value of 0.8129. The standard deviation of the fruit fly algorithm 0.01901
is lower compared to the cat swarm algorithm 0.02044.
Table 2 – Statistical analysis of comparison of Fruit Fly and Cat swarm algorithm of varying size DGs. Mean Output
voltage, Standard deviation and standard error values are obtained for 14 sample data sets. When compared, the fruit fly
algorithm has better performance than cat swarm algorithm.
Group Statistics
Group N Mean Std. Deviation Std. Error mean
Fruit fly 7 1061.4286 30.23716 11.42857
SIZE
Cat swarm 7 1042.8571 32.51373 12.28904
Fruit fly 7 0.8843 0.5028 0.1901
POWER FACTOR
Cat swarm 7 0.8129 0.5407 0.2044
ISSN: 2237-0722 1077
Vol. 11 No. 4 (2021)
Received: 16.05.2021 – Accepted: 08.06.2021Table 3 - Independent Sample T-test t is Performed for the Two Groups for Significance and Standard Error Determination
of Power Factor between Fruit Fly and Cat Swarm Algorithms. P value is Less than 0.05 and it is considered to be
Statistically Significant
Independent samples test
t-test for Equality of 95% confidence interval
Sig(2- means of the difference
F Sig t df
tailed) Mean Std. Error
Lower Upper
difference difference
Equal
variances 0.39 0.846 1.107 12 0.290 18.57143 16.76191 -17.99322 55.13508
assured
Size Equal
variances
1.107 11.937 0.290 18.57143 16.76191 -18.01453 55.15739
not
assured
Equal
variances 0.93 0.779 4.586 12 0.001 0.9986 0.1959 0.4717 0.13255
assured
Power
Equal
factor
variances
4.586 11.788 0.001 0.8986 0.1959 0.4708 0.13263
not
assured
Table. 3 Independent Samples Test: The independent sample test has been carried out and has
a significant difference in power factor between Fruit Fly and Cat swarm algorithms. There is a
significant difference between the two groups (t value is 12 and mean difference is 0.08986).
5. Discussions
Comparative analysis of Fruit Fly and Cat swarm algorithm on power factor improvement for
different sizes of DGs are analysed for the optimal configuration of DGs. The Resultant obtained by
the about used algorithms gives significant improvement in power factor compared to other resultant
data.
Earlier work addresses the optimal configuration of the distribution system resulting in
reduction of the power loss (57.5%) in the distribution system(Chao et al. 2016).some correlative
work also discusses the optimal allocation of DG in the distribution system to maximize the power
loss reduction about (88%) by maintaining a better node voltage profile.(Kanwar et al. 2015).
Moreover it also highlights the placement and sizing of DG by reducing the operational cost
reduction by improving the voltage stability(0.0284) (El-Ela et al. 2016) .Furthermore, this work
improves the voltage profile (293.34 KW) in the distribution system using cat swarm optimization
(Ali et al. 2021).
The multileader particle swarm algorithm is used to minimize the power loss (67.40 % and
80.32%) by integrating three DGs with unity power factor (Karunarathne et al. 2020). A differential
ISSN: 2237-0722 1078
Vol. 11 No. 4 (2021)
Received: 16.05.2021 – Accepted: 08.06.2021evolution algorithm (DEA) is used here in loss reduction (12.11%) and voltage profile improvement.
(Jazebi, Hosseinian, and Vahidi 2011).
From the existing literature survey, only a few articles verify that the particle swarm algorithm
(PSA)and Differential evolution algorithm (DEA) provides better power factor than Fruit fly
(FFA)and cat swarm algorithm (CSA). Though PSA and DEA provide better power factor they fail to
provide better output efficiency and power loss. so we can interfere so that the FFA can be applied to
the Distributed generation (DG) to get a better power factor in the distribution system. The Fruit Fly
has a mean value of 0.8843 which is higher and Cat swarm algorithm has lower mean value of
0.8129.the power factor range of Fruit fly and cat swarm algorithms between 0.81 to 0.97 with 0.74
to 0.88 respectively to various set size of DG.
As the power factor is higher due to the size and location of DGs at high voltage, thereby
owing to voltage distortion in the distribution in the distribution system, as a result current is lagging
with respect to voltage which in turn results in high power loss (IR2) thereby the efficiency of the
system is reduced. The high quality evidence based results of research in the field of DGs various
fields of load variation for power factor (Vijayashree Priyadharsini 2019; Ezhilarasan, Apoorva, and
Ashok Vardhan 2019; Ramesh et al. 2018; Mathew et al. 2020; Sridharan et al. 2019; Pc, Marimuthu,
and Devadoss 2018; Ramadurai et al. 2019)
Hence, to define the above limitation of power factor, it can be achieved in improving power
factor by addressing the dependent parameters of reduction of power losses in the distribution. which
in turn reduces load demand charges, by accumulating the load carry capabilities, the distribution
system with respect to load voltage.
6. Conclusion
Comparative analysis of Fruit Fly and Cat swarm algorithm on power factor improvement of
computed Fruit Fly with Cat swarm. The Fruit Fly produces better power factor range of 0.85 to 0.89
compared to Cat swarm range about 0.80-0.86. Implemented for power factor analysis with respect to
various sizes of DGs, factor power is around 0.89 and 0.94 for the max size of 1100 size DGs in cats
warm and fruit fly algorithm. But the standard deviation range emerges significantly the same value
for both algorithms. Based on the obtained results the Fruit Fly algorithm provides 89% efficiency
compared to the Cat swarm algorithm which results in 81% efficiency.
ISSN: 2237-0722 1079
Vol. 11 No. 4 (2021)
Received: 16.05.2021 – Accepted: 08.06.2021Declarations
Conflict of Interests
No conflict of Interest in this Manuscript.
Author Contributions
Author SKR was involved in data collection, data analysis, and manuscript writing. Author
AN was involved in data validation and review of manuscripts.
Acknowledgement
The authors would like to express their gratitude towards Saveetha School of Engineering,
Saveetha Institute of Medical and Technical Sciences (Formerly known as Saveetha University) for
providing the necessary infrastructure to carry out this work successfully.
Funding: We thank the following organizations for providing financial support that enabled
us to complete the study.
1. Innovative Engineering Solution Pvt Ltd,Chennai, India.
2. Saveetha University
3. Saveetha Institute of Medical and Technical Sciences
4. Saveetha School of Engineering
References
Ahmed, Aram M., Tarik A. Rashid, and Soran Ab M. Saeed. 2020. “Cat Swarm Optimization
Algorithm: A Survey and Performance Evaluation.” Computational Intelligence and Neuroscience
2020 (January): 4854895.
Alam, Afroz, Bushra Zaheer, and Mohammad Zaid. 2018. “Optimal Placement of DG in Distribution
System for Power Loss Minimization and Voltage Profile Improvement.” 2018 International
Conference on Computing, Power and Communication Technologies (GUCON).
https://doi.org/10.1109/gucon.2018.8674930.
Ali, Eman S., Ragab A. El-Sehiemy, Adel A. Abou El-Ela, Karar Mahmoud, Matti Lehtonen, and
Mohamed M.F. Darwish. 2021. “An Effective Bi-Stage Method for Renewable Energy Sources
Integration into Unbalanced Distribution Systems Considering Uncertainty.” Processes.
https://doi.org/10.3390/pr9030471.
ISSN: 2237-0722 1080
Vol. 11 No. 4 (2021)
Received: 16.05.2021 – Accepted: 08.06.2021Bhattacharjee, Chayan, and Binoy Krishna Roy. 2016. “Advanced Fuzzy Power Extraction Control of Wind Energy Conversion System for Power Quality Improvement in a Grid Tied Hybrid Generation System.” IET Generation, Transmission & Distribution. https://doi.org/10.1049/iet- gtd.2015.0769. Chao, Pan, School of Electrical Engineering, Northeast Dianli University, Jilin, China, Lv Jiahui, and Meng Tao. 2016. “Optimal Configuration of Distributed Generation Based on Improved Fruit Fly Optimization Algorithm.” International Journal of Smart Grid and Clean Energy. https://doi.org/10.12720/sgce.5.4.237-244. Das, Choton K., Octavian Bass, Ganesh Kothapalli, Thair S. Mahmoud, and Daryoush Habibi. 2018. “Overview of Energy Storage Systems in Distribution Networks: Placement, Sizing, Operation, and Power Quality.” Renewable and Sustainable Energy Reviews. https://doi.org/10.1016/j.rser.2018.03.068. El-Ela, Adel Ali Abou, Ragab A. El-Sehiemy, Abdel-Mohsen Kinawy, and Eman Salah Ali. 2016. “Optimal Placement and Sizing of Distributed Generation Units Using Different Cat Swarm Optimization Algorithms.” 2016 Eighteenth International Middle East Power Systems Conference (MEPCON). https://doi.org/10.1109/mepcon.2016.7837015. Ezhilarasan, Devaraj, Velluru S. Apoorva, and Nandhigam Ashok Vardhan. 2019. “Syzygium Cumini Extract Induced Reactive Oxygen Species-Mediated Apoptosis in Human Oral Squamous Carcinoma Cells.” Journal of Oral Pathology & Medicine: Official Publication of the International Association of Oral Pathologists and the American Academy of Oral Pathology 48 (2): 115–21. Gheena, S., and D. Ezhilarasan. 2019. “Syringic Acid Triggers Reactive Oxygen Species-Mediated Cytotoxicity in HepG2 Cells.” Human & Experimental Toxicology 38 (6): 694–702. Guan, Wanlin, Niao Guo, Chunlai Yu, Xiaoguang Chen, Haiyang Yu, Zhipeng Liu, and Jiapeng Cui. 2017. “Optimal Placement and Sizing of Wind / Solar Based DG Sources in Distribution System.” IOP Conference Series: Materials Science and Engineering. https://doi.org/10.1088/1757- 899x/207/1/012096. Jazebi, S., S.H. Hosseinian, and B. Vahidi. 2011. “DSTATCOM Allocation in Distribution Networks Considering Reconfiguration Using Differential Evolution Algorithm.” Energy Conversion and Management. https://doi.org/10.1016/j.enconman.2011.01.006. Jose, Jerry, Ajitha, and Haripriya Subbaiyan. 2020. “Different Treatment Modalities Followed by Dental Practitioners for Ellis Class 2 Fracture – A Questionnaire-Based Survey.” The Open Dentistry Journal 14 (1): 59–65. Kadir, A.F. Abdul, A.F. Abdul Kadir, A. Mohamed, and H. Shareef. 2011. “Harmonic Impact of Different Distributed Generation Units on Low Voltage Distribution System.” 2011 IEEE International Electric Machines & Drives Conference (IEMDC). https://doi.org/10.1109/iemdc.2011.5994774. Kanwar, Neeraj, Nikhil Gupta, K. R. Niazi, and Anil Swarnkar. 2015. “Improved Cat Swarm Optimization for Simultaneous Allocation of DSTATCOM and DGs in Distribution Systems.” Journal of Renewable Energy. https://doi.org/10.1155/2015/189080. Karunarathne, Eshan, Jagadeesh Pasupuleti, Janaka Ekanayake, and Dilini Almeida. 2020. “Optimal Placement and Sizing of DGs in Distribution Networks Using MLPSO Algorithm.” Energies. https://doi.org/10.3390/en13236185. ISSN: 2237-0722 1081 Vol. 11 No. 4 (2021) Received: 16.05.2021 – Accepted: 08.06.2021
Kayal, Partha, and C.K. Chanda. 2013. “Placement of Wind and Solar Based DGs in Distribution
System for Power Loss Minimization and Voltage Stability Improvement.” International Journal of
Electrical Power & Energy Systems. https://doi.org/10.1016/j.ijepes.2013.05.047.
Ke, Yang, Mohammed Saleh Al Aboody, Wael Alturaiki, Suliman A. Alsagaby, Faiz Abdulaziz
Alfaiz, Vishnu Priya Veeraraghavan, and Suresh Mickymaray. 2019. “Photosynthesized Gold
Nanoparticles from Catharanthus Roseus Induces Caspase-Mediated Apoptosis in Cervical Cancer
Cells (HeLa).” Artificial Cells, Nanomedicine, and Biotechnology 47(1): 1938–46.
Krishnaswamy, Haribabu, Sivaprakash Muthukrishnan, Sathish Thanikodi, Godwin Arockiaraj
Antony, and Vijayan Venkatraman. 2020. “Investigation of Air Conditioning Temperature Variation
by Modifying the Structure of Passenger Car Using Computational Fluid Dynamics.” Thermal
Science 24 (1 Part B): 495–98.
Malli Sureshbabu, Nivedhitha, Kathiravan Selvarasu, Jayanth Kumar V, Mahalakshmi Nandakumar,
and Deepak Selvam. 2019. “Concentrated Growth Factors as an Ingenious Biomaterial in
Regeneration of Bony Defects after Periapical Surgery: A Report of Two Cases.” Case Reports in
Dentistry 2019 (January): 7046203.
Mathew, M.G., S.R. Samuel, A.J. Soni, and K.B. Roopa. 2020. “Evaluation of Adhesion of
Streptococcus Mutans, Plaque Accumulation on Zirconia and Stainless Steel Crowns, and
Surrounding Gingival Inflammation in Primary ….” Clinical Oral Investigations.
https://link.springer.com/article/10.1007/s00784-020-03204-9.
Mehta, Meenu, Deeksha, Devesh Tewari, Gaurav Gupta, Rajendra Awasthi, Harjeet Singh, Parijat
Pandey, et al. 2019. “Oligonucleotide Therapy: An Emerging Focus Area for Drug Delivery in
Chronic Inflammatory Respiratory Diseases.” Chemico-Biological Interactions 308 (August): 206–
15.
Mishra, M., and P.K. Modi. 2016. “Performance Improvement of Electric Power Distribution System
Using DG.” Distributed Generation & Alternative Energy Journal.
https://doi.org/10.1080/21563306.2016.11781080.
Muthukrishnan, Sivaprakash, Haribabu Krishnaswamy, Sathish Thanikodi, Dinesh Sundaresan, and
Vijayan Venkatraman. 2020. “Support Vector Machine for Modelling and Simulation of Heat
Exchangers.” Thermal Science 24 (1 Part B): 499–503.
Pc, J., T. Marimuthu, and P. Devadoss. 2018. “Prevalence and Measurement of Anterior Loop of the
Mandibular Canal Using CBCT: A Cross Sectional Study.” Clinical Implant Dentistry and Related
Research. https://europepmc.org/article/med/29624863.
Ramadurai, Neeraja, Deepa Gurunathan, A. Victor Samuel, Emg Subramanian, and Steven J.L.
Rodrigues. 2019. “Effectiveness of 2% Articaine as an Anesthetic Agent in Children: Randomized
Controlled Trial.” Clinical Oral Investigations 23 (9): 3543–50.
Ramaprabha, R., and B.L. Mathur. 2008. “Modelling and Simulation of Solar PV Array under Partial
Shaded Conditions.” 2008 IEEE International Conference on Sustainable Energy Technologies.
https://doi.org/10.1109/icset.2008.4746963.
Rambabu, T., and P. Venkata Prasad. 2014. “Optimal Placement and Sizing of DG Based on Power
Stability Index in Radial Distribution System.” 2014 International Conference on Smart Electric
Grid (ISEG). https://doi.org/10.1109/iseg.2014.7005586.

ISSN: 2237-0722                                                                             1082
Vol. 11 No. 4 (2021)
Received: 16.05.2021 – Accepted: 08.06.2021
Ramesh, Asha, Sheeja Varghese, Nadathur D. Jayakumar, and Sankari Malaiappan. 2018.
“Comparative Estimation of Sulfiredoxin Levels between Chronic Periodontitis and Healthy Patients
- A Case-Control Study.” Journal of Periodontology 89 (10): 1241–48.
Samuel, Melvin S., Jayanta Bhattacharya, Sankalp Raj, Needhidasan Santhanam, Hemant Singh, and
N. D. Pradeep Singh. 2019. “Efficient Removal of Chromium (VI) from Aqueous Solution Using
Chitosan Grafted Graphene Oxide (CS-GO) Nanocomposite.” International Journal of Biological
Macromolecules 121 (January): 285–92.
Sathish, T., and S. Karthick. 2020. “Wear Behaviour Analysis on Aluminium Alloy 7050 with
Reinforced SiC through Taguchi Approach.” Journal of Japan Research Institute for Advanced
Copper-Base Materials and Technologies 9 (3): 3481–87.
Sharma, Parvarish, Meenu Mehta, Daljeet Singh Dhanjal, Simran Kaur, Gaurav Gupta, Harjeet
Singh, Lakshmi Thangavelu, et al. 2019. “Emerging Trends in the Novel Drug Delivery Approaches
for the Treatment of Lung Cancer.” Chemico-Biological Interactions 309 (August): 108720.
Sridharan, Gokul, Pratibha Ramani, Sangeeta Patankar, and Rajagopalan Vijayaraghavan. 2019.
“Evaluation of Salivary Metabolomics in Oral Leukoplakia and Oral Squamous Cell Carcinoma.”
Journal of Oral Pathology & Medicine: Official Publication of the International Association of Oral
Pathologists and the American Academy of Oral Pathology 48 (4): 299–306.
Varghese, Sheeja Saji, Asha Ramesh, and Deepak Nallaswamy Veeraiyan. 2019. “Blended Module-
Based Teaching in Biostatistics and Research Methodology: A Retrospective Study with
Postgraduate Dental Students.” Journal of Dental Education 83 (4): 445–50.
Venu, Harish, V. Dhana Raju, and Lingesan Subramani. 2019. “Combined Effect of Influence of
Nano Additives, Combustion Chamber Geometry and Injection Timing in a DI Diesel Engine Fuelled
with Ternary (diesel-Biodiesel-Ethanol) Blends.” Energy 174 (May): 386–406.
Vignesh, R., Ditto Sharmin, C. Vishnu Rekha, Sankar Annamalai, and Parisa Norouzi Baghkomeh.
2019. “Management of Complicated Crown-Root Fracture by Extra-Oral Fragment Reattachment and
Intentional Reimplantation with 2 Years Review.” Contemporary Clinical Dentistry 10 (2): 397–401.
Vijayakumar Jain, S., M.R. Muthusekhar, M.F. Baig, P. Senthilnathan, S. Loganathan, P. U. Abdul
Wahab, M. Madhulakshmi, and Yogaen Vohra. 2019. “Evaluation of Three-Dimensional Changes in
Pharyngeal Airway Following Isolated Lefort One Osteotomy for the Correction of Vertical
Maxillary Excess: A Prospective Study.” Journal of Maxillofacial and Oral Surgery 18 (1): 139–46.
Vijayashree Priyadharsini, Jayaseelan. 2019. “In Silico Validation of the Non-Antibiotic Drugs
Acetaminophen and Ibuprofen as Antibacterial Agents against Red Complex Pathogens.” Journal of
Periodontology 90 (12): 1441–48.
Villalva, M.G., J.R. Gazoli, and E.R. Filho. 2009. “Comprehensive Approach to Modeling and
Simulation of Photovoltaic Arrays.” IEEE Transactions on Power Electronics.
https://doi.org/10.1109/tpel.2009.2013862.
Zevallos, Oscar C., Jose B. Da Silva, Fernando Mancilla-David, Francisco A. S. Neves, Rafael C.
Neto, and Ricardo B. Prada. 2021. “Control of Photovoltaic Inverters for Transient and Voltage
Stability Enhancement.” IEEE Access. https://doi.org/10.1109/access.2021.3066147.

ISSN: 2237-0722                                                                                1083
Vol. 11 No. 4 (2021)
Received: 16.05.2021 – Accepted: 08.06.2021
You can also read