Determination of the harvest time of sugar apples (Annona squamosa L.) in function of carpel interspace - SciELO
←
→
Page content transcription
If your browser does not render page correctly, please read the page content below
Acta Scientiarum        http://periodicos.uem.br/ojs
                        ISSN on-line: 1807-8621
                        Doi: 10.4025/actasciagron.v43i1.48732

                                                                                                                               CROP PRODUCTION

Determination of the harvest time of sugar apples (Annona
squamosa L.) in function of carpel interspace

Elias Ariel de Moura1* , Pollyana Cardoso Chagas2, Railin Rodrigues Oliveira2, Daniel Lucas Lima
Taveira2, Maria Luiza Grigio2 and Wellington Farias Araújo2
1
 Departamento de Ciências Agronômicas e Florestais, Universidade Federal Rural do Semi-Árido, Rua Francisco Mota, 572, 59625-900, Mossoró, Rio
Grande do Norte, Brazil. 2Departamento de Fitotecnia, Universidade Federal de Roraima, Campus Cauamé, Boa Vista, Roraima, Brazil. *Author for
correspondence. E-mail: eliasariel90@gmail.com

        ABSTRACT. Sugar apples have attracted attention in recent years due to their medicinal and nutritional
        properties. However, the shelf life of sugar apples is one of the most concerning problems owing to their
        perishability. This work aimed to determine the ideal harvest time for sugar apple fruits in relation to
        different classes of carpel interspaces. Therefore, fruits were classified into three stages according to the
        carpel interspace: stage 1 (0.0 - 2.0 mm); stage 2 (2.1 - 3.0 mm); and stage 3 (3.0 - 4.0 mm). After
        harvesting, the fruits were evaluated daily in the laboratory regarding their physical and physicochemical
        aspects until they reached the point of consumption (horticultural maturation). The following variables
        were evaluated: fruit diameter and length (mm); fruit, peel, pulp, and seed masses (g); color index,
        including the chromatic attributes L* (luminosity), C* (chroma), and h* (hue angle); bark firmness (N);
        soluble solids (°Brix); titratable acidity (g citric acid 100 g-1 of pulp-1); pulp yield; and ratio SS/TA. Fruits at
        stage 3 showed larger diameters, less firmness, and better chromaticity means. Fruits at stages 2 and 3
        had eight days of postharvest life. However, fruits at stage 2 took longer for 50% of the fruits to be ready
        for consumption. The results demonstrate that stages 2 and 3 can be determinants for the harvest time of
        sugar apples.
        Keywords: harvest period; physicochemical characteristics; point of maturation; postharvest technology; shelf life.

                                                                                                                     Received on September 16, 2019.
                                                                                                                     Accepted on December 12, 2019.

                                                                Introduction
   Sugar apples (Annona squamosa L.) have emerged in the international in natura fruit market for their
excellent prices and acceptance by consumers because of their pleasant flavor and aroma. Additionally, the
species is highlighted in the Annona genus for its medicinal and nutritional properties as a source of
vitamins A, B, C, E, and K1, antioxidants, polyunsaturated fatty acids, and essential minerals (Liu et al.,
2015; Liu, Yuan, & Jing, 2013).
   However, to improve the fruit quality and extend the storage periods, fruits with climacteric patterns,
such as sugar apples, must be harvested before the climacteric stage begins, considering that the maturation
process continues during storage. Setting the ideal harvest time is a difficult task, but some morphological
characteristics of the fruits can be taken into account; for example, farmers can make this decision based on
the carpel interspace and the change in the epidermis color of the fruit carpels, which change from green to
yellowish green (Liu et al., 2015; Pareek, Yahia, Pareek, & Kaushik, 2011).
   On the one hand, the early harvest hinders fruit maturation; on the other hand, late harvest shortens the
storage period since the fruits are close to the senescence stage and therefore are subject to greater
dehydration (Silva, Mizobutsi, Mizobutsi, Cordeiro, & Fernandes, 2013). Thus, in both situations, the fruits
become more susceptible to physiological disorders than when harvested at the appropriate time.
   During the harvest stage, the fruits change color from green to yellowish cream - green between the
carpels (Vishnu Prasanna, Sudhakar Rao, & Krishnamurthy, 2000). The fruits present excellent
characteristics for consumption and six-day shelf life when harvested 104 days after pollination (Pereira,
Braz, Nietsche, & Mota, 2010). The shelf life of fruits harvested at 108 days decreased by half (three-day
shelf life). Conversely, the authors reported a 50 g increase in pulp mass. In preliminary studies, it is
indicated that the distance between the carpels at harvest may be an indicator for the useful life of the fruits
                                                                                              Acta Scientiarum. Agronomy, v. 43, e48732, 2021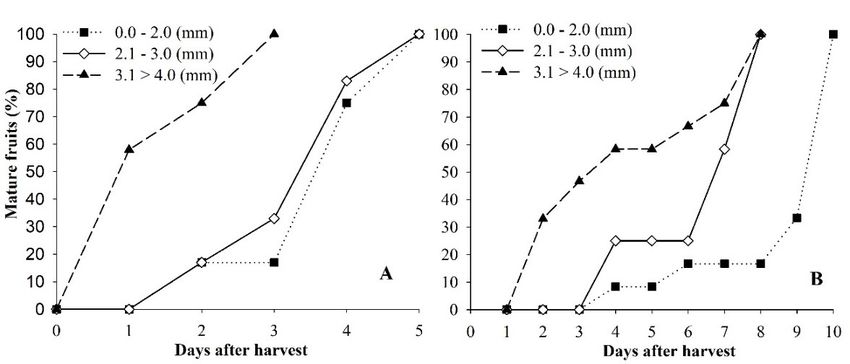
Page 2 of 10                                                                                                                                         Moura et al.

and observed changes in the soluble solids in the fruits. However, these results are preliminary and require
more accurate evaluations from the physical and physicochemical point of view. Moreover, it is observed
that climatic conditions are factors that affect the organoleptic qualities of fruits. Thus, to define the stage
of fruit harvest and improve the scientific knowledge on the subject, the objective of this study was to
evaluate the ideal time for harvesting sugar apple fruits in relation to the different carpel interspace classes.

                                                                    Material and methods
    The experiment was carried out in a sugar apple commercial orchard belonging to the Paricarana Farm,
located in the municipality of Cantá, state of Roraima, Brazil. The climate of the region is classified as Awi
(tropical rainy) according to Koppen’s classification, with an average temperature of 27.4°C, a 90 m altitude
(Alvares, Stape, Sentelhas, Moraes Gonçalves, & Sparovek, 2013), a minimum annual rainfall of 944.7 mm, a
total annual rainfall of 1,678.6 mm, and a relative humidity of 70% (Araújo, Andrade Junior, Medeiros, &
Sampaio, 2001).
    During the experimental period, the maximum, average, and minimum temperatures, rainfalls, and
relative humidities were recorded (Figure 1).

                                    100                                                                                                      300

                                    90
                                                                                                                                             250
                                    80
            Relative humidity (%)

                                    70
                                                                                                                                             200
              Temperature ( C)

                                    60

                                                                                                                                                   Rainfall (mm)
                                    50                                                                                                       150

                                    40
                                                                                                                                             100
                                    30

                                    20
                                                                                                                                             50
                                    10

                                      0                                                                                                      0

                                                                                   Months

                                                 RF (mm)         Maximum             Minimum             Average            RH (%)

 Figure 1. Maximum (T Max), average (T av), and minimum (T min) temperature, rainfalls (Rain), and relative humidities (RH) for the
                                             months of the experimental evaluation.

   The sugar apple trees were planted in 2009, spaced 4 x 4 meters (m) apart, in open pots. The soil of the
experimental area is classified as dystrophic yellow latosol (Embrapa, 2018). Table 1 shows the soil chemical
attributes of the experimental area.

  Table 1. Soil chemical analysis of the experimental area at the 0 - 0.20 meters (m) and 0.20 – 0.40 meters (m) layers for 2015/2016.

                                                                K         Ca2+        Mg2+        Al3+       H + Al        SB        CECef
    Layer (m)                        pH H2O      P (mg dm-3)                                                                                                   V%
                                                                   -----------------------------cmolc dm-3 -----------------------------
      0 - 0.20                             5.8       51.6      0.09       2.06        0.55         -           1.7         2.7        4.4                          61
    0.20 - 0.40                           5.17        0.3      0.01       0.26        0.07        0.4          2.5        0.34        2.84                         12
 pH in water (1:2:5); Ca2+, Mg2+, and Al3+: KCl 1 mol L-1 extractor; K+ and P: mehlich-1 extractor; H + Al: SMP extractor; SB: sum of exchangeable bases; t:
                  effective cation exchange capacity (CEC); T: CEC at pH 7.0; V: base saturation index; m: aluminum saturation index.

   The plants were manually pruned using pruning shears. The experiment was conducted over two years of
production, September 2014 - February 2015 and September 2015 - February 2016. The first production
pruning was performed on September 10, 2014, and the second was performed on September 3, 2015,
shortly after harvesting the previous cycle. The branches were standardized to 40 cm in length.
Subsequently, the branches were manually pruned from the apex to the base to induce a new production
cycle.
                                                                                                        Acta Scientiarum. Agronomy, v. 43, e48732, 2021
Determination of the harvest time sugar apples Page 3 of 10
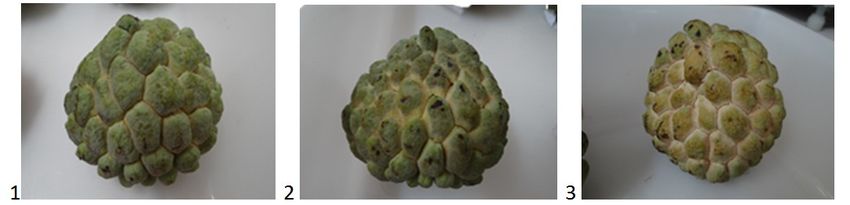
For the determination of the ideal harvest time, fruits were harvested and classified into three
developmental stages: class 1 (0.0 to 2.0 mm); class 2 (2.1 to 3.0 mm); and class 3 (3.1 to 4.0 mm) (Figure 2).
Figure 2. Sugar apple fruits (Annona squamosa L.) harvested and separated into three classes regarding carpels interspace, 1 (0.0 - 2.0
mm), 2 (2.1 - 3.0 mm), and 3 (3.1 - 4.0 mm), cultivated under savanna conditions in Roraima.
After the classification, the fruit samples were sent to the Embrapa Roraima Post-Harvest and
Agroindustry Laboratory to evaluate the shelf life. The fruits were stored at a room temperature of 27°C
(±1°C), and the physical and physicochemical aspects of the fruits were evaluated when they reached the
stage of maturity for consumption.
The following variables were evaluated: diameter and fruit length, using precision digital calipers
(0.01 mm); fruit, peel, pulp, and seed masses, using a semianalytic precision scale (0.01 g); color index,
using a colorimeter (Konica Minolta, model CR400, system CIELAB, illuminant D65), with two readings
per fruit on the opposite sides of the equatorial region, considering the chromatic attributes L*
(luminosity), C* (chroma/saturation), and h* (hue/color angle); bark firmness, with two readings per
fruit on the opposite sides of the equatorial region, after prior bark removal, using a manual
penetrometer equipped with an 8 mm Effegi tip, expressed in (N); soluble solids, using the
methodology described by the Institute Adolfo Lutz, in (°Brix) ( Instituto Adolfo Lutz [IAL], 2008);
titratable acidity (TA), determined by titration with sodium hydroxide solution (0.01 N), using 1%
phenolphthalein as an indicator. Five grams of a pulp sample was used (diluted in 100 m L of distilled
water), and the results are expressed as g of pulp-1 (IAL, 2008). The pulp yield was determined by
subtracting the peel and seed mass from the total fruit mass. The ratio between soluble solids and
titratable acidity (SS/TA) was also determined.
The experimental design was completely randomized in a 3 x 2 factorial scheme with three
replications. The factors corresponded to fruits harvested in three classes regarding the carpel
interspace, 1 (0.0 - 2.0 mm), 2 (2.1 - 3.0 mm), and 3 (3.1 - 4.0 mm), over two evaluation periods (2015 -
2016).
The variables were submitted to joint analysis of variance. The homogeneity of the residual variances of
the experiment (QMR) was verified by the ratio between the largest and smallest mean residual squares of
the tests. The variances were considered homogeneous when the ratio between the highest and the lowest
QMR was ≤ 7.0 (Pimentel-Gomes, 1990). The data were compared by Tukey’s test at the 5% probability level
(p ≤ 0.05). Additionally, the fruit quality of the different classes was evaluated by principal component
analysis to determine the fruit classes with the best qualitative traits in the different seasons. Analyses were
performed in the SISVAR software (Ferreira, 2014). Principal component analysis was performed using the
INFOSTAT software (Rienzo et al., 2016).
Results
The physical characteristics of the fruit classes showed interactions between the carpel interspaces, 1
(0.0 - 2.0 mm), 2 (2.1 - 3.0 mm), and 3 (3.1 - 4.0 mm) and the two seasons (2014 - 2015 and 2015 - 2016), but
a significant effect was observed only for the fruit firmness (Table 2) by Fischer’s test at the 5% probability
level (p ≤ 0.05).
It was observed that only fruits harvested in class 3.1 - 4.0 presented a significant difference, in which
the fruits harvested in 2016 presented the highest average, differing from (p ≤ 0.05) in relation to those
harvested in 2015. In 2015, treatments 0.0 - 0.20 and 2.1 - 3.0 did not differ from each other, and only
treatments 3.1 - 4.0 showed less firmness.
Acta Scientiarum. Agronomy, v. 43, e48732, 2021Page 4 of 10 Moura et al.
Table 2. Length, diameter, firmness, mass of fruits, bark mass, seed mass, seed number, and pulp yield of sugar apple fruits (Annona
squamosa L.) harvested and separated into three classes regarding the carpels interspace, 1 (0.0 - 2.0 mm), 2 (2.1 - 3.0 mm), and 3 (3.1 -
4.0 mm), in two evaluation periods (2015 - 2016), cultivated under savanna conditions in Roraima.
Length (mm) Diameter (mm)
Season Carpels interspace (mm) Mean Carpels interspace (mm) Mean
0.0 - 2.0 2.1 - 3.0 3.1 - 4.0 0.0 - 2.0 2.1 - 3.0 3.1 - 4.0
2015 65.15 69.68 68.30 67.71 b 66.24 69.92 74.05 70.07
2016 73.38 73.65 75.46 74.16 a 69.24 74.69 73.63 72.52
Mean 69.27 71.66 71.88 - 67.74 B 72.31 AB 73.84 A -
CV (%) 5.85 6.40
Firmness (N) Fruit mass (g)
Season Carpels interspace (mm) Mean Carpels interspace (mm)
Mean
0.0 - 2.0 2.1 - 3.0 3.1 - 4.0 0.0 - 2.0 2.1 - 3.0 3.1 - 4.0
2015 6.17 Aa 6.40 Aa 3.08 Bb 5.22 155.77 170.42 178.33 168.17
2016 6.76 Aa 4.78 Aa 4.91 Aa 5.48 186.59 193.19 201.28 193.69
Mean 6.46 5.59 4.00 - 171.19 181.81 189.81 -
CV (%) 22.05 16.52
Bark mass (g) Seed mass (g)
Mean Mean
Season Carpels interspace (mm) Carpels interspace (mm)
0.0 - 2.0 2.1 - 3.0 3.1 - 4.0 0.0 - 2.0 2.1 - 3.0 3.1 - 4.0
2015 80.50 81.77 85.45 82.57 b 12.77 15.44 10.78 12.75
2016 97.54 96.46 102.74 98.92 a 14.92 12.17 10.05 12.62
Mean 89.02 89.12 94.10 13.84 13.80 10.41
CV (%) 16.6 25.71
No. of seeds Yield (%)
Mean Mean
Season Carpels interspace (mm) Carpels interspace (mm)
0.0 - 2.0 2.1 - 3.0 3.1 - 4.0 0.0 - 2.0 2.1 - 3.0 3.1 - 4.0
2015 32.58 40.50 30.33 33.50 39.55 43.37 46.54 43.15
2016 39.83 32.75 27.42 34.31 39.54 43.57 43.47 42.20
Mean 36.21 36.62 28.87 39.55 43.47 45
CV (%) 22.61 10.95
Means followed by the same lowercase letters in the columns and uppercase letters in the rows do not differ from each other by the Tukey’s test, at the 5%
probability level. CV - coefficient of variation.
For the length and bark mass of the fruit, only the season was significant; for the diameter of the fruit, only the
treatments presented significant differences by Fischer’s test at the 1% probability level (p ≤ 0.01). For the length
and bark mass, fruits harvested in 2016 were statistically superior, differing from those harvested in 2015 by Tukey’s
test (p ≤ 0.05). For the fruit diameter, it was observed that class 3 (3.1 - 4.0 mm) had the highest mean but differed
only from the fruits of class 1 (0.0 - 2.0 mm) by Tukey's test at the 5% probability level (p ≤ 0.05) (Table 2).
In the three classes, the physicochemical and chemical characteristics of the fruits did not present significant
differences for the interaction between the harvest season and the interspace carpel class (Table 3).
Table 3. Physicochemical and chemical characteristics: soluble solids (SS - °Brix), Hydrogenionic potential (pH), titratable acidity (TA),
and ratio (SS/TA) of sugar apple fruits (Annona squamosa L.) harvested and separated into three classes regarding the carpels
interspace, 1 (0.0 - 2.0 mm), 2 (2.1 - 3.0 mm), and 3 (3.1 - 4.0 mm), in two evaluation periods (2015 - 2016), cultivated under savanna
conditions in Roraima.
SS (°Brix) pH
Mean Mean
Season Carpels interspace (mm) Carpels interspace (mm)
0.0 - 2.0 2.1 - 3.0 3.1 - 4.0 0.0 - 2.0 2.1 - 3.0 3.1 - 4.0
2015 32.07 32.97 30.03 31.69 5.58 5.54 5.49 5.54
2016 33.62 30.42 30.18 31.41 5.68 5.54 5.73 5.65
Mean 32.84 A 31.69 AB 30.10 B - 5.63 5.54 5.61 -
CV (%) 6.21 2.75
TA (g ac. 100 g-1 of pulp) Ratio (SS/TA)
Mean Mean
Season Carpels interspace (mm) Carpels interspace (mm)
0.0 - 2.0 2.1 - 3.0 3.1 - 4.0 0.0 - 2.0 2.1 - 3.0 3.1 - 4.0
2015 0.4 0.39 0.38 0.34 82.03 86.07 89.48 85.86
2016 0.4 0.39 0.34 0.38 87.99 80.23 79.75 82.66
Mean 0.4 0.39 0.36 - 85.01 83.15 84.61
CV (%) 9.87 9.02
Means followed by the same lowercase letters in the columns and uppercase letters in the rows do not differ from each other by the Tukey’s test, at the 5%
probability level. CV - coefficient of variation.
Acta Scientiarum. Agronomy, v. 43, e48732, 2021Determination of the harvest time sugar apples Page 5 of 10
Only the soluble solids presented significant results for the interspace carpel classes by Fischer’s test at
the level of p ≤ 0.05. Class 1 (0.0 - 2.0 mm) presented the highest SS (°Brix) mean; however, class 1 did not
significantly differ from class 2 (2.1 - 3.0 mm) (Table 3).
Table 4 shows that the luminosity of the epidermis of the sugar apple fruits did not statistically differ,
and the same was observed for the angle hue. For the chromaticity, class 3 (3.1 to 4.0 mm) had the highest
mean, differing statistically only from class 1 (0.0 - 2.0 mm).
Table 4. Luminosity (L), Chromaticity (C), color or angle (Hue) of sugar apple fruits (Annona squamosa L.) harvested and separated into
three classes regarding the carpels interspace, 1 (0.0 - 2.0 mm), 2 (2.1 - 3.0 mm), and 3 (3.1 - 4.0 mm), in two evaluation periods (2015 -
2016), cultivated under savanna conditions in Roraima.
L C
Season Carpels interspace (mm) Mean Carpels interspace (mm) Mean
0.0 - 2.0 2.1 - 3.0 3.1 - 4.0 0.0 - 2.0 2.1 - 3.0 3.1 - 4.0
2015 45.39 46.35 51.05 47.60 18.81 21.34 26.27 22.51
2016 45.95 46.49 47.76 46.74 19.28 20.35 31.39 20.34
Mean 45.67 46.42 49.40 19.60 B 20.84 AB 23.83 A
CV (%) 6.00 11.92
H
Season Carpels interspace (mm) Mean
0.0 - 2.0 2.1 - 3.0 3.1 - 4.0
2015 84.85 86.13 89.01 86.67
2016 81.51 82.67 90.10 83.42
Mean 83.18 84.40 89.56
CV (%) 7.56
Means followed by the same lowercase letters in the columns and uppercase letters in the rows do not differ from each other by the Tukey’s test, at the 5%
probability level. CV - coefficient of variation.
Regarding the number of days for the fruits of each class to reach maturity, the fruits of class 3 reached
maturation more quickly (Figure 2). However, classes 2 and 3 presented excellent quality regarding physical
characteristics, and sugar apples can be harvested at both developmental stages without affecting the fruit
quality after reaching the point of maturation for consumption (Tables 2 and 3 and Figure 3).
Figure 3. Evaluation of the percentage of sugar apple fruits (Annona squamosa L.) at the point of maturation for consumption,
harvested and separated into three classes regarding carpels interspace, 1 (0.0 - 2.0 mm), 2 (2.1 - 3.0 mm), and 3 (3.1 - 4.0 mm), in two
evaluation periods (A – 2015 and B – 2016), cultivated under savanna conditions in Roraima.
For class 3, more than 50% of the fruits reached the maturation point for consumption on the first day in
2015 and on the fourth day of postharvest storage in 2016, reaching the maturation point for 100%
consumption on the third day for class 3 (3.0 - 4.0) in 2015 and on the eighth day for classes 2 (2.0 - 3.1 mm)
and 3 (3.0 - 4.0 mm) postharvest storage. Although it took longer for more than 50% of the fruits of class 2
(2.1 - 3.0 mm) to reach the maturation point for consumption, 100% of the fruits reached maturity on the
eighth postharvest day, being highly perishable. It was observed that the fruits of 2015 had a shorter shelf
life than those of 2016. This fact was explained by the degree of firmness of the fruits, in which in 2015, the
fruits were less firm.
Acta Scientiarum. Agronomy, v. 43, e48732, 2021Page 6 of 10 Moura et al.
To demonstrate the behavior of the physical and physicochemical characteristics of the fruits in a
holistic manner as a function of harvest time, multivariate analysis was performed on the main components
(PC). Figure 4 shows a biplot with treatments and variables from the 2014 (A) and 2015 (B) cycles.
Figure 4. Principal Component Analysis (PCA) of the maturity point of fruits for consumption, harvested and separated into three
classes regarding carpels interspace, (0.0 - 2.0 mm), (2.1 - 3.0 mm), and (3.1 - 4.0 mm) in two evaluation periods, 1 – 2015 and 2 – 2016,
cultivated under savanna conditions in Roraima. Biplot (variables Load and sample scores) Closed-square symbols correspond to fruits
harvested in 2015, closed circle symbols to fruits harvested in 2016, open triangle symbols correspond to the variables that showed a
significant correlation.
The variance explained in season 1 (2014 - 2015) was 79.3% of the data variability for PC 1, correlating
with the variables L, C, H, Length, Diam, Firm, Fruit mass, Seed mass, N seeds, SS, TA, Ratio (SS/TA), and
Yield. PC 2 explained 20.7% of the variability of the data, correlating the variables pH and Peel mass.
According to the PC, there was a positive correlation between high soluble solids (SS) and SS/TA (Ratio)
variables and the length (Length) and hue (H). There was a strong negative correlation between the firmness
of the fruits in the removal class of carpels 1 (0,0 - 2,0 mm) with the diameter of the fruit in the distal class
of carpels 2 (2.1 - 3.00 mm) as well as with TA and the chromaticity of the shell (C).
Acta Scientiarum. Agronomy, v. 43, e48732, 2021Determination of the harvest time sugar apples Page 7 of 10
Regarding the treatment, the harvest stage in class 1 (0.0 to 2.0 mm) showed a strong correlation with the
variable groups Firm, SS, Ratio (SS/TA), N seeds, Seed mass and TA. In harvest class 2 (2.1 to 3.0 mm), only the
yield and the diameter of fruit were positively correlated variables, wherein the pH showed an inverse correlation
with the fruits of treatment 2 (2.1 - 3,0 mm). In harvest class 3 (3.1 - 4.0 mm), the group of variables that
presented the highest correlations were the Fruit mass, the colors of the bark; C, L, and H, Length and Peel mass.
For season 2 (2016), PC 1 explained 81.6% of the variability of the data, presenting a correlation with the
variables L, C, Bark mass, H, TA, pH, Firm, Diam, Yield, SS, and Ratio (SS/TA). PC 2 explained 18.4% of the
variability of the data, showing correlations with the variables Length, N seeds and Seed mass. Similar to
season 1 (2014 - 2015), TA showed a negative correlation with the chromaticity of the fruit peel, and pH
showed a negative correlation with Diam.
Treatment 1 (0.0 - 2.0 mm) showed a strong correlation only with pH, and the harvest class of carpels 2
(2.1 - 3.0 mm) was grouped with the variables TA, Firm, SS, Seed mass, and N seeds (Figure 4B). The groups
most associated with class 2 were the variables with a direct influence on the organoleptic characteristics of
the fruits, such as TA, SS, and firmness. Class 3 (3.1 - 4.0 mm) was grouped with the physical variables L, C,
Bark mass, Diam, Yield, Ratio, and a minor proportion with Length. The characteristics of fruit harvest class
3 (3.1 - 4.0 mm) presented the lowest affinities with the physicochemical characteristics, possibly due to the
higher degree of maturation of the fruit, presenting lower levels for TA, SS, Firm and pH. However, this class
correlated positively with the important maturity index (SS/TA) attributed to fruit quality.
Discussion
The values of the physical characteristics observed in the present experiment were similar to those
reported by Ferreira, Gimenez, Corsato, and Oliveira (2013).
The largest diameter detected for fruits of class 3 can be related to the higher maturation degree. This
fact is confirmed by the fruit firmness variable, which presented the lowest values (3.08 N), differing
statistically from those of the fruits of classes 1 and 2 (Table 2). The fruits harvested in 2016 presented
higher averages for the physical characteristics. Such results may have occurred due to the variations in the
climatic conditions that occurred in the periods. Figure 1 shows that the initial months of fruit development
presented temperature increases, a characteristic that influences the final development of the fruit.
Firmness has been mentioned in several studies as one of the fundamental parameters of fruit
postharvest evaluation because this parameter influences fruit flavor and shelf life. In the present study, the
fruits of class 3 showed an advanced maturation degree in relation to those of classes 1 and 2, where more
than 50% of the fruits reached horticultural maturity (maturation for consumption) on the first postharvest
day for the 2015 season and on the fourth postharvest day for the 2016 season (Figure 3).
Chitarra and Chitarra (2005) state that a continuous decline in firmness begins with normal fruit
maturation, which causes the loss of cellular turgescence and reductions in the fruit size, hydrolytic enzyme
action, and nonenzymatic mechanisms (Table 4).
The means of the soluble solid contents in the sugar apple fruits were higher than those found by other
authors in producing regions. Soluble solids contents between 27.4 and 28.7 °Brix were observed by Pereira
et al. (2009). The same was observed by Pereira et al. (2010), who harvested fruits 78 days after anthesis and
obtained soluble solids contents of 19.32 °Brix. The authors also verified an increase in the value of soluble
solids to 29 °Brix when fruits were harvested 91 days after anthesis. These high soluble solids contents can
be explained by the excellent tropical climatic conditions of the region.
It is known that high temperatures influence the final characteristics of fruits, improving the
organoleptic qualities of several fruits.
For the pH, the fruits showed values similar to those found in the literature. In the present study, the pH
values ranged from 5.49 to 5.73. These values are similar to those observed by Hernández et al. (2011), who
detected pH values from 5.8 to 6.0 at different harvest times. This characteristic was observed for class 2,
which yielded more fruits with excellent organoleptic qualities in both seasons, with 5 and 8 days of life
after harvest (Figure 3).
Titratable acidity is directly involved with the organoleptic qualities of fruits, influencing their taste and
odor, being, therefore, a characteristic that establishes the final quality of fruits (Chitarra & Chitarra, 2005).
In fruits belonging to the Annonaceae family, titratable acidity accumulation occurs during the initial
maturation of the fruits (Bolívar-Fernández, Saucedo-Veloz, Solís-Pereira, & Sauri-Duch, 2009; Farias et al.,
Acta Scientiarum. Agronomy, v. 43, e48732, 2021Page 8 of 10 Moura et al.
2011; Gonçalves, Lima, Lopes, & Prado, 2006; Lima et al., 2003; Pareek et al., 2011; Paull, Deputy, & Chen,
1983; Pereira et al., 2010; Pereira, Crane, Nietsche, Montas, & Santos, 2014; Vishnu Prasanna et al., 2000)
due to a decrease in enzymatic activity (malate oxidase) (Chitarra & Chitarra, 2005), which was observed in
classes 1 and 2 of the fruits. However, with fruit maturation, the titratable acidity decreases because of
respiration through the oxidation of tricarboxylic acids (Batista-Silva et al., 2018), which decreases the
acidity and total phenol content of sugar apples (Paull, 1982). Possibly as a result of low titratable acidity,
most of the fruits in class 3 had the shortest lifespan in comparison to the other classes (Figure 3). Organic
acids not only determine sweetness but also have great relevance when used in industry since acidity can
serve as a preservative and provide a longer shelf life (Aroucha, Gois, Leite, Santos, & Souza, 2010;
Benevides & Furtunato, 1998).
One way to evaluate the flavor of a fruit is by obtaining the soluble solids/titratable acidity ratio, denoted
the SS/TA ratio. These values are more expressive than individual evaluation of sugars or acidity. According
to Chitarra and Chitarra (2005), this ratio can indicate the stage of fruit physiological maturation. In the
present study, the ratio values ranged from 82.03 to 89.48. Higher ratio values indicate a more significant
presence of sugar content than acid content in a fruit, showing the predominance of sweetness in the fruit.
Silva et al. (2013) obtained the highest mean ratio (94.32) at eight days of storage.
Chromaticity is linked to color intensity (saturation) and shows that the sugar apple fruits of class 3 had
a more intense (more saturated) yellow-green color. The chromaticity value (saturation) represents the distance
from the luminosity axis (L), starting from the center (zero) and increasing towards the ends. Therefore, a higher
fruit maturation degree is observed for class 3 than classes 1 and 2. The color change from dark green to
yellowish green initially occurs in the carpel interspace. The yellowish green color (cream) intensifies from the
intercarpelar membrane to the top of the bark with increasing maturation degree.
This fact can be observed with °hue, which shows the changes in the color of the fruit with physiological
maturation together with the chromaticity, but even the °hue did not present a significant difference. It is
observed that with increasing distance from the carpel, the hue angle progressively increased from class 1
(0.0 - 2.0 mm) to class 3 (3.1 - 4.0 mm) for both seasons. The °hue is responsible for the color tonality,
representing the color change. Therefore, the closer to a 90°hue the values are, the more yellowish and near
maturation the fruits are. This change in color has been reported for the culture of the sugar apple, where
the authors cite that the ripening of the fruit coincides with a change from dark green to yellowish green, at
which time the fruits are suitable for harvesting (Pareek et al., 2011).
For the soursop, studies have observed that its chromaticity values increase with postharvest time in
relation to day zero (Lima, Alves, Filgueiras, & Enéas-Filho, 2003) because peel color variation during
ripening occurs possibly due to the process of chlorophyll degradation in relation to the respiratory
metabolism of the fruit (Prill, Neves, Tosin, & Chagas, 2012). In the present experiment, the fruits of class 3
(3.1 to 4.0 mm), which had the highest chromaticity values, showed the lowest firmness mean (3.08 N),
indicating that the fruits were at an advanced maturation stage compared with those of classes 1 and 2. This
fact was confirmed in the evaluation of the percentage of sugar apple fruits at the point of maturation for
consumption (Figure 2).
This phenomenon was due to polyphenol oxidases acting on the phenolic compounds, oxidizing the
quinones in the presence of oxygen and leading to the darkening of the tissues due to their polymerization
or reactions with amino acids and proteins (Selvarajan, Veena, & Manoj Kumar, 2018). However, for classes
2 and 3, no darkening in the fruit peel occurred during the storage period; therefore, classes 2 and 3 can be
used as a parameter for fruit picking due to their excellent visual appearance (Figure 2). Determining the
maturity of the fruit harvesting of sugar apples as a function of the number of days after pollination, Pereira
et al. (2010) observed that fruits harvested at 104 days after pollination yielded 6 days of postharvest life.
When the fruits were harvested at 108 days, their shelf life was only 3 days (Pereira et al., 2010). In the
present study, since artificial pollination was not performed, the fruits were marked after the anthesis of the
flowers pollinated by the beetles of the Nitidulidae family. Therefore, the fruits of the 2014/2015 season
were harvested 113 days after anthesis, yielding 3 days of life for class 3 and 5 days of life for classes 1 and 2.
The fruits of 2015/2016 were harvested 105 days after anthesis and yielded 8 days of life for classes 2 and 3
and 10 days for class 1.
Principal component analysis demonstrated high effectiveness in discriminating the variables within the
two evaluated periods. Periods I and II had the variance explained 100% by main components 1 and 2, where
Acta Scientiarum. Agronomy, v. 43, e48732, 2021Determination of the harvest time sugar apples Page 9 of 10
main component 1 showed greater discrimination of the data in relation to 2. Therefore, both components
were reliable, according to the Cliff (1988) criterion because the variability was greater than 70%.
The differences between the clusters related to the carpel interspace classes in the two periods were
striking, especially for classes 1 and 2 (0.0 - 2.0 mm and 2.1 - 3.0 mm, respectively), since for the first
evaluation period, class 1 showed correlations with the variables Firm, SS, Ratio, N Seeds, Seed mass, and
TA and for the second period had a direct relation only with the pH of the fruits, while class 2 had the
variables Yield and Diam grouped in the first period and showed a larger grouping of interrelated variables,
TA, Firm, SS, Seed mass, and N seeds, in the second period. Class 3 (3.1 - 4.0 mm), unlike the other classes,
presented groups for the two periods containing the variables Peel mass, Length, H, L, C, and Fruit mass;
however, for the first period, class 3 was also related to pH and in the second was related to Ratio, Yield, and
Diam together with the common variables. The edaphoclimatic differences, as well as physiological
differences of each individual, may have influenced these changes; however, it was observed that Group 3
maintained a certain homogeneity regarding the grouped variables, so a greater spacing between the carpels
indicated greater fruit uniformity in relation to the fruit characteristics evaluated.
Conclusion
Fruits corresponding to classes 2 (2.1 - 3.0 mm) and 3 (3.1 - 4.0 mm) exhibited the best physical and
physicochemical characteristics, with eight days of postharvest life. Therefore, these are the best harvest
times for sugar apple fruits.
Acknowledgements
To the National Council of Scientific and Technological Development (CNPq); the Coordination of
Improvement of Higher Education Personnel (CAPES); and Government of the State of Roraima for the
financial support and scholarship.
References
Alvares, C. A., Stape, J. L., Sentelhas, P. C., Moraes Gonçalves, J. L., & Sparovek, G. (2013). Köppen’s climate
classification map for Brazil. Meteorologische Zeitschrift, 22(6), 711-728. DOI: 10.1127/0941-2948/2013/0507
Araújo, W. F., Andrade Junior, A. S., Medeiros, R. D., & Sampaio, R. A. (2001). Precipitação pluviométrica
mensal provável em Boa Vista, estado de Roraima, Brasil. Revista Brasileira de Engenharia Agrícola e
Ambiental, 5(3), 563-567.
Aroucha, E. M. M., Gois, V. A., Leite, R. H. L., Santos, M. C. A., & Souza, M. S. (2010). Acidez em frutas e
hortaliças. Revista Verde de Agroecologia e Desenvolvimento Sustentável, 5(2), 1-4.
Batista-Silva, W., Nascimento, V. L., Medeiros, D. B., Nunes-Nesi, A., Ribeiro, D. M., Zsögön, A., & Araújo,
W. L. (2018). Modifications in organic acid profiles during fruit development and ripening: correlation or
causation? Frontiers in Plant Science, 9, 1-20. DOI: 10.3389/fpls.2018.01689
Benevides, C. M. J., & Furtunato, D. M. N. (1998). Hortaliças acidificadas. Ciência e Tecnologia de Alimentos,
18(3), 271-274. DOI: 10.1590/S0101-20611998000300004
Bolívar-Fernández, N., Saucedo-Veloz, C., Solís-Pereira, S., & Sauri-Duch, E. (2009). Ripening of sugar apple
fruits (Annona squamosa L.) developed in yucatán, México. Agrociencia, 43(2), 133-141.
Chitarra, M. I. F., & Chitarra, A. B. (2005). Pós-colheita de frutas e hortaliças: fisiologia e manuseio (2. ed.).
Lavras, MG: Universidade Federal de Lavras.
Cliff, N. (1988). The eigenvalues-greater-than-one rule and the reliability of components. Psychological Bulletin,
103(2), 276-279. DOI: 10.1037/0033-2909.103.2.276
Embrapa. (2018). Brazilian soil classification system (5a. ed.). Brasília, DF: Embrapa.
Farias, J. F., Neto, S. E. D. A., Álvarez, V. D. S., Ferraz, P. A., Furtado, D. T., & Souza, M. L. (2011). Maturação
e determinação do ponto de colheita de frutos de envira-caju. Revista Brasileira de Fruticultura, 33(3),
730-736. DOI: 10.1590/S0100-29452011005000100
Ferreira, D. F. (2014). Sisvar: a Guide for its Bootstrap procedures in multiple comparisons. Ciência e
Agrotecnologia, 38(2), 109-112. DOI: 10.1590/S1413-70542014000200001
Acta Scientiarum. Agronomy, v. 43, e48732, 2021Page 10 of 10 Moura et al.
Ferreira, G., Gimenez, J. I., Corsato, J. M., & Oliveira, M. C. (2013). Germinação de sementes de anonáceas.
In G. Ferreira, R. Kavati, C. S. F. Boaro, T. B. Ferrari, & S. Leonel (Eds.), Anonáceas: propagação e
produção de mudas (p. 19-43). Botucatu, SP: FEPAF.
Gonçalves, C. A. A., Lima, L. C. O., Lopes, P. S. N., & Prado, M. E. T. (2006). Caracterização física, físico-
química, enzimática e de parede celular em diferentes estádios de desenvolvimento da fruta de figueira.
Ciência e Tecnologia de Alimentos, 26(1), 220-226.
Hernández, O., Urdaneta, I., Morón, M., Hernández, C., Chacín, J., Guerrero, R., & Clamens, C. (2011).
Caracterización fisicoquímica de frutos de riñon (Annona squamosa L.) bajo condiciones de riego por
gravedad. Revista de la Facultad de Agronomía, 28(1), 351-358.
Instituto Adolfo Lutz [IAL]. (2008). Normas analíticas do Instituto Adolfo Lutz: métodos químicos e físicos para
análise de alimentos (3. ed., v. 1). São Paulo, SP: Instituto Adolfo Lutz.
Lima, M. A. C., Alves, R. E., Filgueiras, H. A. C., & Enéas-Filho, J. (2003). Respiratory behavior and
postharvest quality of “morada” soursop (Annona muricata L.) at room temperature. Revista Brasileira de
Fruticultura, 25(1), 49-52. DOI: 10.1590/S0100-29452003000100015
Liu, K., Li, H., Yuan, C., Huang, Y., Chen, Y., & Liu, J. (2015). Identification of phenological growth stages of
sugar apple (Annona squamosa L.) using the extended BBCH-scale. Scientia Horticulturae, 181, 76-80.
DOI: 10.1016/j.scienta.2014.10.046
Liu, K., Yuan, C., & Jing, G. (2013). Effect of exogenous oxalic acid treatment on ripening and preservation
of Annona squamosa L. fruits during postharvest storage. Food Scientia, 14, 329-334.
Pareek, S., Yahia, E. M., Pareek, O. P., & Kaushik, R. A. (2011). Postharvest physiology and technology of
Annona fruits. Food Research International, 44(7), 1741-1751. DOI: 10.1016/j.foodres.2011.02.016
Paull, E. R., Deputy, J., & Chen, J. N. (1983). Changes inorganic acids sugars and headspace volatiles during fruit
ripening of soursop Annona muricata. Journal of the American Society for Horticultural Science, 108(6), 931-934.
Paull, R. E. (1982). Postharvest variation in composition of soursop (Annona muricata L.) fruit in relation to
respiration and ethylene production [Indigenous to tropical America, Hawaii]. Journal of the American
Society for Horticultural Science, 107(4), 582-585.
Pereira, M. C. T., Bandeira, N., Antunes Júnior, R. C., Nietsche, S., Oliveira Júnior, M. X., Alvarenga, C. D., &
Oliveira, J. R. (2009). Efeito do ensacamento na qualidade dos frutos e na incidência da broca-dos-frutos
da atemoieira e da pinheira. Bragantia, 68(2), 389-396. DOI: 10.1590/S0006-87052009000200013
Pereira, M. C. T., Braz, L. C., Nietsche, S., & Mota, W. F. (2010). Determining the harvesting maturity of the
sugar apple fruits on northern Minas Gerais. Acta Horticulturae, 864(2), 207-214. DOI:
10.17660/ActaHortic.2010.864.27
Pereira, M. C. T., Crane, J. H., Nietsche, S., Montas, W., & Santos, M. A. (2014). Reguladores de crescimento
na frutificação efetiva e qualidade de frutos partenocárpicos de atemoia “Gefner”. Pesquisa Agropecuária
Brasileira, 49(4), 281-289. DOI: 10.1590/S0100-204X2014000400006
Pimentel-Gomes, F. (1990). Curso de estatística experimental (13. ed.). Piracicaba, SP: Nobel.
Prill, M. A. S., Neves, L. C., Tosin, J. M., & Chagas, E. A. (2012). Atmosfera modificada e controle de etileno
para bananas “Prata-Anã” cultivadas na Amazônia Setentrional Brasileira. Revista Brasileira de
Fruticultura, 34(4), 990-1003. DOI: 10.1590/S0100-29452012000400005
Rienzo, J. A., Casanoves, F., Balzarini, M. G., Gonzalez, L., Tablada, M., & Robledo, C. W. (2016). InfoStat
versión 2016 [Software]. Argentina: Grupo InfoStat, FCA; Universidad Nacional de Córdoba. Retrieved on
Oct. 30, 2018 from http://www.infostat.com.ar/index.php?mod=page&id=15
Selvarajan, E., Veena, R., & Manoj Kumar, N. (2018). Polyphenol oxidase, beyond enzyme browning. In J.
Singh, D. Sharma, G. Kumar, & N. R. Sharma (Orgs.), Microbial bioprospecting for sustainable development
(p. 203-222). London, UK: Springer Nature. DOI: 10.1007/978-981-13-0053-0_10
Silva, J. M., Mizobutsi, G. P., Mizobutsi, E. H., Cordeiro, M. H. M., & Fernandes, M. B., (2013). Postharvest
conservation of custard apple with the use of 1-methylcyclopropene. Revista Brasileira de Fruticultura,
35(4), 1201-1208. DOI: 10.1590/S0100-29452013000400031
Vishnu Prasanna, K. N., Sudhakar Rao, D. V., & Krishnamurthy, S. (2000). Effect of storage temperature on
ripening and quality of custard apple (Annona squamosa L.) fruits. The Journal of Horticultural Science and
Biotechnology, 75(5), 546-550. DOI: 10.1080/14620316.
Acta Scientiarum. Agronomy, v. 43, e48732, 2021You can also read