RELIABLE. DURABLE. GROWING - Q2 2021 - Debt Investors
←
→
Page content transcription
If your browser does not render page correctly, please read the page content below
RELIABLE.
DURABLE.
GROWING.
Q2 2021 – Debt Investors

DISCLAIMER
Forward – Looking Statements

This presentation contains forward looking information that reflects management’s current expectations relating to matters such as future financial performance and operating results of CT Real Estate
Investment Trust (“CT REIT” or the “REIT”). Forward-looking statements provide information about management’s current beliefs, expectations and plans and allow investors and others to better
understand the REIT’s anticipated financial position, results of operations, business strategy and financial needs. Readers are cautioned that such information may not be appropriate for other purposes.
Certain statements other than statements of historical facts included in this presentation that address activities, events or developments that CT REIT or a third-party expects or anticipates will or may
occur in the future, including the REIT’s future growth, results of operations, performance, business prospects and opportunities, and the effects of the COVID-19 pandemic on any of the foregoing and
assumptions underlying any of the foregoing, is forward-looking information. Often, but not always, forward-looking statements can be identified by the use of forward-looking terminology such as “may”,
“will”, “expect”, “intend”, “believe”, “estimate”, “plan”, “can”, “could”, “should”, “would”, “outlook”, “forecast”, “anticipate”, “aspire”, “foresee”, “continue”, “ongoing” or the negative of these terms or variations
of them or similar terminology. Specific forward-looking statements contained in this presentation include, but are not limited to, statements with respect to: the intention of the REIT to pay stable and
growing distributions; the REIT’s ability to expand its asset base, make accretive acquisitions, and develop or intensify its properties; the ability of the REIT to execute its growth strategies, including its
ability to pursue third party net lease opportunities; the ability of the REIT to participate with CTC in the development or intensification of the Properties; and the ability of the REIT to access available
sources of debt and/or equity financing; and the REIT’s development activities. Although the REIT believes that the forward-looking information in this presentation reflects management’s current beliefs
and are based on information currently available to CT REIT and on assumptions CT REIT believes are reasonable about future events and financial trends that management believes may affect the
REIT’s financial condition, results of operations, business strategy and financial needs, such information is necessarily subject to a number of factors that could cause actual results to differ materially
from management’s expectations and plans as set forth in such forward-looking statements. Some of the factors, many of which are beyond the REIT’s control and the effects of which can be difficult to
predict, include but are not limited to: the resilience and state of the real estate market, the Canadian economy including future levels of inflation, as well as the future of government stimulus plans and
any potential changes to current tax laws; that Canadian capital markets will provide CT REIT with access to debt at reasonable rates when required and that CTC will continue its involvement with CT
REIT on the basis described in its 2020 Annual Information Form (AIF). However, given the continued circumstances surrounding COVID-19, it is difficult to predict how significant the adverse impact of
the pandemic will be on the global and domestic economy, the business, operations and financial position of the REIT’s tenants, and the business, operations and financial position of the REIT. Additional
risks and uncertainties related to COVID-19 are discussed in section 2.0 (Factors Affecting the REIT As A Result of COVID-19 Pandemic) of the REIT’s Management’s Discussion and Analysis for the
quarter ended June 30, 2021 (“2021 Q2 MD&A”) and Section 3.7 (Other Recent Developments) of the REIT’s 2020 AIF. Management cautions that the foregoing list of important factors and assumptions
is not exhaustive and other factors could also adversely affect the REIT’s results. Investors and other readers are urged to consider the foregoing risks, uncertainties, factors and assumptions carefully in
evaluating the forward-looking statements and are cautioned not to place undue reliance on such forward-looking statements. For more information on the risks, uncertainties and assumptions that could
cause the REIT’s actual results to differ from current expectations, refer to section 12.0 (Enterprise Risk Management) of the 2021 Q2 MD&A. Also refer to section 4.0 (Risk Factors) of the REIT’s 2020
AIF, and all subsections thereunder, as well as the REIT’s other public filings, available on the System for Electronic Document Analysis and Retrieval website at www.sedar.com and on the REIT’s
website at https://investors.ctreit.com. The forward-looking information contained herein is based on certain factors and assumptions as of the date hereof and does not take into account the effect that
transactions or non-recurring or other special items announced or occurring after the statements are made have on the REIT’s business. CT REIT does not undertake to update any forward-looking
statements, whether written or oral, that may be made from time to time by it or on its behalf, to reflect new information, future events or otherwise, except as required by applicable securities laws.

Non-GAAP Measures

Certain terms used in this presentation, such as, FFO, AFFO, and EBITFV are not measures defined under IFRS and do not have standardized meanings prescribed by Generally Accepted
Accounting Principals (“GAAP”). They are not intended to represent operating profits for the period nor should any of these measures be viewed as an alternative to net income, cash flow from
operating activities or other measures of financial performance calculated in accordance with GAAP. Readers should be further cautioned that these measures may not be comparable to similar
measures presented by other issuers. Reconciliations of non-GAAP measures to GAAP may be found on pages 36-38 of this presentation.

                                                                                                                                                                                                                        2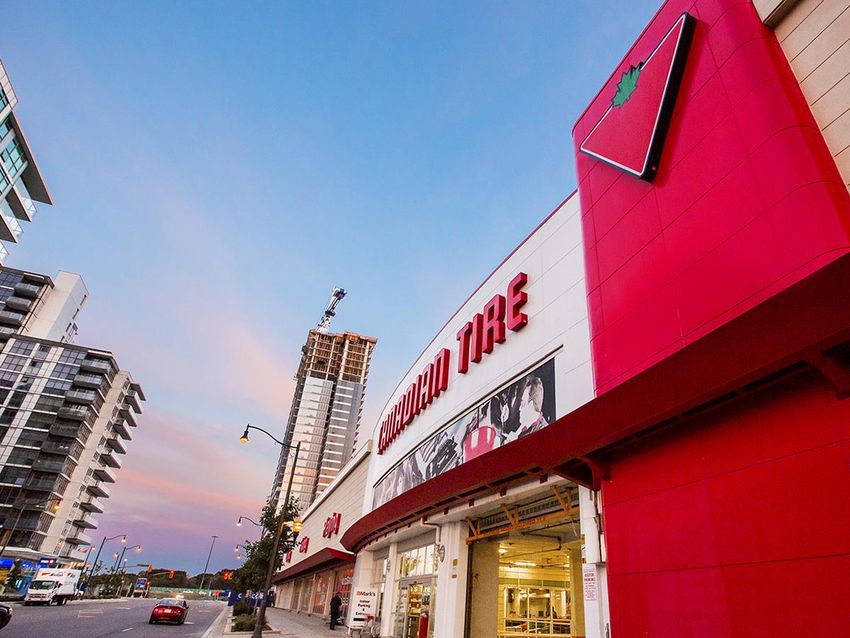
EXECUTIVE TEAM

Ken Silver                                            Lesley Gibson CPA, CA                      Highly
CEO                                                   SVP & CFO                                  experienced
                                                                                                 with in-depth
                                                                                                 market knowledge

Former President, Canadian Tire Real Estate Limited   Former CAO, Choice Properties REIT
Former SVP, Corporate Strategy &                      Former EVP Finance, Primaris Retail REIT
Real Estate, CTC

Kevin Salsberg
President & COO

Former EVP and CIO, Plaza Retail REIT
Former COO, KEYreit

                                                                                                                3
STRATEGIC
OVERVIEW

            4
INVESTMENT HIGHLIGHTS

                                                                      Canada’s premier
5-year AFFO/Unit CAGR(1) – 5.0%                                       Net Lease REIT

5-year NAV/Unit CAGR(1) – 4.6%

5-year Distribution/Unit CAGR(1) – 3.6%

Q2 2021 YTD AFFO Payout Ratio – 73.1%

Since 2013 IPO, invested $2B, added 10M square feet, and
increased distribution eight times

S&P and DBRS – BBB investment grade credit rating

4.5% distribution increase effective for the July 2021 distribution
payment

(1) Calendar years 2015-2020

                                                                                         5
CORE ATTRIBUTES

Track record of distribution increases – eight increases in eight years     CT REIT offers
since IPO                                                                   growth and
                                                                            resilience
Net-lease structure provides stable and predictable rental growth with
CTC average annual base minimum rent escalations of 1.5%

96% of annualized base minimum rent from investment grade tenants

High quality and diverse geographic portfolio – 363 properties across
all 10 provinces and 2 territories – core omni-channel network

Irreplaceable nature of fulfillment-oriented portfolio - 3.9M square feet
of prime industrial assets

Strategic relationship with CTC provides future portfolio growth

One of the longest weighted average remaining lease terms in the
sector – 8.9 years

                                                                                             6
COVID-19 UPDATE

                                                                 Resilience in
Strong Rent Collections: 99.7% for Q2 2021                       uncertain times

Occupancy Rate of 99.2% with 96% of annualized base minimum
rent from investment grade tenants

No credit losses in Q2 2021

$297M in cash and available Credit Facilities(1)

Unencumbered properties with an IFRS value of ~$6.2 billion(1)

(1) As at June 30, 2021

                                                                                   7
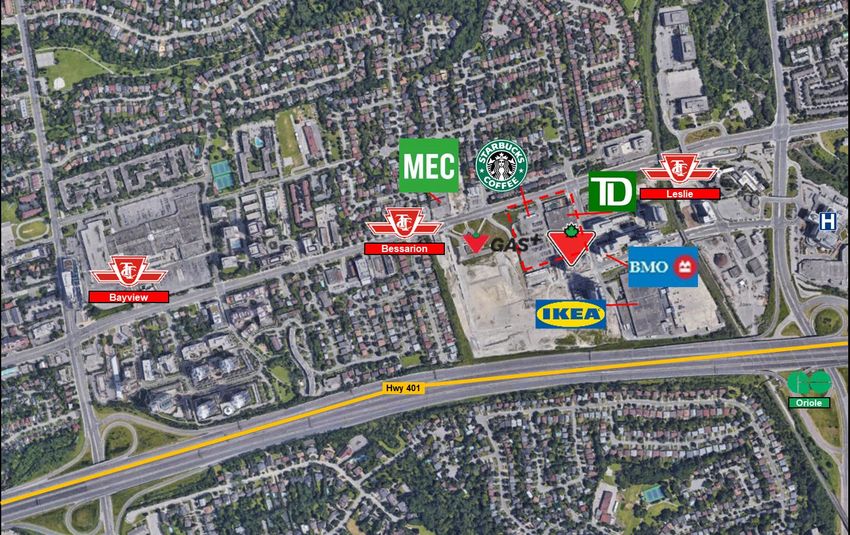
ICONIC CANADIAN RETAILER

                                   100% Brand Recognition                   Canadian Tire
                                                                            Corporation is one of
                                   Almost 100 years in business             Canada’s most
                                                                            admired and trusted
                                   80%+ of Canadians shop at Canadian       companies
                                   Tire stores each year

                                   Positive annual comparable store sales
                                   growth for the last ~10 years

                                   Outstanding 2020 and 2021 financial
                                   results highlighting proven resilience
 CTC family of banners:

Sources: Ipsos Reid and Insignia                                                              8
AN EXCEPTIONAL MAJOR TENANT

$12.1B
                                         Omni-channel
                                         performance drove
                                         CTC’s comparable
Market Capitalization
                                         retail sales growth
                                         to 11% in 2020 and
                                         9% YTD Q2 2021

$16.1B
Consolidated Revenue

BBB
Investment grade rating(1)

 All figures as at June 30, 2021
 (1) Source: Standard & Poors and DBRS
                                                          9
IRREPLACEABLE NATIONAL PORTFOLIO

                                                                                                          ~$6.3B
YUKON                                                                                                       Fair market value
1              NORTHWEST
               TERRITORIES

               2

BRITISH
                                                                                           NEWFOUNDLAND
                                                                                           AND LABRADOR
                                                                                                          28.7M
                                                                                                          Square feet of GLA(1)
                                                                                           8
                  ALBERTA

28 53
                                                                  QUEBEC

                                                                  76
COLUMBIA
                                             MANITOBA

                                             8
                                                        ONTARIO

                                                        140
                             SASKATCHEWAN

                             12                                                            NOVA
                                                                                           SCOTIA

                                                                                           18
                                                                           NEW
                                                                           BRUNSWICK   PRINCE EDWARD
                                                                                       ISLAND
TOTAL PROPERTY COUNT                                                       15          2
363
All figures as at June 30, 2021
(1) Excluding Properties Under Development                                                                                        10
HIGH QUALITY PORTFOLIO
BY MARKET(1)(2) BY ASSET TYPE
% OF ANNUALIZED BASE MINIMUM RENT % OF TOTAL GLA 46% of Base
SMALL
Minimum Rent from:
22% - Vancouver
URBAN – VECTOM - Edmonton
45% VECTOM – INDUSTRIAL - Calgary
13% - Toronto
URBAN – OTHER
- Ottawa
20% - Montreal
VECTOM – RETAIL & MIXED-USE
14% of GLA is
Industrial
All figures as at June 30, 2021
(1) Excludes development properties and includes Canada Square at the
REIT’s one-half share.
(2) Urban: Population >100,000; Medium: Population 20,000 – 100,000;
Small: PopulationSTRATEGIC LOCATIONS
High traffic and
transit oriented
locations in growing
markets
Leslie & Sheppard Ave, Toronto, ON
Prime locations in urban centres
Dominant positions in secondary markets
12GROWTH
STRATEGIES
13GROWTH LEVERS
Uniquely positioned
CTC to leverage
Development Intensifications Third Party relationship with
Acquisitions
CTC and pursue
third party net lease
opportunities to
complement
organic growth
Embedded Organic Growth
1.5% 9.1 years
Annual rent escalations Weighted average remaining
(on average)(1) lease term(1)
(1) Canadian Tire leases as at June 30, 2021 14SOLID GROWTH PIPELINE
Development
923,000 square feet of ongoing development activity pipeline highlights
meaningful
266,000 square feet of incremental new investments announced in opportunities for
Q2 2021 future growth
Future redevelopment of Canada Square mixed-use property in
Toronto, ON
All figures as at June 30, 2021
15FINANCIAL
OVERVIEW
16STABLE AND RESILIENT ASSET BASE
96% 8.9 years
Property revenue is
reliable and
growing
Of annualized base minimum rent Weighted average
from investment grade tenants(1) remaining lease term(1)
1.5%
Annual rent escalations(2)
99.2%
Occupancy(1)
All figures as at June 30, 2021
(1) Occupancy and other leasing key performance
measures have been prepared on a committed
basis which includes the impact of existing
lease agreements contracted on or before
June 30, 2021
(2) Canadian Tire stores only (on average) 17LONG-TERM LEASE MATURITIES
Amongst the
longest weighted
average lease
terms in the sector
with minimal lease
rollovers over the
next 3 years
(1) Excludes Properties Under Development.
(2) Total base minimum rent excludes future contractual escalations.
(3) Canada Square is included at the REIT's one-half share of leasehold interest.
(4) Occupancy and other leasing key performance measures have been prepared on a committed basis which includes the impact of existing
lease agreements contracted on or before June 30, 2021.
18LEAN COST STRUCTURE
One of the lowest
cost structures in
the REIT sector
CTC leases triple net; base rent, operating costs (including insurance)
and capex paid by tenant
G&A as a percentage of revenues are 2.5%(1)
Internalized property management functions; any services provided by
CTC are on a cost recovery basis (2)
No fees paid to CTC for acquisitions, dispositions, intensifications or
financings
Continuing to increase efficiency through insourcing of certain service
providers
(1) As at June 30, 2021 and excluding fair value adjustments on unit-based awards
(2) Pursuant to Property Management and Services Agreement with Canadian Tire Corporation 19ORGANIZATIONAL STRUCTURE
Class A LP The REIT currently owns all of the outstanding
Units: Class A LP Units (voting). Public Unitholders
Class B LP CTC currently holds all of the outstanding Class B Units
Units: LP Units, which are economically equivalent to and
exchangeable for trust units. Unsecured
CT
Debentures
REIT
Class C LP CTC currently holds all of the outstanding Class C
Units: LP Units, which are long-term, fixed distribution
rate securities that currently serves as debt in the
REIT’s capital structure. Class D LP Class A LP
Canadian Tire
Units Units
Class D LP Unsecured debentures will be issued at the REIT
Class B
Units: level with the proceeds transferred to the LP in LP Units Class C
exchange for long-term, fixed distribution rate LP Units
securities. The Class D LP Units will rank ahead of Limited Partnership
the Class A and B LP Units and will be pari-passu
with the Class C LP Units. 100% Beneficial
Interest
Real Estate Assets
20INVESTMENT GRADE CAPITAL STRUCTURE
“BBB” Investment Grade(2)
CAPITAL STRUCTURE
AND LEVERAGE PROFILE (000’S) LIQUIDITY (000’S)
Indebtedness Ratio 41.6%
Market Capitalization(1) $3,805,204 Cash and Cash Equivalents $3,138
Interest Coverage Ratio
Class C LP Units (unsecured) $1,451,550 Availability on Credit Facilities $294,175 3.7x
Total Liquidity $297,313
Debt to EBITFV 6.7x
Debentures (unsecured) $1,071,067
Unencumbered Assets
Credit Facilities (unsecured) $41,200
Value Ratio 5.2x
Mortgages (secured) $65,701
Total capitalization $6,434,722
Cash and Cash Equivalents $3,138
Net Enterprise Value $6,437,860
All figures as at June 30, 2021
(1) Using the closing unit price of $16.38 and calculated on a fully-diluted (non-GAAP) basis
(2) Source: Standard & Poors and DBRS 21SOLID FINANCIAL METRICS
Strong and
improving credit
metrics
Low leverage
All figures as at Year End, except Q2 2021 which is Q2 2021 YTD
22DEBT
TOTAL DEBT (000’S)(1) Conservative
Capital Structure leverage
Class C LP Units (unsecured) $1,451,550 1% Mortgages
Debentures (unsecured) $1,071,067 1% Credit
Facilities Strong credit
Credit Facilities (unsecured) $41,200
17% Debentures metrics
Mortgages (secured) $65,701
22% Class C
TOTAL $2,629,518 LP Units
LIQUIDITY:
59% Equity(3)
Weighted average fixed interest/distribution rate of
3.86% during current term(2)
$300 million unsecured revolving bank credit facility
All figures as at June 30, 2021
(1) Includes indebtedness and aggregate par value of Class C LP Units held by CTC
(2) Excludes credit facilities
(3) June 30, 2021 Unit price used
23DEBT MATURITIES
Staggered debt
maturities
One of the longest
weighted average
terms to maturity in
the sector
No debt maturities until June 2022(1)
98% of total debt is unsecured; all unsecured debt is interest only
96% of total debt is fixed rate debt
Weighted Average Term to Maturity: 7.4 years
All figures as at June 30, 2021
(1) Excluding amounts drawn on the credit facilities
24INDUSTRY LEADING DEBT COVENANTS
Conservative
CT REIT's covenant package provides one of the best leverage profile
covenant protection packages for investors in the Canadian
real estate bond market
Class C LP Units are included in the leverage test
Interest coverage ratio of 3.7x includes distributions on Class C
LP Units and is amongst the highest in the industry
There is also a covenant limiting the amount of secured and
unsecured debt the LP can issue
All figures as at June 30, 2021 25GROWING FFO AND AFFO
Attractive record of
per unit growth
All figures as at Year End, except Q2 2021 (FFO and AFFO Q2 2021 YTD annualized and Book Value as of Quarter End)
(1) Total Units consist of REIT Units and Class B LP Units outstanding.
(2) Diluted Units used in calculating non-GAAP measures include restricted and deferred units issued under various plans and exclude the effect of
assuming that all of the Class C LP Units will be settled with Class B LP Units. 26OPTIMIZING DISTRIBUTION GROWTH OVER TIME
History of growing
distributions every
year since IPO
while conservatively
managing payout
ratio
Eight distribution increases, 24% compound growth since 2013 IPO
YTD Q2 AFFO Payout Ratio – 73.1%
Excess of AFFO over distributions – $69.1M(1)
(1) As at June 30, 2021 – Q2 2021 YTD annualized
27ENVIRONMENTAL,
SOCIAL AND
GOVERNANCE
28ESG AN IMPERATIVE FOR CT REIT AND CTC
CT REIT benefits
CT REIT’s approach to ESG is premised on developing and leveraging new and existing CT from CTC’s
REIT and CTC initiatives that support our commitment to: limit our environmental impact,
invest in our employees, contribute to Canadian communities, conduct our business honestly
leadership in
and with integrity, including in dealings with investors, tenants, suppliers and other sustainability and
stakeholders, and be transparent in how we govern ourselves. corporate
responsibility
As a net lease REIT, the primary goal of our sustainability strategy is to align with that of our
most significant tenant, CTC, to work together to further our respective sustainability
objectives. To date the focus has been on the reduction of GHG emissions and energy
consumption. In 2020, CTC avoided the use of 212,588 GJ of energy and 8,125 tonnes of
GHG emissions through efficiency projects(1). Continued efforts will focus on our commitment
to improving environmental and social outcomes.
Please see CTC’s sustainability page to review the 2020 Sustainability Performance Report:
https://corp.canadiantire.ca/English/sustainability/default.aspx
Canadian Tire Jumpstart Charities is the primary vehicle for fundraising and charitable giving
for the CTC family of companies. Canadian Tire Jumpstart Charities has provided funding to
more than 2 million kids to participate in sports, including funding for the development of
inclusive playgrounds for kids of all abilities.
(1) Energy consumption in GJ and GHG emissions in CO2 equivalent
29MAJORITY INDEPENDENT BOARD
TRUSTEES INDEPENDENT HIGHLIGHTS Committed to
David Laidley FCPA, FCA Yes Corporate Director
Former Chair, Deloitte
having a diverse
Chairman of the Board
Former Partner, Deloitte
Former Lead Director, Bank of Canada
array of experience,
Heather Briant Yes Corporate Director
skills and
Chair of Governance, Compensation Former SVP, Human Resources of Cineplex Inc.
perspectives,
and Nominating Committee
Yes
grounded in strong
Anna Martini FCPA, FCA Corporate Director
Chair of Audit Committee CFO and EVP of Finance, Club de Hockey Canadien Inc. governance
Former President, Groupe Dynamite Inc.
Former Partner, Deloitte
John O’Bryan Yes Corporate Director
Chair of Investment Committee Honorary Chairman, CBRE Limited
Former Managing Director, TD Securities
Kelly Smith Yes Corporate Director
Former CEO, Strathallen Capital Corp
Former Managing Director, Canada Operations, Kimco Realty
Corporation
Gregory Craig No EVP and CFO, Canadian Tire Corporation
Former President, Canadian Tire Financial Services
Former President and CEO, Canadian Tire Bank
Corporate Director
Dean McCann CPA, CA No Director of Canadian Tire Bank
Former EVP and CFO, Canadian Tire Corporation
Former President, Canadian Tire Financial Services Limited
Ken Silver No CEO, CT REIT
Member, Board of Governors, York University
30CORPORATE GOVERNANCE
Independent
Audit
Governance,
Compensation Investment
trustees decide on
Trustee Board
Committee and Nominating Committee all related party
Committee
matters
✔
Heather Briant ✔ (Chair) ✔
Gregory Craig ✔
David Laidley
✔ ✔ ✔
(Chair)
✔
Anna Martini ✔ (Chair) ✔
Dean McCann ✔ ✔
John O’Bryan ✔ ✔ ✔
(Chair)
Ken Silver ✔
Kelly Smith ✔ ✔ ✔
31APPENDIX:
CERTAIN
DEFINITIONS
AND NON-GAAP
MEASURES
32KEY TERMS OF PUBLIC DEBT ISSUANCE
Issuer: CT Real Estate Investment Trust
Form: Public offering via shelf prospectus and prospectus supplement
S&P: BBB
Ratings:
DBRS: BBB
Direct senior unsecured obligations of the REIT ranking equally and rateably with one another and with all other unsecured
Rank:
and unsubordinated indebtedness of the REIT
Unsecured debentures will be issued at the REIT level with the proceeds transferred to the LP in exchange for a newly
Class D LP Units: created class of preferred equity (“Class D LP Units”). The Class D LP Units will rank ahead of the Class A LP Units and
Class B LP Units and will be pari-passu with the Class C LP Units.
Optional redemption by the REIT at a price equal to the Canada Yield Price, which will have a par call in the last 3 months
Redemption:
of the term.
Key Covenants: • Maintain Consolidated EBITDA / Debt Service ≥ 1.50x
• Can only incur Indebtedness if:
A. (i) Consolidated Indebtedness (excluding any convertible Indebtedness) but including Class C LP Units /
Aggregate Adjusted Assets ≤ 60%, and
(ii) Consolidated Indebtedness (including, for certainty, any convertible Indebtedness) including the Class C
LP Units / Aggregate Adjusted Assets ≤ 65%; and
B. Consolidated Secured Indebtedness including unsecured debt of LP/ Aggregate Adjusted Assets ≤ 40%
• Maintain Unencumbered Aggregate Adjusted Assets / Consolidated Unsecured Indebtedness (excluding
Subordinated Indebtedness) ≥ 150%
Change of Control: 101% on change of control and rating downgrade below investment grade
33CERTAIN DEFINITIONS
As at any date means, as at the relevant Calculation Reference Date, the Aggregate Assets, provided that the component
amount thereof that would otherwise comprise the amount shown on the REIT’s balance sheet as ‘‘Investment properties’’
Aggregate Adjusted (or its equivalent) shall be instead calculated as the amount obtained by applying the Capitalization Factor as at such
Assets: Calculation Reference Date to determine the fair value of the REIT’s assets that would comprise ‘‘Investment properties’’ as
at such date, using the valuation methodology described by the REIT in its then most recently published annual or interim
financial statements or management’s discussion and analysis, applied consistently in accordance with past practice.
Of any person means (without duplication) (i) any obligation of such person for borrowed money (including, for greater
certainty, the full principal amount of convertible debt, notwithstanding its presentation under GAAP), (ii) any obligation of
such person incurred in connection with the acquisition of property, assets or businesses, (iii) any obligation of such person
issued or assumed as the deferred purchase price of property, (iv) any capital lease obligation of such person, and (v) any
obligations of the type referred to in clauses (i) through (iv) of another person, the payment of which such person has
guaranteed or for which such person is responsible or liable; provided that, (A) for the purpose of clauses (i) through (v)
(except in respect of convertible debt, as described above), an obligation will constitute Indebtedness of such person only to
Indebtedness:
the extent that it would appear as a liability on the consolidated balance sheet of such person in accordance with GAAP, (B)
obligations referred to in clauses (i) through (iii) exclude trade accounts payable, distributions payable to Unitholders,
accrued liabilities arising in the ordinary course of business which are not overdue or which are being contested in good
faith, deferred revenues, intangible liabilities, deferred income taxes, deferred financing costs, tenant deposits and
indebtedness with respect to the unpaid balance of instalment receipts where such indebtedness has a term not in excess of
12 months, and (C) Units, Class A LP Units, Class B LP Units, Class C LP Units and exchangeable securities do not
constitute Indebtedness.
Consolidated Consolidated Indebtedness as at any date means the consolidated Indebtedness of the Trust as at such date determined on
Indebtedness: a consolidated basis in accordance with GAAP and including Proportionate Consolidation Adjustments.
34CERTAIN DEFINITIONS
Consolidated Secured At any date means the Consolidated Indebtedness of the Trust that is secured in any manner by any Lien as at such date,
Indebtedness: determined in accordance with GAAP and including Proportionate Consolidation Adjustments.
Gross Book Value
Means at any time the total assets of the REIT as shown in its then most recent consolidated balance sheet.
(GBV):
As at any date means, as at the relevant Calculation Reference Date, the Aggregate Assets (excluding any amount relating
to assets that are Encumbered), provided that the component amount thereof that would otherwise comprise the amount
Unencumbered shown on a balance sheet as ‘‘Investment properties’’ (or its equivalent) shall be instead calculated as the amount obtained
Aggregate Adjusted by applying the Capitalization Factor as at such Calculation Reference Date to determine the fair value of the REIT’s assets
Assets: that would comprise ‘‘Investment properties’’ (excluding assets that are Encumbered) using the valuation methodology
described by the REIT in its then most recently published annual or interim financial statements or management’s discussion
and analysis, applied consistently in accordance with past practice.
35NON-GAAP MEASURES
“FFO” is a non-GAAP financial measure and has the meaning given to it in the White Paper on FFO &
AFFO. It is calculated as net income in accordance with GAAP, adjusted by removing the impact of: (i)
FFO: fair value adjustments on investment properties; (ii) other fair value adjustments; (iii) gains and losses on
the sale of investment properties; (iv) incremental leasing costs; (v) operational revenue and expenses
from right-of-use assets; and (vi) deferred taxes.
“AFFO” is a non-GAAP financial measure and has the meaning given to that term in Real property
Association of Canada’s white paper titled “White Paper on Funds From Operations & Adjusted Funds
from Operations for IFRS” (the “White Paper on FFO & AFFO”) issued in February 2019. It is calculated
AFFO:
as FFO subject to certain adjustments to remove the impact of recognizing property rental revenues or
expenses on a straight-line basis, and the deduction of a reserve for normalized maintenance capital
expenditures, tenant inducements and leasing commissions.
‘‘AFFO per Unit’’ is defined as AFFO divided by the number of Units outstanding where the total Units
consists of REIT Units and Class B LP Units outstanding. Total Units also includes diluted Units used in
AFFO per Unit:
calculating non-GAAP measures and include restricted and deferred units issued under various plans
and exclude the effect of assuming that all of the Class C LP Units will be settled with Class B LP Units.
“EBITFV” is a non-GAAP measure of a REIT”s operating cash flow and it is used in addition to IFRS net
income because it excludes major non-cash items (including fair value adjustments), interest expense
EBITFV
and other financing costs, income tax expense, losses or gains on disposition of a property, and other
non-recurring items that may occur under IFRS that management considers non-operating in nature.
36NON-GAAP MEASURES
FFO & AFFO Q2 2021 YTD Q2 2021
Net income and comprehensive income $178,628 $253,186
Fair value adjustment on investment property ($106,462) ($110,808)
GP income tax expense ($118) $545
Lease principal payments on right-of-use assets ($367) ($592)
Fair value adjustment of unit-based compensation $50 $402
Internal leasing expense $201 $362
Funds from operations $71,932 $143,095
Property straight-line rent revenue ($1,464) ($3,198)
Normalized capital expenditure reserve ($6,212) ($12,420)
Adjusted funds from operations $64,256 $127,477
Weighted average units outstanding – diluted (non-GAAP)(1) 232,149,611 231,787,508
FFO per unit – diluted (non-GAAP)(1) $0.310 $0.617
AFFO per unit – diluted (non-GAAP)(1) $0.277 $0.550
All figures as at June 30, 2021 and in thousands except number of units and FFO/AFFO per unit
(1) For the purposes of calculating diluted per unit amounts, diluted units include restricted and deferred units issued under various plans
and excludes the effects of settling the Class C LP Units with Class B LP Units
37NON-GAAP MEASURES
EBITFV INTEREST COVERAGE RATIO
Net income and comprehensive income $253,186 EBITFV $196,302
Interest Expense and Other
Fair value adjustment on investment $52,977
($110,808) Financing Charges
properties
Fair value adjustment on unit-based Interest Coverage Ratio 3.7x
$402
awards
Interest expense and other financing DEBT TO EBITFV
$52,977
charges
Total Indebtedness(1) $2,629,518
GP income tax expense $545
EBITFV(2) $392,604
EBITFV $196,302
Debt to EBITFV 6.7x
INDEBTEDNESS RATIO
Total Indebtedness(1) $2,629,518
Total Assets $6,320,435
Indebtedness Ratio 41.6%
All figures as at June 30, 2021 or for the 6-month period ended June 30, 2021 and in thousands
(1) Total indebtedness reflects the value of the Class C LP Units, mortgages payable, debentures and draws on the Credit Facilities
(2) Q2 2021 YTD EBITFV annualized 38You can also read