INTERRENT REIT INVESTOR PRESENTATION - January 2019
←
→
Page content transcription
If your browser does not render page correctly, please read the page content below
INTERRENT REIT
INVESTOR PRESENTATION

      January 2019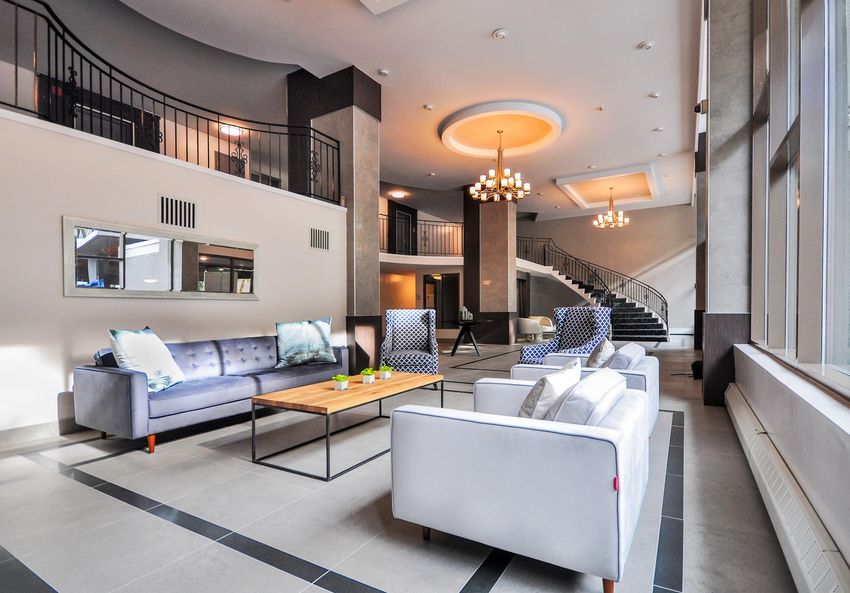
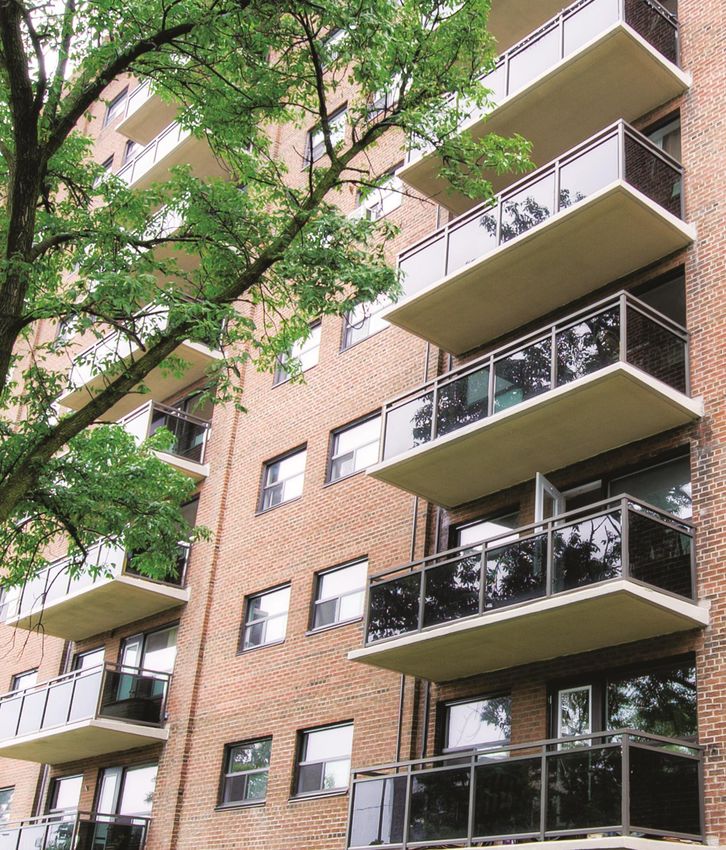
INTERRENT REIT IS A GROWTH-
ORIENTED REAL ESTATE
INVESTMENT TRUST ENGAGED IN
INCREASING VALUE AND CREATING
A GROWING AND SUSTAINABLE
DISTRIBUTION THROUGH THE
ACQUISITION AND OWNERSHIP OF
MULTI-RESIDENTIAL PROPERTIES.

FORWARD LOOKING STATEMENTS

      This presentation contains “forward-looking statements” within the meaning of applicable Canadian securities legislation.
      Generally, these forward-looking statements can be identified by the use of forward-looking terminology such as “plans”,
      “anticipated”, “expects” or “does not expect”, “is expected”, “budget”, “scheduled”, “estimates”, “forecasts”, “intends”,
      “anticipates” or “does not anticipate”, or “believes”, or variations of such words and phrases or state that certain actions,
      events or results “may”, “could”, “would”, “might” or “will be taken”, “occur” or “be achieved”. InterRent is subject to
      significant risks and uncertainties which may cause the actual results, performance or achievements to be materially
      different from any future results, performance or achievements expressed or implied by the forward looking statements
      contained in this release. A full description of these risk factors can be found in InterRent’s publicly filed information which
      may be located at www.sedar.com. InterRent cannot assure investors that actual results will be consistent with these
      forward-looking statements and InterRent assumes no obligation to update or revise the forward-looking statements
      contained in this presentation to reflect actual events or new circumstances.

157 Pearl | Hamilton

                                                                                                                        InterRent REIT | 2019   3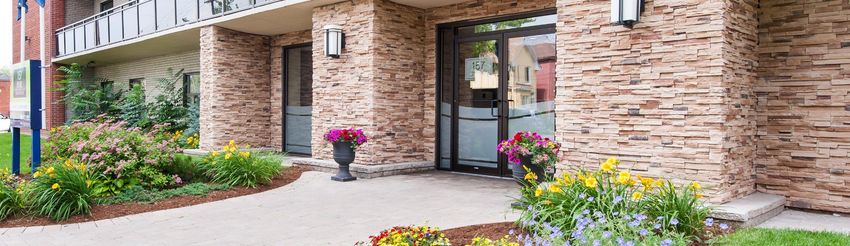
ABOUT INTERRENT

     ROADMAP TO THE PRESENT

• CLV arranges private             • Continued to grow NOI organically             • Completed LIV redevelopment
  placement at $1.50/Unit            through top line growth and operating         • Continued focus on repositioning and organic growth
• Change of executive control        cost reductions
                                                                                   • Purchased 1,702 suites in 2015, 545 suites in 2016, 602
  September 30, 2009               • Built acquisitions team and grew                suites in 2017 and 638 suites in 2018
• CLV Group begins managing          acquisition pipeline – focus on value-add
                                     properties                                    • Change model/staffing of rental operations to focus on
  InterRent’s entire portfolio                                                       customer service and overall performance
• Began rebuilding &               • Purchased 1,000 suites in 2012, 1,339
                                                                                   • Continued to refinance repositioned properties with
  repositioning                      suites in 2013 and 645 in 2014
                                                                                     CMHC to capitalize on low interest rates
• Changed culture & priorities     • Expanded into Quebec (Gatineau &
                                     Montreal)                                     • Increased distribution by 5% ($0.22 to $0.23) in 2015,
• Restored focus on property                                                         by 5% ($0.23 to $0.24) in 2016, by 11% ($0.24 to $0.27)
  operations                       • Focused on best in class within our target      in 2017 and again by 7% ($0.27 to $0.29) in 2018
                                     markets
• Disposed of non-core                                                             • Entered into joint venture for development of 900
  properties                       • Refinanced repositioned properties with         Albert Street
                                     CMHC insured mortgages
• Focused on growing NOI                                                           • Internalized property management in 2018
  organically through top line     • Increased distribution by 33% ($0.12 to
  growth and operating cost          $0.16) in 2012, by 25% ($0.16 to $0.20) in
  reductions                         2013 and by 10% ($0.20 to $0.22) in 2014
                 DISTRIBUTION
                                 +33%            +25%                +10%         +5%             +5%                +11%             +7%
                  INCREASES
                                                                                                                                               $13.33            Start       September 30, 2009

                                                                                                                                                                  End       As at January 18, 2018

                                                                                                                                                            Unit Price      $1.50 to $13.33
                                                                                                                                                          Cumulative
                                                                                                                                                         Distributions              $1.78

                                                                                                                                                         Total Return               979%
                                                                                                                                                           Number of     4,033 to
                                                                                                                                                                                            128%
                                                                                                                                                              Suites      9,202

                                                                                                                                                        Since current management took over,
                                                                                                                                                        InterRent has been one of the best
                                                                                                                                                        performing REITs in Canada with a total
                                                                                                                                                        return of 979%. InterRent continues to
                                                                                                                                                        focus on organic growth of existing
                                                                                                                                                        properties, target new properties to
                                                                                                                                                        reposition, as well as acquisitions of
                                                                                                                                                        properties with untapped value.

                                                                                                                                                                         InterRent REIT | 2019       4
ABOUT INTERRENT

           WE ARE PROVIDERS OF HOMES ACROSS ONTARIO AND QUEBEC

                                                                                                                             2

                                                                                                          2
                                       1

       1

           1                            1
                                                                                                                                                2

                                       1

                                                           Primary Market                      Secondary Market    Sold in January 2019
                                                           7,742 Suites                        1,460 Suites        349 Suites
Our primary markets make up
more than 80% of our NOI

  1   CMHC Fall 2018 Rental Market Report apartment universe.
  2   Includes unconditional deal to acquire portfolio of 253 suites in Montreal expected to close mid-February.
                                                                                                                              InterRent REIT | 2019   5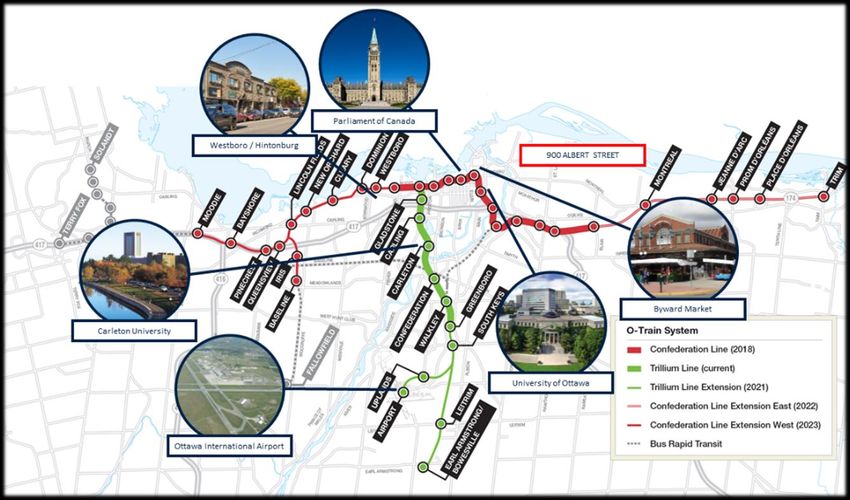
GROWTH POTENTIAL

                PROVEN ABILITY TO SOURCE DEALS

  Proven track record of sourcing acquisitions, with over $900 Million in acquisitions since change of control (over 6,900 units).1

  Continued pipeline of potential properties through solid relationships and proprietary lead generation database.

     5501 Adalbert, Montreal                                                             1111 & 1121 Mistral, Montreal
       Forest Ridge, Ottawa
    Britannia Portfolio, Ottawa
                                                      545 Suites                             3 East 37th, Hamilton
                                                                                                                                    638 Suites                  Montreal Portfolio1
                                                                                      2121 & 2255 Saint Mathieu, Montreal
 181 Lebreton & 231 Bell, Ottawa                                                            78 Lawrence, Hamilton
 Stoney Creek Portfolio, Hamilton
    Maple & Brant, Burlington
                                                       2016                                                                           2018
              2015                                                                               2017                       5775 Sir Walter Scott, Montreal         2019
                                                                                                                                1-3 Slessor, Grimsby
                                                                                                                               236 Richmond, Ottawa
                                                  1101 Rachel, Montreal                                                         381 Churchill, Ottawa
           1,702 Suites                           Parkway Park, Ottawa                           602 Suites                   10 Ben Lomond, Hamilton              253 Suites
                                                                                                                                625 Milton, Montreal
                                                                                                                              3474 Hutchison, Montreal
                                                                                                                               1170 Fennell, Hamilton

Riviera, Gatineau                                                         5550 Trent, Montreal                                  Crystal Beach, Ottawa
                                                                                                                                                              InterRent REIT | 2019   6
 1   Includes unconditional deal to acquire portfolio of 253 suites in Montreal expected to close mid-February.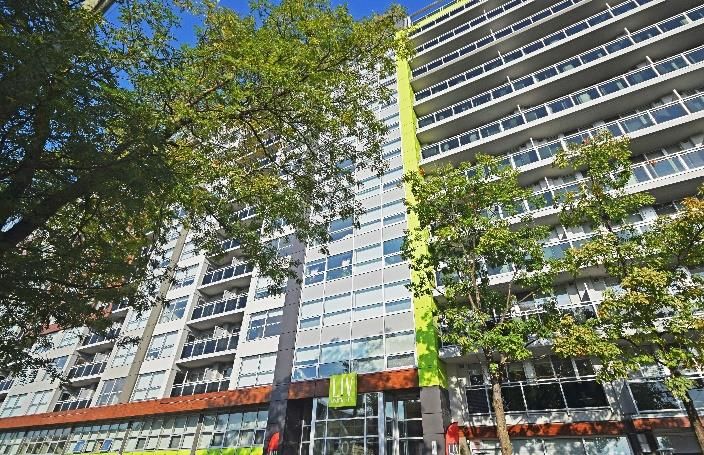
PORTFOLIO MANAGEMENT

         VALUE ADD STRATEGY

                                                              Acquisitions/Development
                                                •   Acquire properties that have untapped value that can be
                                                    realized through the REIT’s repositioning strategy
                                                •   Develop properties in our target growth areas

 Recycling and                                                                                                         Customer Service
 Allocation of Capital                                                                                                 Offer an unsurpassed customer
 •   Regularly review the properties within                                                                            experience by:
     the portfolio to determine the most                                                                               • Multi-channel communication stream
     efficient and effective use of capital                                                                            • Dedicated customer advocates
 •   Refinance at more favourable                                                                                      • Tracking and reporting to senior
     rates/terms                                                                                                          management of customer concerns
 •   Disposition of non-core assets                                                                                       and feedback
                                                                                                                       • Creating a sense of community

                                                                        Our People
                                                                       Hiring excellence,
                                                                      providing constant
Cost Reduction and Containment                                        training and career                     Driving and Enhancing Revenue Streams
Implement energy-efficient utility programs to lower                     advancement                          Continuously search for new revenue streams as well
operating costs while utilizing government programs to                                                        as ways to grow existing ones.
leverage investment dollars.                                                                                  • Increase rents on turnover through exterior,
• Replace old boilers, domestic hot water heaters,                                                               common area and in-suite improvements
   water fixtures and lighting fixtures                                                                       • Securing additional streams of income through
• Conversion of domestic hot water heaters from                                                                  rooftop leases and revenue sharing agreements
   electric to gas                                                                                            • Growing the rental revenue base organically while
• Implement hydro submetering programs                                                                           at the same time improving its stability
• Focus on preventative maintenance                                                                           • Increased focus on parking and ancillary revenue
• Reduce customer turnover by providing better                                                                • Adding suites within under-utilized space
   customer service

                                                                                                                                             InterRent REIT | 2019   7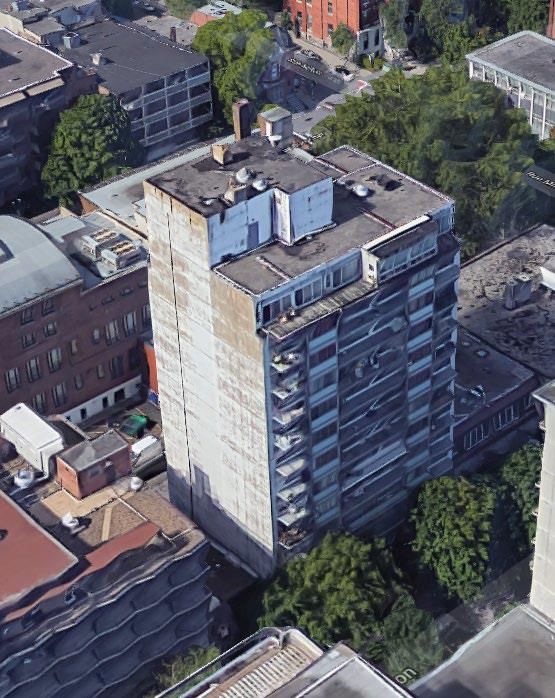
PORTFOLIO MANAGEMENT

     FOCUS ON REPOSITIONING

                                                             Before   After
EXTERIOR UPGRADES

                               5220 Lakeshore | Burlington
• Complete, attractive first
  impression package
• Designer-influenced
  exterior finishes

COMMON AREA
UPGRADES
                               New Street | Burlington

• Added functionality
• Designer finishes
• Enhanced security

UNIT UPGRADES
• Improving suite layout
• Upgraded bathrooms and
  kitchens
• Upgraded flooring
                               LIV | Ottawa

                                                                              InterRent REIT | 2019   8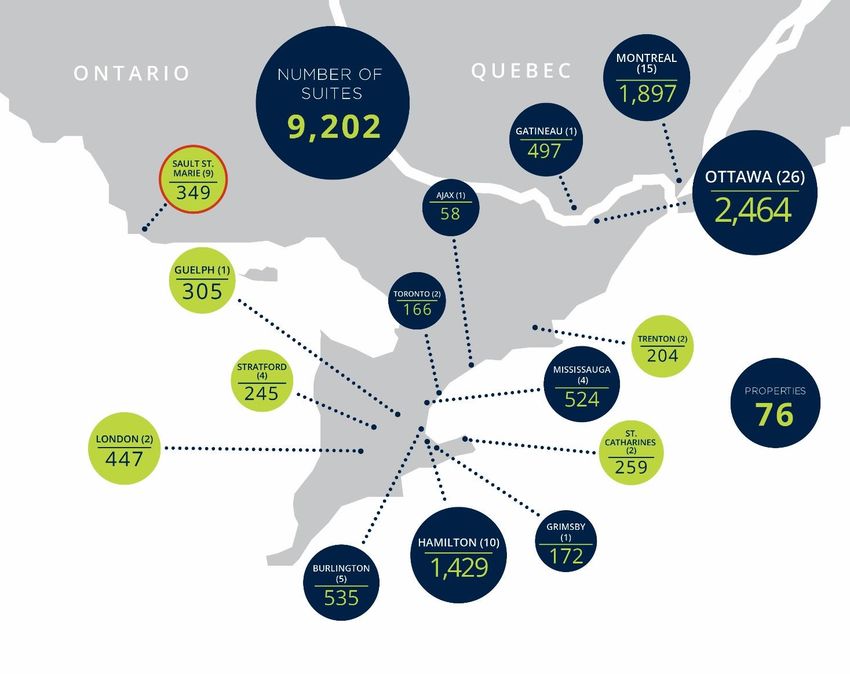
VALUE CREATION

2014 ACQUISITIONS

                                                          As at Acquisition         As at 2018 Q3
                 Acquisition Cost                             $76,011,767
                 Capital Invested                                                        $27,506,696
                 Acquisition Cost Plus Capital Invested                                 $103,518,463
                 Net Revenue                                    $7,347,268               $10,172,080
                 Operating Costs                                $3,426,507                $3,464,952
                 NOI                                            $3,920,761                $6,707,128         71%
                 NOI Margin                                            53%                       66%
                 Cap Rate                                             5.2%                      6.5%
                 Total Suites                                          645                       645
                 Current Cap Rate                                                               4.3%
                 Fair Value Today                                                       $157,100,000
                 Value Creation                                                          $53,581,537
                 Value per Suite                                   $117,848                 $243,566       107%

                  Tindale-Quigley | Hamilton               Crystal Beach East| Ottawa
                                                                                                    InterRent REIT | 2019   9
KEY FINANCIAL METRICS

 PROVEN TRACK RECORD OF SUCCESS

        Effective use of capital through:
          Smart disposition of properties
          Recycle capital from dispositions fully into repositionings
          Capitalize on low interest rate environment

                                                                TOTAL ASSET GROWTH

                                                                                                                                                    1
                                                                                                                                        1        68%
  $2,200,000                                                                                                                         66%                      $0.50
                                                                                                                        69%
  $2,000,000                                                                                             72%                                                  $0.45
                                                                                           73%
  $1,800,000                                                                                                                                                  $0.40
                                                                             63%
  $1,600,000                                                   51%                                                                                            $0.35
  $1,400,000                                       92%
                                   300%                                                                                                                       $0.30
                        100%
  $1,200,000
                                                                                                                                                              $0.25
  $1,000,000
                                                                                                                                                              $0.20
       $800,000
       $600,000                                                                                                                                               $0.15

       $400,000                                                                                                                                               $0.10
       $200,000                                                                                                                                               $0.05
            $0                                                                                                                                                $0.00
                     01-Jan-10   31-Dec-10     31-Dec-11    31-Dec-12     31-Dec-13    31-Dec-14      31-Dec-15      31-Dec-16     31-Dec-17   30-Sep-18

                  Liabilities       Unitholders' Equity         Distributions/unit          FFO Per Unit (Diluted)            FFO/Unit CAGR       AFFO Payout Ratio

1TTM   AFFO for 2017 & 2018 calculated in accordance to Realpac definition. Prior years calculated differently.                                InterRent REIT | 2019   10
KEY FINANCIAL METRICS
GROWTH IN ALL THE RIGHT PLACES
TTM at 30-
In $000s, except as noted 2010 2011 2012 2013 2014 2015 2016 2017
Sep-18
Total Suites 3,998 3,820 4,695 6,048 6,700 8,389 8,059 8,660 9,235
Occupancy Rate 96.3% 96.6% 97.8% 96.4% 96.1% 94.6% 94.8% 97.9% 95.8%
Average Rent Per Suite $805 $843 $887 $931 $965 $996 $1,064 $1,110 $1,176
Operating Revenues $35,352 $38,471 $47,530 $60,506 $65,404 $82,977 $97,466 $109,004 $122,934
Net Operating Income (NOI) $15,913 $20,506 $27,946 $36,041 $37,884 $48,490 $56,868 $66,166 $78,262
NOI % 45.0% 53.3% 58.8% 59.6% 57.9% 58.4% 58.3% 60.7% 63.7%
Funds from Operations (FFO) $232 $4,300 $13,489 $18,883 $18,836 $24,425 $27,796 $34,662 $41,990
FFO Per Unit (basic) $0.01 $0.13 $0.31 $0.35 $0.33 $0.35 $0.39 $0.43 $0.45
Adjusted Funds from Operations (AFFO) $1,135 $4,343 $11,748 $16,278 $16,189 $21,145 $24,170 $30,5701 $36,7281
AFFO Per Unit (basic) $0.04 $0.13 $0.27 $0.30 $0.28 $0.31 $0.34 $0.381 $0.391
Debt to GBV 58.3% 48.5% 46.8% 47.4% 52.7% 54.2% 55.3% 47.8% 39.1%
Elmridge | Ottawa
1TTM AFFO for 2017 & 2018 calculated in accordance to Realpac definition. Prior years calculated differently.
InterRent REIT | 2019 11KEY FINANCIAL METRICS
A PROVEN APPROACH TO MANAGING THE BALANCE SHEET
Hamilton Landing | Trenton
MORTGAGE SCHEDULE
Mortgage &
Debt Balance Weighted Weighted
(000s) Average by Average
Year Maturing 30-Sep-18 Maturity Interest Rate
2018 $41,751 5.1% 3.77%
2019 $52,242 6.4% 3.30%
2020 $96,573 11.8% 2.95%
700 Ross | Burlington
2021 $52,951 6.5% 3.53%
2022 $71,897 8.8% 2.83%
Thereafter $504,306 61.5% 2.88%
Total $819,720 100.0% 2.97%
INTEREST COVERAGE 2.85x
939 Western | London
DEBT SERVICE COVERAGE 1.80x
DEBT TO GBV
30-Sep-18
39.1%
InterRent REIT | 2019 12INTERRENT REIT
EXECUTIVE TEAM
PAUL AMIRAULT PAUL BOUZANIS
BOARD
Trustee Trustee
RONALD LESLIE MIKE MCGAHAN “Good teams become great ones when the
Trustee Trustee members trust each other enough to
surrender the Me for the We”
CHERYL PANGBORN VICTOR STONE
Trustee Trustee - PHIL JACKSON
MIKE MCGAHAN Property Management
Operations
Chief Executive Officer
Acquisitions
& Trustee Development
Syndications
Brokerage
BRAD CUTSEY, CFA Capital Markets / Investor Relations
Research & Financial Modeling
President Our success is dependent on our
Acquisitions
Property Management team members. The InterRent team
INTERRENT REIT
Strategic Management
has a proven track record of creating
100+ Years value through repositioning rental
CURT MILLAR, CPA, CA Corporate Finance
Chief Financial Officer Accounting & Financial Reporting Combined properties, providing both the
Experience
Operations Management experience and ability necessary to
Acquisitions
Business Development continue to grow and improve the
Process & Systems Optimization REIT while creating value for our
unitholders.
DAVE NEVINS Property Management
Operations
Chief Operating Officer
Construction
BRIAN AWREY, CPA, CA Financial Reporting
Corporate Finance
Vice President
Accounting
InterRent REIT | 2019 13APPENDIX LIV | Ottawa InterRent REIT | 2019
INTERRENT REIT IN THE NEWS

           RECENT EVENTS

                                        “Ticking All of the Right Boxes”
                                                                  - Michael Smith, RBC Capital Markets
                                                                                                        October 30, 2018

                      “Strong Fundamentals Drive Solid Cash Flow Growth”
                                                                 - Mark Rothschild, Canaccord Genuity
                                                                                                         August 14, 2018

                      “Maintaining Outperform on Rent Growth Potential”
                                                                  - Troy MacLean, BMO Capital Markets
                                                                                                           May 16, 2018

               “Adjusting Estimates After $98 mln Offering; Maintain Strong Buy”
                                                                           - Ken Avalos, Raymond James
                                                                                                         March 29, 2018

Britannia | Ottawa                        LIV | Ottawa                     5220 Lakeshore| Burlington     InterRent REIT | 2019   15
ANALYSTS’ RESEARCH
PRICE TARGETS & NAV/UNIT ESTIMATES
Target NAV/Unit NAV/Unit
Broker Date Rating
Price Estimate Cap Rate
BMO Capital
30-Oct-18 Outperform $13.50 $11.30 4.25%
Markets “Another Strong Quarter: Very strong fundamentals continued to
Canaccord produce strong organic growth, with SPNOI up +12.4% in Q3, the fifth
30-Oct-18 Buy $13.50 $12.20 4.50% quarter in a row of SPNOI growth >10%. This is the 16th consecutive
Genuity
quarter of SPNOI growth above +4% (~8.6% average).”
CIBC World
30-Oct-18 Neutral $13.00 $11.75 4.50% - Troy MacLean, BMO Capital Markets
Markets
October 31, 2018
Desjardins
30-Oct-18 Buy $13.50 $11.30 4.40%
Capital Markets “IIP delivered solid 3Q18 results and is rewarding investors with a 7.4%
Echelon Wealth distribution increase. The most important takeaway this quarter, in our
18-Jan-19 Buy $14.50 $11.40 4.40% view, is the accelerating same-property AMR growth trend and recent
Partners
occupancy improvement. Strong fundamentals in IIP’s core markets
GMP Securities 30-Oct-18 Hold $12.50 $10.90 4.40% should remain a tailwind through 2019.”
- Michael Markidis, Desjardins
Industrial October 30, 2018
Alliance 15-Jan-19 Hold $14.00 $10.75 4.50%
Securities “Our view: InterRent delivered strong Q3 results, with double-digit
Laurentian Bank SPNOI and NAV growth. Thematically, the REIT continues to tick all of
31-Oct-18 Buy $14.00 $11.70 4.60% the right boxes, with solid execution on key initiatives, progress
Securities
lowering its leverage, and robust operating tailwinds in the apartment
Sector sector. With a confident outlook, the Board also announced a 7%
NBF 31-Oct-18 $12.50 $11.40 4.40%
Perform annual distribution bump—its seventh consecutive increase of 5%+.
Price target +$1 to $13. Reiterating Outperform.”
Raymond James 30-Oct-18 Strong Buy $14.00 $11.00 NA
- Michael Smith, RBC Capital Markets
RBC Capital Sector October 30, 2018
2-Jan-19 $13.50 $11.00 4.40%
Markets Perform
Sector
Scotiabank GBM 31-Oct-18 $13.50 $11.75 4.50%
Outperform
TD Securities 31-Oct-18 Buy $14.00 $11.40 4.20%
Average $13.54 $11.37 4.42%
InterRent REIT | 2019 16EXTERNAL GROWTH
3474 Rue Hutchison, MONTREAL
Property Overview
3474 Hutchison is a 13 storey building located steps away from Montreal’s downtown
core. The property, constructed in 1964, is located less than 400m away from the city’s
Place-des-Arts Metro station on the Green Line. The property is also within close
proximity to the McGill University Campus, which is a mere 5 minute walk.
7
8
2
A
1 7
4
3
10
9
6
B
Suite Count 77
Purchase Price $15,737,932 3474 Rue Hutchison 7 Université du Québec à Montréal
Station Place-des-Arts Metro 8 Provigo Supermarket
Price per Suite $204,389 1 McGill University
9 Centre Bell – Entertainment Complex
2 Montreal Neurological Institute & Hospital
10 Montreal General Hospital
3 Central Business District
A 625 Rue Milton
4 Montreal Eaton Centre
B 2121 & 2255 Rue Saint-Mathieu
5 Access to Mont Royal
InterRent REIT | 2019 17
6 Concordia UniversityEXTERNAL GROWTH
625 Rue Milton, MONTREAL
Property Overview
625 Milton is an 18 storey building located steps away from Montreal’s downtown core.
The property, constructed in 1965, is located less than 700m away from the city’s Place-
des-Arts Metro station on the Green Line. The property is also within close proximity to
the McGill University Campus, which is a mere 2 minute walk.
7
8
A
2
1 7
4
3
10
9
6
B
Suite Count 138
Purchase Price $28,542,068 625 Rue Milton 7 Université du Québec à Montréal
Station Place-des-Arts Metro 8 Provigo Supermarket
Price per Suite $206,827 1 McGill University 9 Centre Bell – Entertainment Complex
2 Montreal Neurological Institute & Hospital 10 Montreal General Hospital
3 Central Business District A 3474 Rue Hutchison
4 Montreal Eaton Centre B 2121 & 2255 Rue Saint-Mathieu
5 Access to Mont Royal InterRent REIT | 2019 18
6 Concordia UniversityEXTERNAL GROWTH
1170 Fennell Avenue East, Hamilton
Property Overview
1170 Fennell Avenue East is located on the Hamilton Mountain near Upper Ottawa
Street and Mountain Brow Boulevard. The 63 unit apartment building provides
accessible public transportation nearby, along with multiple schools, shopping and
community centres for tenants.
3
1
2
7
6
5
Suite Count 63
Purchase Price $7,900,000 1170 Fennell Avenue East 5 Huntington Park Recreation Centre
1 Sherwood Secondary 6 Huntington Park School
Price per Suite $125,397 2 École Élémentaire Pavillon de la 7 Fay Avenue Park
Jeunesse
3 Metro Grocery Store
4 TD Canada Trust
InterRent REIT | 2019 19EXTERNAL GROWTH
Montreal Portfolio
Property Overview
This portfolio is comprised of 5 properties in three neighbourhoods in Montreal. The
Westmount properties, located at 4560 Sainte-Catherine St W and 2054 Claremont
Avenue, are in close proximity to the new McGill University Health Centre Hospital and
the Vendome metro station. The properties are also minutes away from Westmount's
main retail node that includes banks, restaurants and grocery stores. The Hampstead
properties, 5051 Clanranald Avenue and 5015-5025 Clanranald Avenue, are situated off
the popular and retail-oriented Queen Mary Road and within walking distance of
McDonald Park. These properties allow for quick access to the Décarie Expressway and
the Snowdon metro station which are less than 600 metres away. Finally, 6950 Fielding
Avenue in Notre-Dame-de-Grâce is adjacent to the large Loyola Park and located within
close proximity of Concordia University's Loyola Campus.
3
5 1
C
D A
7
B
3 2
4
E
Suite Count 253
6
Purchase Price $59,000,000 4560 Sainte-Catherine St W
A 2 McGill University Health Centre
B 2054 Claremont Ave 3 Access to Major Highways
Price per Suite $233,202 C 5051 Clanranald Ave 4 Metro Grocery Store
D 5015-5025 Clanranald Ave 5 Hampstead Retail and Restaurants
E 6950 Fielding Ave 6 Concordia University – Loyola Campus
Metro Station 7 Westmount Retail and Restaurants
1 Westmount High School
InterRent REIT | 2019 20EXTERNAL GROWTH
TRANSFORMATIONAL DEVELOPMENT IN OTTAWA
5
2
1 3
4
900 Albert Street – Development Site
1 Bayview Station – LRT Trillium and
Confederation Intersection
2 LeBreton Flats Development – 6 min
walk (500m)
3 City Centre Complex – 1 min walk
(100m)
4 Little Italy – 10 min walk (850m)
5 Ottawa River Pathway (biking and
walking) – 5 min walk (400m)
Conveniently located at the southwest corner of Albert Street and City Centre Avenue, the new development will access a direct
pedestrian link to the Bayview Light Rail Transit Station, the only intersection of the Confederation and Trillium Lines. The diverse spaces
draw people and business from key downtown neighbourhoods.
Potential for up to:
• 130,000 sq ft of retail space
• 200,000 sq ft of office space
• 1,150,000 sq ft (1,400 suites) of residential space
InterRent REIT | 2019 21CASE STUDIES
VALUE CREATION
2386 & 2400 NEW STREET
BURLINGTON, ONTARIO
Conveniently situated in the Roseland area
2386 & 2400 New Street
in Burlington, 2386 & 2400 New Street Overview
offers spacious one, two, and three
bedroom suites with scenic views of Lake Total Suites 238
Ontario.
This property has received extensive Investment Highlights
capital investment over the past three
years including new landscaping, new Burlington,
Location
balconies, upgraded kitchens and flooring Ontario
in many suites, energy efficient lighting, a
new gym and a media room. There have Investment
79 Months
also been added 8 suites to this property. Timeframe
Since acquisition in March 2012, average
Purchase Price $20.7M
rent on the suites which have been turned
over has increased 59% from $1,034 to
$1,644. NOI has increased 151% from Expected IRR 50%+
$1,313,832 to $3,299,004. The expected
IRR is based on the IFRS value at
September 30, 2018 is over 50%. Equity Multiple 6.0x
InterRent REIT | 2019 22CASE STUDIES
VALUE CREATION
2757 BATTLEFORD ROAD
MISSISSAUGA, ONTARIO
2757 Battleford is located adjacent to Lake 2757 Battleford Overview
Aquitaine and at the corner of Erin Mills Parkway
and Battleford Road in Mississauga. Including our
Suites 184
adjacent property at 6599 Glen Erin Drive, the
combined site has a land mass of approximately
420,750 square feet (9.66 acres).
Investment Highlights
Substantial capital improvements have been
made to these properties including new hard &
Investment
soft landscaping, new entrance and lobby, hydro 76 Months
Timeframe
submetering, new elevators and energy efficient
lighting. Purchase Price $23.9M
Since acquisition in June 2012, average rent on
the suites which have been turned over at 2757 Expected IRR 25%+
Battleford has increased 40% from $1,151 to
$1,606. NOI has increased 68% from $1,462,650 Equity Multiple 4.3x
to $2,461,551. The expected IRR based on the
IFRS value at September 30, 2018 is over 25%.
InterRent REIT | 2019 23CASE STUDIES
VALUE CREATION
BRITANNIA PORTFOLIO
OTTAWA, ONTARIO
InterRent purchased this 286 unit portfolio in Britannia Portfolio Overview
2015. The average purchase price was $97,028
per unit overall, which the REIT believes was well Suites 286
below market value.
Unit types consist of apartments, duplexes and
semi-detached homes and are located along
Investment Highlights
Britannia Park and the waterfront of the Ottawa
River. Investment
41 Months
Timeframe
The average rent for the suites which have
turned over since the acquisition of this portfolio Purchase Price $28.1M
in April 2015 is $1,272. This is an increase of
51% from the average rent for this same group
Expected IRR 40%+
of suites at acquisition of $844. Capital
improvements at these properties include
Equity Multiple 3.2x
recladding of exteriors, new windows, new
landscaping, intercom and security systems new
laundry rooms, energy efficient lighting,
upgraded boilers and renovated kitchens on
turnover.
The expected IRR based on the IFRS value at
September 30, 2018 is over 40%.
InterRent REIT | 2019 24VALUATION
CANADIAN APARTMENT REITS: IN LINE WITH HISTORICAL VALUATIONS
Historical Price / Consensus AFFO
32.0x
24.0x
16.0x
8.0x
Jan-98 Jan-00 Jan-02 Jan-04 Jan-06 Jan-08 Jan-10 Jan-12 Jan-14 Jan-16 Jan-18
Cdn P/FTM AFFO US P/FTM AFFO Cdn P/FTM AFFO Hist. Avg US P/FTM AFFO Hist. Avg
Historical AFFO Yield Spread
12.0%
5.0%
(2.0%)
Jan-98 Jan-00 Jan-02 Jan-04 Jan-06 Jan-08 Jan-10 Jan-12 Jan-14 Jan-16 Jan-18
Cdn AFFO Yield Spread US AFFO Yield Spread Cdn AFFO Yield Spread Hist. Avg US AFFO Yield Spread Hist. Avg
Source: S&P Global Market Intelligence.
InterRent REIT | 2019 25VALUATION
INTERRENT’S PAYOUT RATIO: REMAINS CONSERVATIVE
2019E AFFO Payout Ratio
105.2%
91.6%
79.1% 74.7% 72.2% 66.8% 66.0%
58.7% 53.4%
NA
BEI.
MRG
KMP.
MEQ
M.U
IIP.U
MI.U
NVU.
RUF.
CAR.
UN
HO
.UN
UN
UN
UN
N
U
N
Distribution Yields
2020 Fully
7.0% 6.1% 8.2% 6.1% 5.2% 4.2% 5.3% 4.1% 3.6% 6.6%
Distributed Yield
Distributed Yield 2019 Fully Distributed Yield
7.8%
6.8%
6.2% 6.0% 6.1% 6.3%
5.7% 5.6%
4.9% 4.7%
4.0% 3.9% 3.9% 3.8%
2.9% 3.3%
2.5% 2.2% 2.2%
0.0%
NVU.UN RUF.U HOM.U MRG.Un KMP.UN CAR.UN BEI.UN MI.UN IIP.UN MEQ
Figures based on consensus estimates as at January 18, 2019.
Source: S&P Global Market Intelligence.
InterRent REIT | 2019 26VALUATION
INTERRENT’S PEG RATIO: AT A DISCOUNT RELATIVE TO ITS PEERS
Price / Consensus AFFO
PEG Ratio (1) 2.3x N/A 2.9x 1.5x 2.2x 1.1x 2.1x 1.5x 1.6x N/A
P/2019E AFFO P/2020E AFFO
30.7x
28.1x 26.2x 24.6x 25.4x 24.0x
21.1x 20.5x 19.4x
19.0x 17.4x 16.4x 16.3x 16.3x 15.9x 15.1x 14.7x 14.3x 12.9x 12.1x
IIP.UN MI.UN CAR.UN BEI.UN KMP.UN RUF.U MRG.UN MEQ NVU.UN HOM.U
Price / Consensus NAV
116%
104% 104% 101% 99%
87% 84% 80% 77% 76%
BEI.
ME
U.U
P.U
G.U
R.U
UN
F.U
UN
HO
MI.
IIP.
KM
RU
MR
UN
CA
NV
M.
Q
U
N
N
N
N
Figures based on consensus estimates as at January 18, 2019.
Source: S&P Global Market Intelligence.
(1) PEG Ratio = P/AFFO ('19E) / CAGR of AFFO ('18P-‘20E) + current yield
InterRent REIT | 2019 27WHY MULTI-FAMILY?
VERY DEFENSIVE ASSET CLASS
• Multi-family properties known as safest real-estate asset class
• Steady and stable rent increases enabled by short term lease durations
• Lower cost mortgage financing with CMHC insurance and mortgage renewal risk
mitigated
• Acquisitions at a discount to replacement cost
Stable Multi-Family Fundamentals
Multi-Family assets have experienced less volatile changes in vacancy and more
stable Y/Y rent growth over the past 30 years relative to other real estate sectors
Historical Vacancy Historical Y/Y Rent Growth
45%
20%
30%
16%
15%
12% 0%
-15%
8%
-30%
4% -45%
0% -60%
1986 1991 1996 2001 2006 2011 2016 1986 1991 1996 2001 2006 2011 2016
Apts Retail Office Industrial Apts Retail Office Industrial
Source: CBRE. InterRent REIT | 2019 28You can also read