2018 Outlook Edition - BB&T Perspectives Magazine
←
→
Page content transcription
If your browser does not render page correctly, please read the page content below

2018 Outlook Edition
  bbtperspectives.com/2018-outlook-edition/

                                                                                  January 22, 2018

January 2018

    “Forecasts may tell you a great deal about the forecaster; they tell you nothing
    about the future.”
    Warren Buffett

Each December, Barron’s magazine writes an Outlook edition for the year ahead where
market prognosticators forecast year-end target prices for the S&P 500 Index, similar to
picking the Super Bowl winner. This year’s forecasts predicted the 2018 year-end target price
to land somewhere between 3,100 and 2,675 (2,802 at press time). In this edition of Market
Monthly, we share our 2018 Outlook with you to help navigate the year ahead, but we’ll resist
the temptation to make a market call. We focus on key themes to provide you with objective
guidance to keep your portfolio’s compass true north.

Summary:
                                                                                                     1/12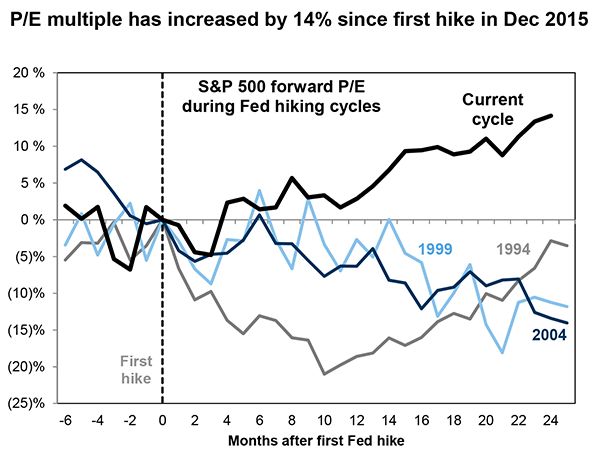
The Economy: Three Rs characterize the economic phases of the past nine years since the
great financial crisis are: Repair, Recovery and Reflation. Global financial systems have been
repaired. Central banking authorities like the Fed have provided a path back to a normal
business cycle and financial recovery. Reflation is a common theme of strong late cycle
recoveries like we have now. Strong global economic growth has continued into 2018 with no
signs of recession. The Federal Reserve remains on their quarterly rate hike path while the
economy is strong to be better prepared for future slowdowns. Tax cuts are expected to add
roughly 0.5 percent to gross domestic product (GDP) growth until rising rates begin to impact
financial asset prices.

Equity Markets: Many of the same factors that led us to favor equities over bonds in 2017
remain in place today. Bulls argue a strong economy and tax reform tailwinds will fuel
corporate earnings and propel global markets. Bears argue high valuations and excessive
optimism may lead to rising risks. We think both are right to a degree and see equities
transitioning from a steep return/flat volatility regime to a modest return/rising volatility regime
as 2018 progresses. We think international markets could lead the way again in 2018.

Bond Markets: Rising inflation expectations have recently nudged Treasury yields higher.
Municipal bonds and investment-grade corporate bonds remain preferred areas with high-yield
corporate bonds and international bonds becoming increasingly unattractive at this late stage
of the cycle. This year is likely to be a “keep your coupon” best case scenario for bond returns.

Currencies: The U.S. dollar sits at a three-year low. Accelerating economic strength of
developed and emerging economies along with growing concerns about the U.S. deficit have
created headwinds for the U.S. dollar. A -10-percent decline in the dollar in 2017 has carried
over into 2018 but has generated significant incremental returns for U.S. investors holding
international stocks, bonds and funds.

Asset Allocation: We continue to favor stocks over bonds in 2018 but expect rising interest
rates to challenge financial asset prices later in the year. Those who have remained invested
since the last recession in 2009 have been richly rewarded. Investors on the sidelines who fear
missing out on a euphoric market melt-up should exercise caution with realistic expectations
prior to entering a race that has largely already been run.

The Economy: The three Rs: Repair, Recovery and Reflation

Repair (2009-2014): The Great Recession from December 2007 to June 2009 was
characterized by the near collapse of global financial systems. Extraordinary monetary policy
responses by the Federal Reserve included Zero Interest Rate Policies, QE1, QE2 and QE3.
These policies and those of other global central banks backstopped the banking systems and
steered global economies down the road to repair with true recovery and a normal business
cycle remaining elusive.

Recovery (2014- ): Though the stock market recovery began from an oversold bottom in
March 2009, we trace the economic recovery back to the end of QE3 in the fall of 2014. The
Fed ceased its QE3 bond buying program in late 2014 nudging the U.S. economy to pull itself
                                                                                                       2/12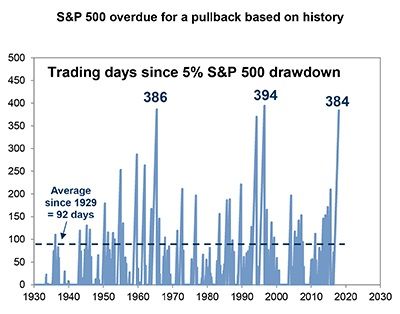
up by its own bootstraps and stand on its own two feet. With waning Fed support, the recovery
from 2014-2016 was lumpy and marked by an earnings recession and a nominal GDP
recession. Since early 2016, economic growth has become globally synchronized with roughly
90 percent of world economies now experiencing accelerating economic growth. A more
normal business cycle is slowly being restored after years of repair. Though we are past the
mid-point of this cycle, the near term probabilities of recession among leading economies in
the developed world remains quite low as the chart below illustrates.

Reflation (present day): Reflation is a growing theme globally as the table below shows.
Headline inflation has made a broad comeback both in advanced and emerging economies.

                                                                                                3/12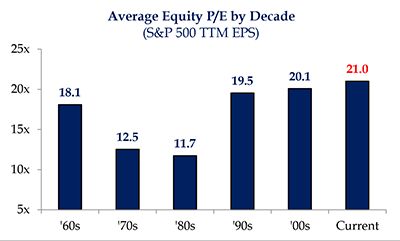
In the U.S., Core Services inflation represents 74 percent of measured inflation and is already
rising in excess of the Fed’s 2-percent target. Core hard goods inflation, however, is actually
deflationary registering price declines of -0.6 percent. Wage growth and commodity prices
continue to slowly build pressure but are not expected to spike. Corporate tax cuts could serve
as a modest inflation headwind as they are expected to increase corporate profit margins by
roughly 0.5 percent potentially giving corporations less incentive to raise prices to make the
same buck.

Bottom Line: Global economic growth remains robust independent of any impact from
corporate tax cuts. Inflation rates remain lower than previous recoveries but are firmly
anchored and supportive of a late cycle reflationary theme. This should be enough to keep the
Fed on course for quarterly rate hikes in 2018.

Fed Update: The Jan. 30-31 Fed meeting will be the last for Janet Yellen’s successful tenure.
This will be a busy year for the Jay Powell led Fed with several FOMC seats yet to be filled by
President Trump. Powell will likely explore more flexible “price level target” frameworks for
future Fed policy during times of economic imbalance as a possible alternative to hard inflation
targets. We anticipate that concerns regarding asset price inflation will become a more
prominent part of Fed discussions. The Fed would rather slowly let air out of economic growth
than be accused of blowing hot air into an asset bubble a year or two from now. Monetary
conditions are actually easier today due to strong economic and earnings growth, a weaker
U.S. dollar and expansionary fiscal policies despite six rate hikes since December 2015. This
gives the Fed the ammunition it needs to continue hiking rates without waiting for a hard 2-
percent inflation target. They do not want to get back into a QE game at the next slowdown,
and they cannot depend on additional fiscal relief from Washington now that tax reforms have
passed so they will continue hiking rates while economic growth is strong.

Bottom Line: The Fed is likely to stay the course with additional rate hikes in 2018 while the
economy continues to grow. There remains a delicate balance between simultaneous
tightening by the Fed and accommodation from Washington’s tax reform. We think the risks for
Fed policy missteps are small in the near term but rising rates eventually impact asset prices.

Washington Update: We expect a busy calendar in Washington during this mid-term election
year but nothing of the magnitude that we saw with health care debates and tax reform last
year. Some of the major items of economic relevance that bear watching include:

Infrastructure Bill: We expect more headlines than headway as it regards a meaningful
infrastructure bill. Tax revenues from repatriation of corporate cash held overseas initially
earmarked to pay for infrastructure are now needed to help pay for the tax cuts. We expect to
hear more about this leading up to the Jan. 30 th State of the Union address but passage of any
meaningful legislation in 2018 is unlikely without funding.

Trade Policy: Montreal will host the next NAFTA negotiations Jan. 23-28th. The Trump
administration may signal its intent to withdraw from NAFTA following round one of these
negotiations but it is more likely this is a negotiation tactic. Also, tariff discussions on Chinese

                                                                                                       4/12
imports could resurface after being put on hold last year during health care and tax reform
negotiations. Any combination of these two trade events could cause market interference.
Spending and Debt Limits: At this writing the House has passed a temporary spending bill to
keep the government running until Feb. 16th but passage in the Senate will be more difficult. A
shutdown is possible but should not have lasting market impact if it occurs. Likewise the U.S.
must address its debt limit by mid-March, which has been delayed twice in September and
December. Failure on these two fronts could cause near term volatility and make for an even
more difficult midterm election year for Republicans.
Midterm Elections: Since Eisenhower, first term presidents have lost, on average, 19 House
seats in the midterm elections. Unpopular presidents have typically lost more seats (Reagan in
1982 and Obama in 2010) and President Trump’s approval rating is currently the lowest of any
first-term president. The chart below illustrates a 40-percent probability of Republicans
retaining the House and 60-percent chance of retaining the Senate. Current trends suggest the
Republicans are tracking to lose 30 or more House seats in November, which would return the
House to Democratic leadership.
U.S. Equity Update:
As the chart below shows, 2017 was a solid year for U.S. equities. Some trends included:
S&P 500 total returns rose every month for the first time on record
Large Cap beat Mid Cap beat Small Cap
Growth stocks beat value stocks by a wide margin
Cap weighted indices beat equal weighted indices
5/12S&P 500 results were dominated by five big tech leaders (i.e., Facebook, Apple, Amazon,
Microsoft and Google,) which earned a combined 45 percent return. Within the S&P 500 these
five stocks represent:
13 percent of the market value
10 percent of the earnings
6 percent of sales revenue
Also on tap for 2018, are changes to the S&P 500 index as the current Telecom Sector (3
percent of S&P 500) becomes a brand new Communication Services sector (10 percent of
S&P 500). Tech names like Google, Facebook, eBay will join this new sector and no longer be
considered “tech.” Disney, Comcast and Netflix are a few media names that will also join this
new sector. Within the S&P 500, Technology and Consumer Discretionary sectors will see their
index weightings reduced by 4.5 percent and 3 percent respectively. This should not be more
than a game of musical chairs with little if any market impact.
Earnings and Valuations: The charts below illustrate a pattern of earnings growth for the S&P
500 and frame current valuations relative to prior decades based on trailing PE ratios. Four key
points:
1. 2015-16 marks the earnings recession following the end of QE3
2. 2017 reflects a normal business cycle with organic earnings growth
3. 2018 reflects sustained earnings growth of 9 percent with an additional 5-percent tax
reform boost.
4. Valuations remain higher than previous decades making earnings growth necessary in
2018 to support valuations
6/12Rising Interest Rates a Key Risk: Historically, rising interest rates threaten stock valuations and
compress PE multiples. As the chart below shows, the current cycle has not followed the path
of prior cycles and is different because this rate hike cycle had 0 percent as its starting point.
To date, rising interest rates have actually been positively correlated with rising stock prices.
This is unusual. Once we see a Fed Funds rate eclipse 2 percent (2 hikes away) and 10-year
Treasury yields pass 2.75 percent we expect rising rates to impact stock prices and compress
PE ratios. This is a late 2018 or early 2019 risk.
7/12Low Volatility Set to Change: The S&P 500 had the lowest volatility on record in 2017 and the
second smallest drawdown in almost 90 years of market history. This trend extended to global
equities as well. Since 1945, the U.S. has experienced 10 occurrences where the S&P 500
declined by less than 6 percent over the course of a calendar year. These occurrences reveal
that the average:
Drawdown in these low volatility years is just -4 percent (last year was -2.8 percent)
S&P return in those years is 25 percent with all 10 years earning a positive return
Drawdown the following year was -12 percent
Return the following year was 5 percent with negative returns three times
The chart below provides a condensed timeline as of Jan. 4th, 2018, going back to 1930 and
graphs the numbers of days since the S&P 500 last had a 5-percent correction. At press time,
we have officially broken the record for longest period and it has now been 395 days without a
5-percent correction. Our purpose for revisiting this theme is not to talk about broken records
but to caution investors against complacency. In 2018, we expect the increasing levels of
volatility and higher drawdown incidents that typically occur in late stages of a bull market. This
is normal. Stay invested.
8/12Bottom Line: We expect double-digit earnings growth in 2018 with a tailwind from corporate
tax cuts. These tailwinds are expected to drive pro-growth corporate behavior with
corresponding positive economic results. Valuations are currently rich having front run
anticipated EPS growth in 2018 but should be validated with continued strong earnings. We
caution against investor complacency and think 2018 earnings growth could outperform index
returns.
International Equity Update: International equity markets followed the same path of their
underlying economies in 2017 rewarding investors with their best returns in several years. For
U.S. investors the returns were even better due to a -10-percent decline in the U.S. dollar. The
chart below shows the returns of the underlying markets for various regions of the world
without currency effects (local) and with currency effects for U.S. investors (U.S. $). U.S.
investors enjoyed double-barreled returns profiting from good performance in both international
stock markets and their currencies. Both market and currency cycles often last several years,
and so far, in 2018 it has continued, to benefit U.S. investors.
9/12Bottom Line: International economies and their markets are earlier in their recovery cycle
than the U.S., have healthy earnings growth and continuing central bank accommodation.
Even with a stable U.S. dollar, we think international markets will continue to be a bright spot in
investor portfolios.
Bond Update:
Interest rates remained lower than we anticipated in 2017 due to lower-than-anticipated
inflation. We expect the economy to continue growing above trend with a positive impact from
corporate tax cuts as early as the Q2 earnings season. This should apply upside pressure to
inflation and interest rates as 2018 unfolds. Bond markets are only now beginning to price in
rising inflation expectations. Since the end of 2017, bond markets have begun to sniff out
inflation and 10-year Treasury yields have increased 0.25 percent. For now, this has quieted
concerns about a flattening or inverting yield curve as the curve has gotten steeper in the last
month. Markets have only priced in two rate hikes in 2018 despite the Fed’s forecast of three
rate hikes, but that also has begun to change.
Corporate tax reform should benefit investment-grade corporate bonds of companies not
strapped by heavy debt burdens. High-yield corporate bonds could be disadvantaged later in
the year as limitations on their ability to deduct interest expense could hamper financial
performance for highly levered companies at the lowest end of the credit scale. This is not an
imminent risk, but high-yield investors should keep an eye on interest rate spreads between
high yields and high quality as an early warning indicator for signs of late cycle deterioration.
Municipal bonds remain attractive with a supply/demand balance that should support prices
fairly well. Also, TIPs are an area that could gain traction as the year progresses if recent
inflation undercurrents translate into higher top-line inflation numbers.
As the chart below shows, high-yield bonds and international bonds closed 2017 as fixed-
income leaders. Of that return, 100 percent from international bonds was attributable to a
weaker dollar. Aside from currency calculus, international bonds are increasingly unattractive
as other central banks (i.e., ECB) may look to reduce accommodative monetary policies later
this year and into 2019.
10/12Final Thoughts:
The global economic recovery is sustainable, broad based and accelerating
Falling unemployment, rising productivity and higher wages underpin a reflationary
theme
The Fed will hike more than markets imply in 2018 and will evaluate expanding their
policy framework
Currently easy financial conditions will begin to fade into 2019 as rising rates take hold
Corporate tax reform will be a growth tailwind adding as much as 0.5 percent to GDP
growth
Double-digit earnings growth should help support stock prices
S&P 500 performance is being driven more by organic earnings growth rather than PE
expansion (a good thing)
Interest rates have yet to impact financial asset prices, which could change in the second
half of 2018 or early 2019
Any corrections should be shallow and short
Stay invested, focused and true to your compass
Sources: Strategas Research Partners, Evercore ISI, FactSet, Goldman Sachs Global
Investment Research, Morningstar, BCA Research
This piece is produced by BB&T’s Wealth Portfolio Management Team.
The information set forth herein was obtained from sources, which we believe reliable, but we
do not guarantee its accuracy. Neither the information nor any opinion expressed constitutes a
solicitation by us of the purchase or sale of any securities. Diversifying investments does not
ensure against market loss and asset allocation cannot eliminate the risk of fluctuating prices
and uncertain returns. Past performance does not guarantee future results.
11/12Traditional banking services are provided by Branch Banking and Trust Company, Member FDIC. Only deposit
products are FDIC insured. Investment solutions are provided by Branch Banking and Trust Company, BB&T
Investments and BB&T Scott & Stringfellow. BB&T Investments and BB&T Scott & Stringfellow are divisions of BB&T
Securities, LLC, member FINRA/SIPC. BB&T Securities, LLC, is a wholly owned nonbank subsidiary of BB&T
Corporation. Securities and insurance products or annuities sold, offered or recommended are not a deposit, not
FDIC insured, not guaranteed by a bank, not insured by any federal government agency and may lose value.
Services and products featured herein may include some offered by affiliated companies of BB&T Wealth. The fees
for those services and products are in addition to the fees charged by BB&T Wealth. As a result, BB&T Corporation,
as a whole, receives more compensation than would otherwise be received if a non-affiliated service or product was
used. When we offer any service or product to a client, we use the same process to offer both affiliated and non-
affiliated services and products. When we have authority to select any service or product on behalf of a client, if our
process shows affiliated services and products to be competitive with corresponding non-affiliated services and
products, then we may select affiliated products and services. BB&T Wealth expresses no opinion on the use of
BB&T affiliated services and products when the client selects such services and products in a client-directed account.
BB&T and its representatives do not offer tax advice. The information provided should not be considered as tax or
legal advice. Please consult with your tax advisor and/or attorney regarding your individual circumstances.
By clicking any third party links, you will leave BBTPerspectives.com to visit a third-party website where the privacy
and security policies of BB&T do not apply. BB&T is not responsible for the content, products or services that you
may find there.
12/12You can also read