Middle Market M&A Update - Q4 2020 - MNP
←
→
Page content transcription
If your browser does not render page correctly, please read the page content below

Middle Market M&A Update
Q4 2020

                           MNPCF.ca
M&A Market Summary
Canadian Mid-Market

Aggregate deal value for the quarter increased to $4 billion across 66 transactions. By comparison Q3 totalled $3.5
billion in aggregate deal value across 54 disclosed transactions. Increased deal volumes suggests that investor
sentiment is increasingly positive, especially as the vaccine roll-out commences and economic normalization is
expected.
The chart to the right summarizes transaction volume per
sector, as defined by the S&P/TSX Composite Index.
                                                                     Q4’20 – M&A Volume By Sector*
Transaction volume during Q4 has remained slightly skewed
towards more defensive sectors heavily exposed to COVID-19.                                     Consumer
• Healthcare accounted for 20% of total deal volume, up                        Utilities      Discretionary
                                                                                                            Consumer
    from 19% in the previous quarter. Two deals were made by                     3%                 3%
                                                                                                             Staples
    acquirer WELL Health Technologies Corporation and two Communication                                       10%
    deals were made by CloudMD Software & Services Inc, out        Services
    of the 13 total health care deals, as virtual healthcare         11%
    services have become attractive to industry players.                                                           Energy
                                                                                                                      4%
• Industrials accounted for 14% of total deal volume. Materials
    Canadian Pacific Rail Limited acquired Detroit River Tunnel    17%
    Partnership for +$410 million, which was the largest deal in                            66                   Financials
    the quarter.                                                                                                     7%
• Materials accounted for 17% of deal volume, down from                            Transactions
    20% in the quarter prior, driven by a number of mining
    transactions.
• The Financials sector, which made up 2% of total deal Information                                             Health
    volume in Q3, accounted for 7% of total deal value in Q4 Technology                                          Care
    with 5 deals closed. Uncertainty regarding performance of       11%                                          20%
    loan books, life insurance, and capital markets business has                        Industrials
    slightly subsided since previous quarters.                                             14%

                                                                 Quarterly Deal Volume and Value*
                          7                                                                                                                         100

                          6

                                                                                                                                                           Deal Volume (Number of Transactions)
                                                                                                                                                    75
                          5
Deal Value ($ Billions)

                          4
                                              $7.1B                                                                                                 50
                          3                                                                   $5.7B
                              $5.3B                   $5.1B $5.2B $5.0B $5.0B $5.1B
                                      $4.6B                                                                   $4.2B
                          2                                                                                                                 $4.0B
                                                                                      $3.4B                                         $3.5B           25
                                                                                                      $2.7B           $2.9B $2.7B
                          1

                          -                                                                                                                         -

                                                                        Deal Value            Deal Volume

*Based on Canadian publicly disclosed transactions in the enterprise value range of $5 million to $500 million. Currency in USD.
Source: S&P Capital IQ.                                                                                                                                   Page 2
COVID-19 Update
COVID-19 Impact on M&A

2020 was a volatile year with respective to M&A activity in the mid-market
                                                                                                                                        Canadian M&A Volumes
space in Canada. There was initially a slowdown in deal volume in the first
half of 2020 as a result of the COVID-19 pandemic. Transactions that were                                                               (Q4 2019 vs. Q4 2020)*
far along the deal process or in the due diligence phase were able to close                                                                   2019                2020
for the most part. However, companies for sale encountered delayed                                                                         89% Closed          86% Closed
                                                                                                                                 500
processes or were put on hold in Q1 2020. The deal environment generally
shifted into a holding pattern given the uncertain economic outlook and                                                          450
financial performance by most businesses.                                                                                        400

                                                                                                        Number of Transactions
                                                                                                                                 350
During the second half of 2020 and as the COVID-19 pandemic in Canada
improved in Q3, many businesses re-opened and buyers began to seek                                                               300
acquisition opportunities again. Business owners previously contemplating                                                        250
                                                                                                                                            453
on divesting their company earlier in the year began preparing their                                                             200                     404
businesses for sale in Q3, resulting in the number of businesses for sale                                                          150
                                                                                                                                                                344
                                                                                                                                                                          295
during the fall season. We have continued to see strong M&A activity in
                                                                                                                                   100
Q4, despite a second wave of shutdowns across Canada as a result of the
resurgence of the pandemic. Fund managers and banks still have plenty of                                                           50
capital to deploy as they seek ways to continue generating a return on their                                                        -
capital.                                                                                                                                          2019             2020
Travel and border restrictions into Canada and the US have continued to                                                                    Announced           Closed
create challenges across many M&A processes; however, acquirers have
                                                                                                                         Source: S&P Capital IQ
become more accepting of virtual meetings and conferences as part of the
due diligence process. Due diligence procedures have also become more
time consuming and rigorous compared to the normal levels.
Deal volumes and valuation multiples have declined in 2020 versus 2019,
although deal structures have evolved to address the uncertainty of market                                                            Canadian M&A Volumes
conditions and business performance as a result of COVID-19. As seen in                                                             (Jan to Dec - 2019 vs. 2020)*
the graphs to the right, deal volumes have begun to slight improve in Q4
compared to Q3. Conversely, although deal volumes are improving, the                                                                         2019                 2020
percent of deals closed continue to be lower compared to the same period                                                           120    94% Closed           77% Closed

in 2019.
                                                                                                                                   100
From an equity markets standpoint, pricing multiples have reached pre-
                                                                                                          Number of Transactions

COVID-19 levels and have priced in a full economic recovery, particularly                                                          80
with the COVID-19 vaccines on the horizon in 2021. At the same time,
variations of the COVID-19 virus have caused some concerns on the                                                                  60
vaccine’s effectiveness and therefore, how quickly the economy will                                                                         103          97
                                                                                                                                                                107
recover. Because of this, some buyers are now wanting to see larger earn-                                                          40                                     82
out structures instead of cash on close to de-risk their investments from
any downturn on financial performance should the economy not recover as                                                            20
expected.
                                                                                                                                    -
Industries Significantly Impacted
                                                                                                                                             Q4 2019             Q4 2020
Physical retailers continue to suffer from the pandemic except for those
with a well established e-commerce platform. Industries with exposure to                                                                   Announced           Closed
essential products and services continue to be strong performers during                                                  Source: S&P Capital IQ
this time along with those in the technology sector. The electrical
automotive, technology, and healthcare sectors have all commanded
significant valuation premiums in 2020.

*Based on Canadian publicly disclosed transactions, ranging in value from $5 million to $500 million.                                                                 Page 3
Equity Markets

In Q4 2020, the TSX Composite posted positive gains for                  Q4 2020 Sector Performance*
the third straight quarter due to monetary and fiscal
stimulus as well the announcement of the COVID-19                                              TSX
vaccine roll-out, despite several concerns, including second                Sector         Composite S&P 500
waves of lockdown measures, US political unrest, and
                                                                  Energy                     45.09%   29.85%
economic uncertainty. The Energy, Healthcare, Consumer
Discretionary, and Financial sectors all posted 15.0%+            Healthcare                 29.78%    8.06%
gains. Out of the 247 stocks on the TSX Composite in 2020,
                                                                  Consumer Discretionary     19.64%    6.24%
122 recorded a gain, with small caps outperforming mid
and large caps. The Index returned 7.7% in Q4 and has             Financials                 15.18%   22.25%
ended the year with a positive return of 2.2%.                    Industrials                 7.82%   15.54%
• The Energy sector outperformed the broader market in
   Q4 2020, with returns totalling 45.1%. Expectations for        Information Technology      7.37%   10.46%
   economic normalization supported by the impending              Utilities                   3.88%    4.63%
   roll-out of the COVID-19 vaccination has supported
   commodity prices. Despite Q4 gains, the sector ended           Communications Services 3.17%       11.98%
   the year at -37.6%. Suncor Energy, Enbridge, and TC            Materials                  -4.70%   15.53%
   Energy Corporation were the largest sector detractors
   for the year.                                                  Consumer Staples           -5.95%    5.11%
• The Healthcare sector posted the second largest gain in Q4 after poor performance in previous quarters.
   Cannabis stocks rose strongly in Q4, supported by industry consolidation and the perception of a more liberal
   regulatory environment after the US election. Additionally, there has been acknowledgement in the industry
   around decreasing production to promote increased profitability. Returns for the year, however, were mixed
   with Canopy Growth’s 15.0% gains partially offsetting a -68.0% loss from Aurora Cannabis.
• Information Technology made a 7.4% gain in Q4 and was the best performing sector for the year, posting a
  2020 return of 54.6%. This strong performance has been driven by companies developing e-commerce
  platforms in the midst of the COVID-19 pandemic to mitigate the effects of bricks and mortar store closures.
  Shopify led the sector, with +178.0% returns for the year, and became Canada’s largest company by market
  capitalization.

                                  North American Equity Indices – Q4 2020 Performance**
  15.00%
                                                                                                                                         11.10%

  10.00%

                                                                                                                                           7.72%
   5.00%

   0.00%

  -5.00%
          Oct-01-2020          Oct-15-2020           Oct-29-2020           Nov-12-2020            Nov-26-2020      Dec-10-2020   Dec-24-2020

                                                           S&P Index                  TSX Composite Index

*Sectorperformance based on the price change of each corresponding S&P 500 sector index over the quarter.
**YTDperformance as of December 31st, 2020.
Source: S&P Capital IQ, Linde Equity – TSX Quarterly Review and Raymond James – Quarterly Insights & Strategies.                           Page 4
Treasury Yields
Canada

On December 9, 2020, the Bank of Canada (BoC or Bank) decided to maintain its target for the overnight rate at
0.3%, which continues the BoC’s decision to maintain the same overnight interest rate since March. The Bank plans
on maintaining its positive outlook guidance, which is supplemented by its quantitative easing (QE) program. This
program will continue at a pace of at least $4 billion of large-scale asset purchases (Government of Canada bonds)
per week. At the Bank’s meeting in October, it signalled that it would keep the rate at its current level until at least
2023 because of its expectations on economic recovery in Canada.
Recent news regarding the development and roll out
                                                                     2 & 10 Year CND Gov’t Bond Yields
of vaccines is providing reassurance that normal
activities may resume soon. The Bank noted that                2.00%                                       0.60%
Canada’s economic recovery from COVID-19 is in line                            CND 10 Year 0.70%
with expectations. Stronger energy demand has                                  CND 2 Year 0.19%
                                                                                                           0.40%
increased the price of commodities. Also, an                    1.50%
appreciation in the Canadian dollar has been driven by
the decline in the US exchange rate. Overall, the BoC                                                      0.20%

                                                                                                                                                         Spread
is committed to maintaining a lower interest rate so            1.00%           Yield
that businesses have access to capital needed to fund,                                                     0.00%
growth, and recover their operations during this time.
                                                               0.50%
Since last quarter (Q3), the 10-year Canadian                                               Spread 0.51%   -0.20%
Government Bond Yield has gone from approximately
0.6% to 0.7%. The overall spread has changed from              0.00%                                       -0.40%
approximately 0.3% to 0.5%. These factors continue to
improve in parallel to economic improvement after the
pandemic disruptions. As the Canadian economy
recovers, the Government of Canada is targeting a
stable inflation rate of 2.0%.                                                  CND 10 YR        CND 2 YR
As the economy moves forward into Q1 of 2021, the Bank will continue to provide the economy with monetary
policy support. The QE program is expected to continue with a gradual reduction as the Canadian economy
rebounds. The Bank’s Monetary Policy Report indicated that the economy is expected to grow at almost 4% in 2021
and 2022, which follows a decline of 5.5% in 2020.

                                                  CND Government Bond Yield Curves
 2.00%

 1.50%

 1.00%

 0.50%

 0.00%

                               CND 30-Dec-20                                  CND Last Quarter                                CND Last Year
Sources: S&P Capital IQ, Bank of Canada, Globe and Mail, StatsCan, Canadian Broadcasting Corporation (CBC). The next scheduled dates in 2021 for the
interest rate announcements (excluding Monetary Policy Report releases) are January 10, March 10, June 9, and September 8, and December 8.             Page 5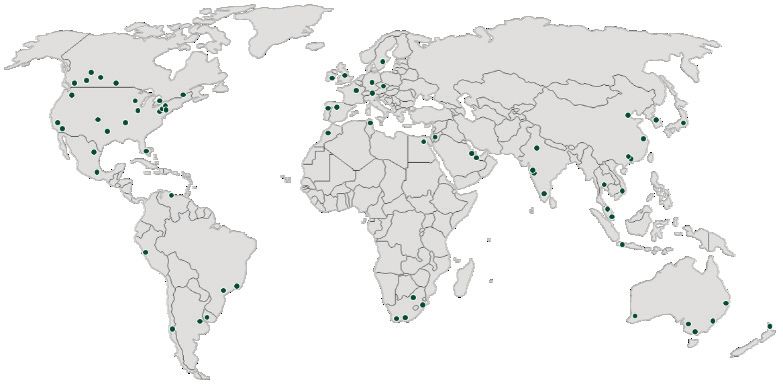
Treasury Yields
United States

The Federal Reserve (Fed or Committee) officials have again decided to hold interest rates near zero (0.0% to 0.3%)
and indicated that they will remain at this level until labour market conditions have reached target levels of
employment and inflation (2.0% over the long-run). The Committee stated it would continue to buy at least $120
billion of bonds each month until key target metrics are met (maximum employment and inflation).
According to the most recent release of the Fed’s
Dot Plot on Dec. 16, 2020, a majority of members                                             2 & 10 Year US Gov’t Bond Yields
agree and foresee the 0.0% to 0.3% interest rate to
                                                                                  2.50%                                                        1.00%
remain until the end of 2023. The long-run shows                                                          US 10 Year 0.93%
members targeting an interest rate of 2.0% to 3.0%.                                                       US 2 Year 0.12%
                                                                                                                                               0.80%
                                                                                  2.00%
The Fed expected Real Gross Domestic Product
(GDP) to fall by 3.7% in 2020, but in fact the median                                                                                          0.60%
                                                                                     1.50%
decline was reported at 2.4%. They also revised their

                                                                                                                                                         Spread
                                                                             Yield
2021 Real GDP forecast from 4.0% to 4.2%.                                                                                                      0.40%
                                                                                     1.00%
The 2020 median unemployment rate has been                                                                                                     0.20%
reported at 6.7%, compared to the September
projection of 7.6%. Moving forward, the Fed projects                              0.50%                                                        0.00%
2021 unemployment to be 5.0% versus their initial                                                                      Spread 0.81%

projection of 5.5%. Policymakers expect this to                                   0.00%                                                        -0.20%
decline to 3.7% by 2023.
Since last quarter (Q3), the 10-year US Government
Bond Yield has gone from approximately 0.7% to
0.9%. The overall spread has gone from                                                                    US 10 YR             US 2 YR
approximately 0.6% to 0.8%.
The Fed will continue to monitor incoming information regarding the economic outlook and global developments
and act appropriately to support the economy. The Committee's assessments will take into account a wide range of
information, including readings on public health, labour market conditions, inflation pressures and inflation
expectations, and financial and international developments.

                                                    US Government Bond Yield Curves

2.50%
2.00%
1.50%
1.00%
0.50%
0.00%

                                US 30-Dec-20                               US Last Quarter                               US Last Year

Source: Capital IQ, Federal Reserve, CNBC, The next scheduled dates in 2021 for FOMC interest rate announcements are January 26-27, March 16-17, April
27-28, June 15-16, July 27-28, September 21-22, November 2-3, and December 14-15.                                                                        Page 6
Commodity Markets

                            Crude Oil Differential
                 80.0                                                            • In 2020 YTD, Western Canadian Select (WCS) has
                 60.0                                                              risen 38.3%, while West Texas Intermediate (WTI)
                 40.0                                                              decreased 1.3%.
$USD/Barrel

                 20.0                                                            • Both WCS and WTI prices reached unprecedented
                                                                                   lows in April at US$3.8/barrel and US$17.1/barrel,
                  0.0
                                                                                   respectively, due to the precipitous decline in
              -20.0                                                                demand as a result of the global pandemic.
              -40.0                                                              • The WCS and WTI prices have recovered to
                                                                                   approximately US$38/barrel and US$50/barrel,
                                                                                   respectively, towards the end of Q4 2020. The
                          Differential                    WTI                      WCS/WTI price differential grew to approximately
                          WCS                             WTI Forecast
                                                                                   US$12/barrel at the end of Q4.
                          WCS Forecast

                          Natural Gas (Henry Hub)
                  3.90
                                                                                 • Q3 natural gas prices grew by 51.2% and did not
                  3.40                                                             change in Q4. Prices remained at US$2.5/mm BTU
                                                                                   near the end of Q4, and saw some volatility during
   $USD/mm BTU

                  2.90
                                                                                   those days, as noted in the graph to the left.
                  2.40                                                           • There is potential for growth in the winter months
                                                                                   as could be amplified by the colder summer, which
                  1.90                                     2.526
                                                                                   will create a tight supply market for natural gas. It is
                  1.40                                                             forecasted the gas prices will continue to soar in Q1
                                                                                   of 2021 (up to US$2.7/mm BTU by the end of
                                                                                   March 2021).

                         Historical Pricing         Future Contracts

                                                                                 • Gold continued its climb through the year, posting
                                 Gold (COMEX)                                      a 13.1% gain in Q2, 6.0% in Q3, but saw a slight
                                                                                   decline in Q4 (-0.7%).
                 2200
                                                            1,895
                                                                                 • Uncertainty around the United States currency in
                 2000                                                              global markets as well as significant Quantitative
                 1800                                                              Easing could be contributing to the gains. A weak
$USD/oz.

                                                                                   USD tends to have an inverse relation with higher
                 1600
                                                                                   gold prices as gold is priced in USD and foreign
                 1400                                                              investors shift money into more traditional value
                 1200
                                                                                   sources when the currency is depreciating.
                                                                                 • Gold prices are expected to continue on a stable
                                                                                   (USD$1855/oz average) trend in Q1 2021 driven by
                                                                                   the continued monetary and fiscal policy measures
                            Historical Pricing          Future Contracts           enacted by the federal government to address the
                                                                                   economic crisis caused by the global pandemic.

Source: S&P Capital IQ, Oil Sands Magazine, Alberta Government – Economic Dashboard, Reuters                                        Page 7
Canadian Economic Update

The Canadian dollar ended Q4 2020 at 1.27 CAD/USD and has strengthened due to both the weakening in the US
dollar as well as the rebound in equity and commodity prices. Relatively low growth and low interest rates in the US
will continue to drive investors towards alternatives and drive USD lower in the near term. News of a COVID-19
vaccine rollout has created expectations of economic normalization and increased risk appetite, however there
remains uncertainty in the near term outlook given the resurgence of cases, new COVID-19 variant concerns, vaccine
distribution inefficiencies, and further lockdown measures.
After a strong rebound in Canada’s real GDP in Q3, growth is
projected to stabilize over Q4 and Q1 2021. The hospitality,                CAD/USD Exchange Rate*
recreation, and travel sectors have remained under pressure
in Q4 while manufacturing, e-commerce sales, and housing              1.45
have made significant gains and are approaching pre-
pandemic levels.
                                                                                                      1.40
Canada’s housing market was extremely strong in 2020,
driven by low interest rates and elevated savings balances.                                           1.35

                                                                                        CAD Per USD
Additionally, the growing trend of suburbanization boosted
housing starts, which has been supported by many companies                                                                                           1.27
                                                                                                      1.30
adopting work from home measures in light of the current
pandemic environment.
                                                                                                      1.25
The unemployment rate is expected to decrease to 8.7% in
Q4 after being >10.0% in both Q2 and Q3 of this year. As the
                                                                                                      1.20
economy rebounds and the vaccine is widely distributed,
unemployment is expected to normalize to pre-pandemic
levels of 5.6%. A disproportionate amount of the unemployed                                            1.15
are within the lower income service sectors jobs which have
been more adversely impacted by the pandemic.
The consumer price index is expected to grow approximately
                                                                                                                            Historical
0.6% to end Q4. The uptick in inflation has been driven by                                                                  Forecast
commodity prices, including food, which carries significant
weight in the basket. Recreation, education, and reading also                            Note: RBC forecasts a Q1’21 CAD/USD exchange rate of 1.28.
contributed to the index increase, while clothing and footwear
posted a pullback.
    Real GDP Growth                         Unemployment Rate                             Housing Starts                       Consumer Price Index
    (YoY % change)**                                   (%)**                                          ('000s)**                   (YoY % change)**

  Year          Canada                      Year          Canada                      Year                    Canada             Year         Canada
  2019           1.9%                       2019           5.7%                       2019                     209               2019          1.9%
    Q2'20              -38.1%                 Q2'20               13.0%                 Q2'20                          51          Q2'20                  0.0%
    Q3'20               40.5%                  Q3'20              10.0%                 Q3'20                          63          Q3'20                  0.3%
   Q4'20F                 1.0%               Q4'20F                 8.7%               Q4'20F                          64         Q4'20F                  0.6%
    Q1'21F                3.5%                Q1'21F                8.5%               Q1'21F                        N/A          Q1'21F                  0.4%
 2020F           -5.8%                     2020F            9.5%                     2020F                     216              2020F              0.7%
 2021F           5.0%                      2021F            7.6%                     2021F                     203              2021F              1.0%
                                                    Note: F stands for forecasted 2020 numbers are not verified and remain forecasted.
                                                          StatsCan has suspended all quarterly housing starts forecasts due to COVID-19
*Exchange rate data as of December 31, 2020. Forecast from RBC Financial Markets Monthly – December 2020.
**RBC Capital Markets Economic Research, Statistics Canada and Canada Mortgage and Housing Corporation.
Sources: S&P Capital IQ, RBC Economics - Current Trends Update - Canada, National Bank of Canada – Economics and Strategy – FX Update – December
2020, www.tradingeconomics.com/canada/unemployment-rate                                                                                             Page 8
About Us

MNP Corporate Finance (MNPCF) has a dedicated team of over 60             Recently Closed Deals
merger, acquisition, and transaction professionals across Canada.
MNPCF works with clients in virtually all industries as they prepare,          (National)
plan and execute transactions.

Our typical transactions range in value between $3 million and
$300 million.

              Local and International Reach
MNP is a participating firm within Praxity, a unique global alliance of
independent accounting/advisory firms created to answer global
business needs. As a member of Praxity, we are able to offer access
to corporate finance, accounting and tax advisory services
worldwide. We are also affiliated with Corporate Finance Cross
Border, which consists of 170+ M&A professionals in more than 30
countries.

                              Services
           • Divestitures              • Due Diligence
           • Acquisitions              • Transaction Advisory
           • Debt Financing              Services

                                                                                             Page 9
About Us

                        Deal Experience                               Recently Closed Deals
                                                                           (National)
Since our inception, our team has advised on hundreds of
transactions, in a wide range of industries with diverse enterprise
values. In the past six years alone we have completed over 125
transactions worth over $2 billion (not including due diligence
engagements).

                     Industry Experience
      •   Food & Beverage                •   Transportation
      •   Retail & Distribution          •   Construction
      •   Manufacturing                  •   Software
      •   Agriculture                    •   Financial Services
      •   Automotive                     •   Technology
      •   Materials                      •   Energy
      •   Healthcare                     •   Oilfield Services
      •   Pharmaceutical                 •   Real Estate

                    Hands-on Approach
Current M&A transactions require a hands-on approach from start
to finish including the active engagement of senior resources. Our
senior resources are dedicated to our clients and are available as
necessary and appropriate. We keep our clients regularly informed
of the engagement status, issues we are encountering, successes,
and overall progress.

               Integrated Service Offering
We draw on the vast experience and deep specialist knowledge
network of our partners locally, nationally and internationally as
specialty issues arise, such as pre-transaction tax planning,
transaction structuring, estate planning, valuation, due diligence,
performance improvement, and risk management.

                                                                                        Page 10
Leadership Team
Transaction Leadership
Brett Franklin Aleem Bandali Dale Antonsen Mike Reynolds
President Managing Director Managing Director Managing Director
Brett.Franklin@mnp.ca Aleem.Bandali@mnp.ca Dale.Antonsen@mnp.ca Mike.Reynolds@mnp.ca
204.336.6190 778.374.2140 250.979.2578 587.702.5909
Mark Regehr Erik St-Hilaire Stephen Shaw Dan Porter
Managing Director Managing Director Managing Director Managing Director
Mark.Regehr@mnp.ca Erik.St-Hilaire@mnp.ca Stephen.Shaw@mnp.ca Dan.Porter@mnp.ca
780.969.1404 204.336.6200 416.515.3883 416.515.3877
Kevin Tremblay Jon Edgett Patrick Khouzam Craig Maloney
Managing Director Managing Director Managing Director Managing Director
Kevin.Tremblay@mnp.ca Jon.Edgett@mnp.ca Patrick.Khouzam@mnp.ca Craig.Maloney@mnp.ca
647.943.4051 519.772.7460 514.228.7874 902.493.5430
Due Diligence Leadership
Johnny Earl John Caggianiello
Managing Director Managing Director
Johnny.Earl@mnp.ca John.Caggianiello@mnp.ca
604.637.1514 416.513.4177
MNPCF.ca
Page 11You can also read