SMART STEEL Investor Presentation September 2018

Page created by Edward Parsons
 
CONTINUE READING
SMART STEEL Investor Presentation September 2018
SMART STEEL

    Investor Presentation
    September 2018

1
SMART STEEL Investor Presentation September 2018
Agenda

     Business model and strategy

     Market positioning

     Overview financials

     Business update by region

     Truck and trailer market trends – what‘s next?

     Company outlook

     Smart Steel innovations driving the company 2020 plus

2
SMART STEEL Investor Presentation September 2018
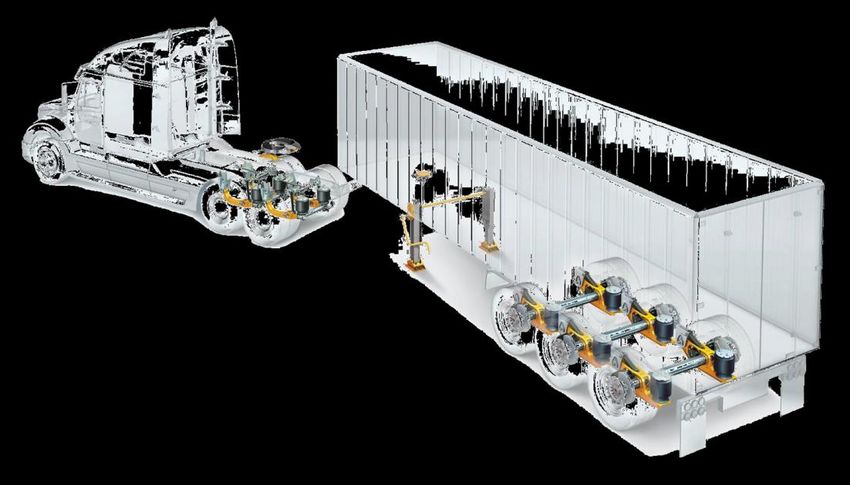
 Business model and strategy

3
SMART STEEL Investor Presentation September 2018
SAF-Holland Group Update: Zooming in on trailers and the Aftermarket

              Total sales by region1             Europe‘s largest listed commercial vehicles supplier
                                                 with leading positions worldwide
                        13%
                                                  41 subsidiaries featuring 22 manufacturing sites on six
                                          51%      continents; 4,400 employees
                             Revenue by           Trailer OEM business is approx. 63% of sales
                               region

                 36%                             Strong global presence
                   EMEA              Americas     One of the very few globally positioned CV suppliers
                   APAC/China                     87% of sales in Europe and North America
                                                  Fast growing APAC/China sales

             Total sales by channel1             Almost 25% of sales originate from the resilient service
                                                 and aftermarket business, the key asset of the Group
                 23%                              Most comprehensive aftermarket spare parts and service
                                                   network worldwide featuring 10,000 partners in more
                         Revenue by                than 80 countries
                          Channel
                                           77%
                                                  The #1 network in Europe and North America: Key asset
                                                   for fleets and major barrier to market entry
                       OE business                Generates generic growth based upon consistently
                       Aftermarket business        increased OE product population in the field
4   1as   of June 30, 2018
SMART STEEL Investor Presentation September 2018
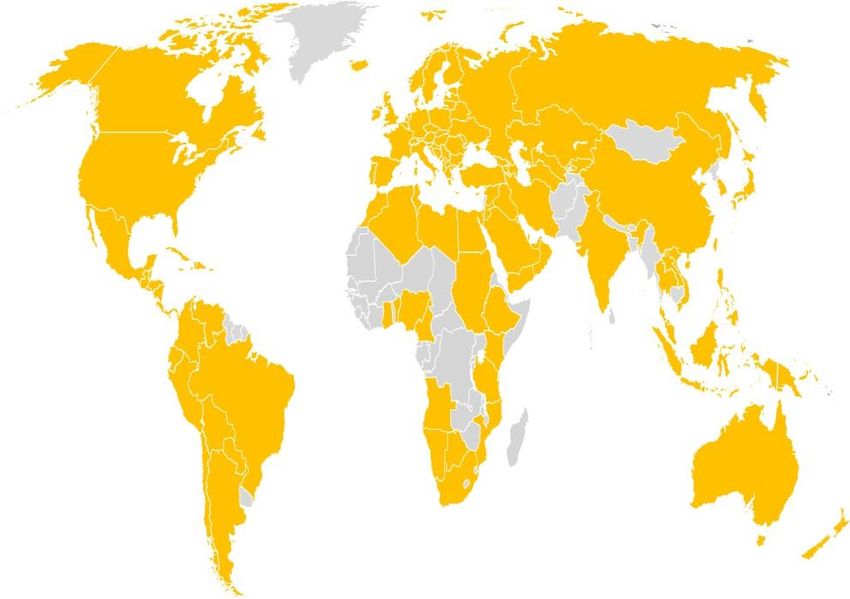
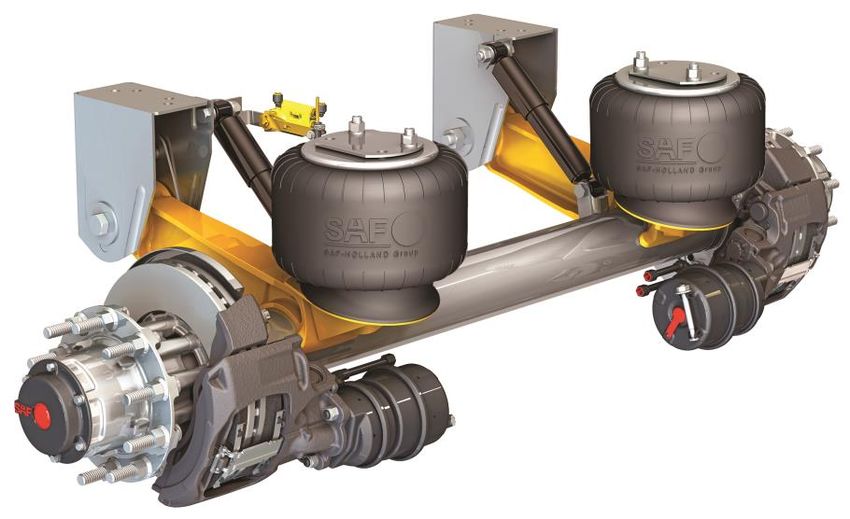
SAF-HOLLAND: Product portfolio

      Trailer axles and                  Truck and bus              Fifth wheels and       Landing gear and
      suspension systems                 suspensions                kingpins               disk breaks

      SAF-HOLLAND offers a comprehensive product portfolio for one-stop shopping also covering the
      aftermarket.
5
SMART STEEL Investor Presentation September 2018
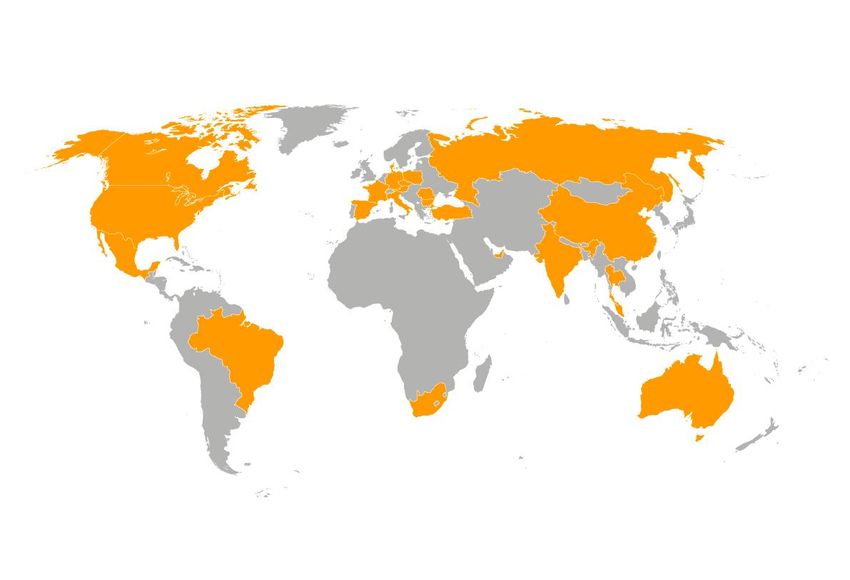
Key OEM customers: Trailer, truck and bus manufacturers

       Almost every major truck, trailer and bus OEM is a SAF-HOLLAND customer.

6
SMART STEEL Investor Presentation September 2018
End customers: The fleets

       SAF-HOLLAND focuses on fleet operators (infrastructure, logistics, specialty, heavy duty, port, etc.).

7
SMART STEEL Investor Presentation September 2018
Strategy 2020: Megatrends driving SAF-HOLLAND’s business
    development are in full effect

    Mega trends            Changing
                         demographics              Growing middle                   Expanding
    Strategy 2020                                      class                       road network
                           until 2030

                     Significantly growing      BRIC: Middle class           Global road
                      world population            growing by 150% to            network:
                      (+1.1 bn people)            2 bn people                   +25% in the last
                     Aging societies            Next 11: Middle               decade
                     Increasing                  class expanding by           2/3 of which built in
                      urbanization and            116%                          China and India
                      concentration in cities    Share of global              Chinese road
                                                  middle class                  network has tripled
                                                  consumption in                within a 10-year
                                                  China, India, ASEAN           time span
                                                  region soaring from
                                                  30% to 55% until
                                                  2030
    SAF-HOLLAND
                      People                                            Trucks/             Roads
     key drivers                        Money         Goods
                                                                        Trailers

8
SMART STEEL Investor Presentation September 2018
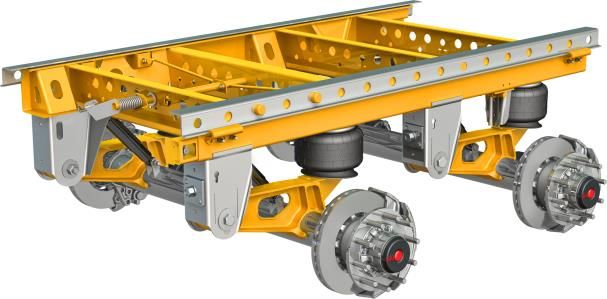
Strategy 2020: SAF-HOLLAND major beneficiary of soaring “Amazon
    E-conomy” driving demand for new trucks and trailers

       Persistent growth of online shopping and “E-conomy” infrastructure consistently pushes demand for new
       trucks and trailers long-term. Rising number of logistic centers and hubs has transport increase.

9
SMART STEEL Investor Presentation September 2018
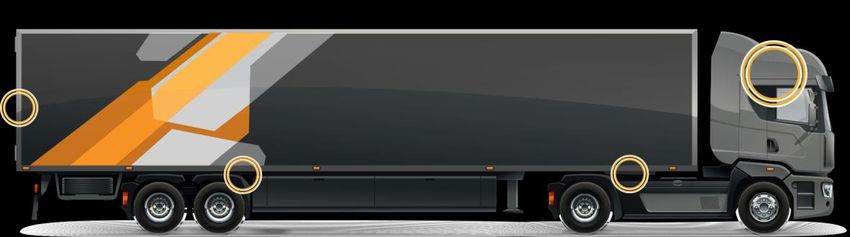
All regions are delivering on Strategy 2020
                      EMEA                                        Americas                                        APAC/China

     Sales in € mn and adj. EBIT margin in %        Sales in € mn and adj. EBIT margin in %        Sales in € mn and adj. EBIT margin in %

     800                                       20   600                                       20   200                                       20

                                    611.8           500   449.4
                        568.8                                                     429.4
     600    540.0                              15                                             15                                             15
                                                    400               402.3
                                     11.1
                         10.3                               9.7                                                                  97.7
     400     8.3                               10   300                                       10   100                                       10
                                                                        7.4                                71.3       70.9        7.6
                                                    200
     200                                       5                                   3.7        5            7.5        3.0                    5
                                                    100

       0                                       0      0                                       0      0                                       0
             2015       2016        2017                   2015        2016        2017                   2015        2016       2017

10
 Market positioning

11
SAF-HOLLAND market-leading positions in North America and EMEA in
   an oligopolistic set-up

                               EMEA                          North America            North America
                                                                                       Market-leading
                      Trailer              Fifth         Trailer axles +    Fifth       position in NA in
                      axles               Wheels         suspensions       Wheels       fifth wheels
                                                                                       Already Nr. 2
                    SAF-                                                     SAF-       position in trailer
        1/2                                 Jost     1    Hendrickson
                  HOLLAND                                                  HOLLAND      axles in NA

                                                                                      EMEA
                                            SAF-
                                                             SAF-                      Leading in
        1/2            BPW               HOLLAND /   2                       Jost
                                                           HOLLAND                      European trailer
                                         V.ORLANDI
                                                                                        axles
                                                                                       Nr. 2 position in
         3           Schmitz              Fontaine   3       Meritor       Fontaine     EMEA fifth wheels
                                                                                        strengthened by
                                                                                        acquisition of Nr. 3
                                                                                        V.ORLANDI

12 Source: Roland Berger, own research
Among the market leaders in China and India

                                                                       India
            China (Premium segment)                    India           Acquisition of Indian
                                                                         market leader in
                             Trailer axles           Trailer axles       trailer axle systems
                                                                         York
                                                                       #1 position in trailer
        1                            BPW     1   SAF-HOLLAND / YORK      axles in the fastest
                                                                         growing TA market
                                                                         worldwide

        2                 SAF-HOLLAND        2       Tata Motors        China
                                                                       Organic growth
                                                                        driven by new
                                    Fuwa             H.D. Trailers      greenfield operation
        3                                    3
                                                                        in Yangzhou
                                                                       Legislation boosting
                                                                        the premium
                                                                        segment in China

13 Source: Roland Berger, own research
Global presence reduces cyclical risks and provides for regional and
     structural growth in new markets
     Sales regions: 85% of sales in Europe and North America
     22 production sites
                                                                          Turkey
                             Italy             Germany                    Duzce-Istanbul
      Canada                                   Bessenbach / Keilberg
                             Flero (Brescia)
      Woodstock                                Bessenbach / Frauengrund
                             Nave
                                               Singen                                              United Arab Emirates
                                                                                                   Dubai

                                                                                                                 China
                                                                                                                 Bautou
                                                                                                                 Xiamen
                                                                                                                 Qingdao

      USA
      Cincinnati                                                                                                 Singapore
      Dumas
      Warrenton South
      Warrenton North
      Wylie
                                                                                                                  Australia
                                                                                                                  Melton

                                                                                           India
                        Brazil                                                             Pune
                        Alvorada
                                                        South Africa
                                                        Johannesburg                       Sriperambadur Taluk

14
Unique selling model based upon direct access to broad end customer
 base that specifies products
                        Customer feedback as regards technical
                              and market requirements

High brand
recognition:
                             Push                   Pull
Superior product
performance                            OEM                   End customer
combined with
aftermarket                 Sales                  Sales
excellence

                           Sales focusing on fleet managers
                    > 80% of purchasing decisions taken by the fleets

15
The most comprehensive aftermarket spare parts and service network
worldwide provides for generic growth and consistent cash flows

     The Key Asset: Approx. 10,000 spare parts dealers   •     “Razor and blade” business model generates growth
     and service stations in more than 80 countries            based on consistently increased OE product population
     guarantee spare parts availability                        in the field
                                                         •     # 1 Network in Europe and North America a key asset
                                                               for fleet customers and huge barrier to market entry
                                                         •     Narrows down volatility from OEM industry cycles
                                                         •     Add-on potential from expanding PDC network and
                                                               positioning of GoldLine/ Sauer Quality Parts brands

                                                         SAFH axle population in EMEA has more than tripled!

                                                             4,000,000

                                                             3,000,000

                                                             2,000,000

     North America                          RoW              1,000,000
                           Europe
         59%                36%             5%
                                                                    0
                                                                         2003   2005   2007   2009   2011   2013   2015   2017

16
 Overview financials

17
Group sales and adj. EBIT by quarter

       Sales in € mn                                                                    Adj. EBIT in € mn. and adj. EBIT margin in %
      400                                                                               35
                                                                                                                                                                14%
                                                                                345.4
      350                                                                               30
                                                                                                    26.3                        26.7                            12%
                                                  300.3                 294.9
      300                                 287.3                                                                          25.1
                    273.7                                 277.1 274.2                   25                                                               23.8
            259.9           255.8 252.6                                                      22.7
                                                                                                           21.6                                                 10%
      250                                                                                                                        8.9% 20.9        20.3
                                                                                                    9.6%          19.8
                                                                                        20                                             7.5% 18.5
                                                                                                                          8.7%                                  8%
      200                                                                                    8.7%          8.4% 7.8%                        6.7% 6.9% 6.9%
                                                                                        15
                                                                                                                                                                6%
      150

                                                                                        10                                                                      4%
      100

       50                                                                                5                                                                      2%

        0                                                                                0                                                                      0%
             Q1      Q2      Q3    Q4     Q1       Q2      Q3    Q4      Q1      Q2          Q1     Q2     Q3     Q4     Q1      Q2    Q3    Q4   Q1     Q2
                       2016                          2017                  2018                       2016                         2017             2018

               Q2 2018 top line grew by 15.0% (organically 11.7%) reaching a record level of € 345.4 mn (py: € 300.3
               mn). Adj. EBIT margin impacted by US plant network realignment at 6.9% (py: 8.9%).

18
Solid trend in organic sales growth continues in all regions

     60%
                                                                                                     52.9%
                                                                                                             49.2%
     50%

     40%                                                                                                             38.3%
                                                                                             35.8%

     30%

     20%
                                                                             15.1%
                                                              11.0%
     10%         8.6%   8.1%                                          7.6%
                               5.1%   5.2%             6.4%

      0%
                          EMEA                                Americas                                APAC/China
                                             Q3 2017    Q4 2017  Q1 2018        Q2 2018   (versus py quarter)

           SAFH product remain in high demand. Positive trend in organic sales growth has continued in all regions.
           Noteworthy: in the APAC/China region strong growth on already solid py comparables.

19
Strong FCF generation provides for growth and dividend payouts

     Free cash flow after taxes, pre-dividend and pre-M&A        Dividend payments
     in € mn                                                     in € per share

     80                                                         0.60

     70                                  67.7

                                                                                                      0.44     0.45
     60
                                                                                            0.40
                                                                0.40
     50
                                                                                  0.32
     40                        35.0                                      0.27
               30.8                                29.7
     30
                                                                0.20
     20
                      11.3
     10

      0                                                         0.00

               2013   2014     2015      2016      2017                 2013      2014      2015     2016      2017

          Sustained strong cash returns (cash conversion of 81%) providing for 2.5 to 3.2% dividend yields in recent
          years; SAF-HOLLAND dividend policy in general is to distribute 40 to 50% of net income.

20
Net debt at € 252.0 mn - equity ratio remains solid at 30.4%

                                  Net debt                                             Equity ratio

     in € mn
                      Σ 105.5*                    Σ 252.0*
      500
      400
      300                                                                  30.2%                         30.4%

      200             442.6
                                                   368.9
      100
        0
                                                   -116.9
     -100
     -200             -337.1

     -300
     -400
                   Dec 31, 2017                 Jun 30, 2018            Dec 31, 2017                  Jun 30, 2018
                                  Cash   Debt

            * Net debt including cash and cash equivalents and other short-term investments sequentially increased to
            € 252.0 mn (Dec. 31,2017: € 105.5 mn). Cash and cash equivalents and other short-term investments
            amounted to € 116.9 mn (Dec. 31, 2017: € 337.1 mn). The equity ratio as of June 30, 2018 was 30.4%.
21
 Business update by region

22
EMEA: Solid organic OE and aftermarket sales growth provides for
     operational leverage
       Sales in € mn                                In 15 years axle population in EMEA has more than tripled

       250                                          4,000,000

       200                          177.9           3,000,000
                  159.6
       150
                                                    2,000,000
       100
                                                    1,000,000
        50

            0                                              0
                 Q2 2017           Q2 2018                      2003   2005   2007   2009   2011   2013   2015   2017

                                                        Q2 2018: sales growth of 11.5 %, organically
       Adj. EBIT in € mn and margin in %
                                                         up +5.2% yoy, clearly outperforming the
       25                                     16%
                                     20.4     14%
                                                         slight growth market trend
       20         17.3                        12%       Strong margin development despite steel
                                    11.5%     10%
       15
                 10.8%                                   price burdens
                                              8%
       10                                     6%        Moderately favorable macroeconomic
        5
                                              4%         environment supports, fleet age still in line
                                              2%
                                                        New products (Air Damping) and share gains
        0                                     0%
                 Q2 2017            Q2 2018             Sustained aftermarket (AM) growth of 4.0%
23
Update US: Successive operating improvements in NA burdened by
     soaring steel price level
          Washington                                                                                       Maine     Add-on operating                           Adj. EBIT
                                Montana
                                                North                                                 Vermont
                                                                                                          New
                                                                                                                     costs in € mn                              margin in %
                                                Dakota
                                                                                                       Hampshire
         Oregon
                                                South
                                                         Minnesota
                                                                Wisconsin
                                                                             Michigan
                                                                                                            Rhode
                                                                                                                                         6.3                           10%
                        Idaho                   Dakota                                                      Island
                                  Wyoming                                                  PennsylvaniaNew           6.0
                                                Nebraska
                                                              Iowa                                   Jersey                   4.5%                                     6%
                                                                    Illinois
               Nevada                                                        IndianaOhio West                                                      3.9
      California
                           Utah
                                     Colorado
                                                              Missouri                         Virginia
                                                                                        Virginia
                                                                                                                     4.0      4.0                            0.6%      2%
                                                                                Kentucky
                                                  Kansas                                 North

                                                            Arkansas
                                                                         Tennessee     Carolina
                                                                                      South                                             - 4.1%                2.3      -2%
                                                    Oklahoma
                        Arizona      New
                                    Mexico
                                                                                     Carolina
                                                                                                                     2.0                          -0.7%
                                                                          AlabamaGeorgia
                                                                  Mississippi                                                                                          -6%
                                                   Texas
                                                                 Louisiana                  Florida                  0.0                                               -10%
      SAF-HOLLAND receiving enlarged production locations                                                                   Q3 2017     Q4 2017   Q1 2018   Q2 2018

       Sales in € mn                                                                                                      Soaring customer demand: order intake boom
       200                                                                                                                 coincides with strained industry supply chain
                                                                                                                          Despite progressing plant network realignment
                                                                       123.0                                               measures, strong organic sales growth of
                                  116.8
                                                                                                                           15.1% (reported sales up 5.3%)
       100
                                                                                                                          Focus on long-term customer retention
                                                                                                                          Successive improvement of unsatisfying plant
                                                                                                                           efficiency rates and profitability enhancement
           0                                                                                                              Process improvement and price increases
                                Q2 2017                               Q2 2018

24
Update China: New legislation prompts structural sales growth through
     2019 and 2020

       Sales in € mn                        New regulatory load limits for CVs and manda-
       50
                                             tory first fit of disk breaks and air suspensions for
                            44.5
                                             hazardous goods transporters as of 2020 trigger
       40
                                             expansion of the premium segment in China
       30
                  23.9                      On an organic basis, sales Q2 2018 up 38.3%;
       20                                    York acquisition contributes add. € 14 mn in sales
       10                                   Focus on organic growth with implementation of
                                             Yangzhou greenfield plant, ramp-up in Q2 2019
        0
                 Q2 2017   Q2 2018          Consistent double-digit organic growth
25
Post merger integration running well: York and V.ORLANDI

                                        First-time consolidation as of May 1, 2018
                                        Instantly Nr. 1 in trailer axles in India
                                        Strong brand
                                        Strong position in adjacent Asian markets
                                        Realization of synergies in sourcing and
                                         manufacturing plus intensive expansion plan
                                         for the Aftermarket to grow margin
                                        India highest growth trailer market worldwide
                                        Further expansion of capacities

                                        First-time consolidation as of April 1, 2018
                                        Nr. 2 and Nr. 3 in fifth wheels joined forces
                                        Complementary coupling technologies, i.e.
                                         specialties
                                        State-of the art automated production
                                        SAF-HOLLAND organization provides for
                                         access to new customers
                                        Significant cross-selling potential at Group level
                                        Strong mid-teens EBIT margin profile
26
 Truck and trailer market trends
       What‘s next?

27
A long-term growth industry driven by mega trends: Continued increase
   of global trailer axle production until 2025

   Global trailer axle production
  in thsd.
  5,000
                                                                                                                                         4,549
                                                                                                                            4,349                40
                                                                                                               4,153                40
  4,000                                                                          3,782            3,964                39
                                                                 3,610                                    38
                                                  3,449                                  37
                                  3,302                                  36                                                              2,063
                   3,167                                  35
                                          34                                                                                1,946
                                                                                                               1,833
  3,000                    33                                                                     1,725
                                                                                 1,623
                                                                 1,528
                                  1,361           1,440
                  1,292

  2,000                                                                                                                                  1,083
                                                                                                               1,028        1,056
                                                                                  974             1,001
                                                   922            948
                   875             898
                                                                                                               254          272          291
  1,000                                                           206             221             237
                   169             180             193

                                                   859            892             927             963          999          1,035        1,072
                   798             827
        0
                  2017e           2018f           2019f          2020f           2021f            2022f        2023f        2024f        2025f
                                               North America       Latin America         Europe      APAC      MEA

28 Source:   Persistence Market Research, Global Trailer Axle Market, December 2017
Trailer market trend North America: Sustained strong order intake,
  backlog extending up to six months

   Trailer net orders

   50000

   40000

   30000

   20000

   10000

          0
                 Jan.          Feb.   March    April    May     June    July    Aug.    Sep.    Oct.    Nov.    Dec.
       2016     17649         21360   13789   15840    13302   11931    9482   14031   11746   20158   35790   34060
       2017     32818         25798   20587   20056    16645   18911   13380   14620   23994   31793   42618   45792
       2018     39764         32863   27811   21941    21008   18600   28000

           July net trailer orders in NA were 28,000 units, up 51% mom and up 109% yoy. In the first
           seven months of 2018 net trailer orders increased by 28% following up on truck segment
           boom.
29 Source: FTR, August 2018
Truck market trend North America: Order boom versus strained supply chain

   Class-8 net orders

   50000

   40000

   30000

   20000

   10000

          0
                  Jan.         Feb.        March          April        May          June    July    Aug.    Sep.    Oct.    Nov.    Dec.
       2016      18062        17650        16147         13500        14095        13000   10263   14078   13753   13775   19300   21200
       2017      21863        22886        22765         23538        16419        17375   18197   20683   22082   35613   32293   36820
       2018      47426        40185        46248         34262        35319        41800   52100   52400

            NA Class 8 net order intake for Aug. 2018 was 52,400 units up 153% yoy. In the first eight
            months class-8 net orders soared by 114%. ELD, E-conomy, increase in ton milage and freight
            rates at still moderate fuel cost keep demand at a high level.
30 Source: FTR, Truck OEMs - Total N.A. Cl. 8 Orders (US/CAN/MEX/EXP), September 2018
Mildly supportive market environment in 2019

                                               EMEA                                         North America

            Truck Production1 Trailer Production2                                Truck Shipments3   Trailer Production4

               2018                 +4%                              +1%         2018      +23%             +9%

               2019                 +2%                              -5%         2019       +9%             -3%

              NA Class 8 truck shipments forecast to continue 2018 upturn with +9% growth in 2019. NA trailer production
              slightly down from record level in 2019. European truck market posting slow growth only. European trailer
              market is expected to remain at an overall solid level of approx. 300,000 units.

     1 LMC Global Commercial Vehicles Forecast Q4, 2017, heavy trucks
31
     2 Clear , Forecast Report, May 2018; Persistence, Dec. 2017; own research
     3 FTR Truck & Trailer Outlook, August 2018, Class 8
     4 FTR Truck & Trailer Outlook, August 2018
 Company outlook

32
Outlook: Financial targets 2018 and mid-term planning 2020

                                                                                   FY 2018*                                                  Strategy 2020

                                                                   Organic increase of 5 to 7%                                          Organic: € 1,250 mn
                                                                  assuming stable FX rates and
                                                                unchanged scope of consolidation
                           Sales
                                                                 + contribution from V.Orlandi and                            + M&A: Coops, JVs, acquisitions
                                                                    York takeovers (~ € 60 mn)
                                                                                                                                          Total: € 1,500 mn
                                                                         + potential further M&A

                  Adj. EBIT margin                                                7.0 to 8.0%                                                      ≥ 8%

            Net working capital ratio                                                   12%                                                          12%

                                                                           € 38 to 40 mn
                                                                                                                                     € 26 mn to € 28 mn p.a.
                         CAPEX                                    incl. high single-digit Euro mn
                                                                amount related to new China plant

33 * Projections assume that there is no significant deterioration of the political, economic or industry-specific environment; organic projections do not
   include potential sales and earnings contributions from acquisitions or JVs
 Smart Steel innovations
       driving the company 2020 plus

34
Content per vehicle opportunity with significant potential from trailer
     connectivity and data interpretation excpected
     Trailer content per vehicle                                                                  European trailer components1
     in %                                                                                         OEM market:

     ■ Chassis                                                    ■ Structural elements           in € bn

     - Axles                                                      - Body parts                    2.0                ~ 13 %

     - Brakes                                                     - Landing gear                  1.5

     - Suspensions                                                - Side wings
                                                                  - Tail                          1.0

                                                                  - Lighting                                  1.5
                                                                                                                                1.7

                                                                  - Interieur                     0.5

                                                                                                  0.0
                                                                                                             2017              2025e

                                                                       ■ Connectivity systems
                                                                       - Connectivity / telematics
               50.0%                                           48.0%   - Sensoring / electronics
                                                                       - Data interpretation / Predictive
                                                                         maintenance
                                                                       - Advanced driver assistent systems
                                           2.0%
                                                                          Connectivity and data-based applications provides for the
                                                                          highest growth rates in the trailer components first fit market

35   1Comprising trailer axles, brakes and landing gear only
     Source: Roland Berger, own research
SMART STEEL provides for add-on business
     opportunities in a digitized transport world

              1                     2                   3                      4                      5

                              Upgrade to              Digitize                               New business
                                                                         Integrate &
         Mechanics             Electro-            Information &                            models & Digital
                                                                           Connect
                              mechanics                 Data                                   solutions

                                                                                              Predictive Maintenance
                              RECOLUBE                                 SAFH Connect App     Big Data Analytics

       SAF-HOLLAND combines mechanics with sensors and electronics.
       The Company‘s integration and data interpretation know-how enables smart/autonomous drive systems.

36
Acquisition of Axscend provides for
     complementary data-based business model

 Start-up innovation power …                                                   … meets market leading
                                                                               position
  Trailer Master turns trailers into
   „smarties“                                                                   Scalable at SAF-HOLLAND
  Connectivity and data interpretation                                          Group level
  Succesfully established license-                                             License-based model to be rolled
   based business model                                                          out to more than 20.000 SAF-
  Already a couple of thousand                                                  HOLLAND fleet customers
   licenses in the UK alone                                                     SAF-HOLLAND achieved a
                                                                                 significant time gain

        Succesful data- and license-based business model offers a scalable platform for a roll out at the group level.

37
Disclaimer

     Not for general release, publication or distribution in the United States, Australia, Canada or Japan.
     By attending this presentation you agree to be bound by the following limitations:
     This presentation has been prepared by SAF-HOLLAND S.A. (“SAF-HOLLAND”) and comprises written materials concerning SAF-HOLLAND. It is furnished to you solely
     for your information and may not be reproduced or redistributed, in whole or in part, to any other person. It contains summary information only and does not purport to be
     comprehensive and is not intended to be (and should not be used as) the sole basis of any analysis or other evaluation. No representation or warranty, express or implied,
     is made as to, and no reliance should be placed on, the fairness, accuracy, completeness or correctness of any information, including projections, estimates, targets and
     opinions, contained herein, and no liability whatsoever is accepted as to any errors, omissions or misstatements contained herein, and, accordingly, neither SAF-HOLLAND
     nor any of its directors, officers, employees or advisors nor any other person shall have any responsibility or liability whatsoever (for negligence or otherwise) arising,
     directly or indirectly, from the use of this presentation, or its contents or otherwise in connection with this presentation.
     This presentation contains certain statements related to our future business and financial performance and future events or developments involving SAF-HOLLAND and/or
     the industry in which SAF-HOLLAND operates that may constitute forward-looking statements. These statements may be identified by words such as “believes,” “expects,”
     “predicts,” “intends,” “projects,” “plans,” “estimates,” “aims,” “foresees,” “anticipates,” “targets,” and similar expressions. Forward-looking statements are not historical facts,
     but solely opinions, views and forecasts which are based on current expectations and certain assumptions of SAF-HOLLAND’s management or cited from third party
     sources which are uncertain and subject to risks. Actual events may differ significantly from the anticipated developments due to a number of factors, including without
     limitation, changes in general economic conditions, changes affecting the fair values of the assets held by SAF-HOLLAND and its subsidiaries, changes affecting interest
     rate levels, changes in competition levels, changes in laws and regulations, environmental damages, the potential impact of legal proceedings and actions and the Group’s
     ability to achieve operational synergies from past or future acquisitions. Should any of these risks or uncertainties materialize, or should underlying expectations not occur
     or assumptions prove to be incorrect, actual results, performance or achievements of SAF-HOLLAND may (negatively or positively) vary materially from those described,
     explicitly or implicitly, in the relevant forward-looking statement.
     The information contained in this presentation, including any forward-looking statements expressed herein, speaks only as of the date hereof and reflects current legislation
     and the business and financial affairs of the SAF-HOLLAND which are subject to change and audit. Neither the delivery of this presentation nor any further discussions of
     SAF-HOLLAND with any of the recipients thereof shall, under any circumstances, create any implication that there has been no change in the affairs of SAF-HOLLAND
     since such date. Consequently, SAF-HOLLAND neither accepts any responsibility for the future accuracy of the information contained in this presentation, including any
     forward-looking statements expressed herein, nor assumes any obligation, to update or revise this information to reflect subsequent events or developments which differ
     from those anticipated.
     This presentation is not directed to, or intended for distribution to or use by, any person or entity that is a citizen or resident or located in any state, country or other
     jurisdiction where such distribution, publication, availability or use would be contrary to law or regulation or which would require any registration or licensing within such
     jurisdiction. This presentation is for information purposes only and does neither constitute an offer to sell securities, nor any recommendation of, or solicitation of an offer to
     buy, any securities of SAF-HOLLAND in the United States, Germany or any other jurisdiction. In the United States, any securities may not be offered or sold absent
     registration or an exemption from registration under the U.S. Securities Act of 1933.

38
IR Contact

     SAF-HOLLAND GmbH
     Hauptstraße 26
     63856 Bessenbach
     Germany
     www.safholland.com

     Stephan Haas
     Vice President Investor Relations / Corporate Communications
     stephan.haas@safholland.de
     Phone: +49 - 6095 301-617

     Alexander Pöschl
     Manager Investor Relations / Corporate Communications
     alexander.poeschl@safholland.de
     Phone: +49 - 6095 301-117

39
You can also read