INVESTOR PRESENTATION - MARCH 2018 - Investor Relations | Callaway Golf
←
→
Page content transcription
If your browser does not render page correctly, please read the page content below
INVESTOR PRESENTATION
MARCH 2018

IMPORTANT NOTICES

Forward-looking Statements: During the presentation, any comments made about future performance, events, prospects or circumstances,
including estimated 2018 net sales, gross margins, operating expenses, and earnings per share (including estimated tax rate and share count),
future growth or profitability, the creation of shareholder value, future industry or market conditions, future reinvestment or capital deployment,
the impact of the OGIO and TravisMathew acquisitions, and the estimated capital expenditures and depreciation and amortization expenses, are
forward-looking statements, subject to the Safe Harbor provisions of the Private Securities Litigation Reform Act of 1995. These forward-looking
statements are often characterized by the use of words such as “estimate,” “expect,” “anticipate,” “project,” “plan,” “intend,” “seek,” “believe,”
“forecast,” “foresee,” “likely,” “may,” “should,” “goal,” “target,” “might,” “will,” “could,” “predict,” “continue” and the negative or plural of these
words and other comparable terminology. Such statements reflect our best judgment as of the time made based on then current market trends
and conditions. Actual results could differ materially from those projected in the forward-looking statements as a result of certain risks and
uncertainties applicable to the Company and its business. For details concerning these and other risks and uncertainties, you should consult our
earnings release issued on February 7, 2018, as well as Part I, Item 1A of our most recent Form 10-K, together with the Company's other
reports subsequently filed with the SEC from time to time. The Company undertakes no obligation to republish revised forward-looking
statements to reflect events or circumstances after the date hereof or to reflect the occurrence of unanticipated events.

Regulation G: In addition, in order to assist you with period-over-period comparisons on a consistent and comparable basis, today’s
presentation includes certain non-GAAP information. This information, as applicable, excludes the non-recurring OGIO and TravisMathew deal-
related expenses, the non-recurring impacts of the recent 2017 Tax Cuts and Jobs Act and other non-recurring tax adjustments, the second
quarter 2016 gain from the sale of a small portion of the Company’s Topgolf investment, and the reversal in 2016 of most of the Company’s
deferred tax valuation allowance. The Company also provides certain information excluding interest, taxes, depreciation and amortization
expenses, as well as the Topgolf gain and the acquisition deal-related expenses. For comparative purposes, certain non-GAAP earnings
information assumes a 38.5% tax rate for certain interim periods. This non-GAAP information may include non-GAAP financial measures within
the meaning of Regulation G. These non-GAAP measures should not be considered as a substitute for any measure derived in accordance with
GAAP. The Company has provided a reconciliation of such non-GAAP financial measures to the most directly comparable financial measures
prepared in accordance with GAAP. The reconciliations are included in this presentation.

                                                                                                                                                          2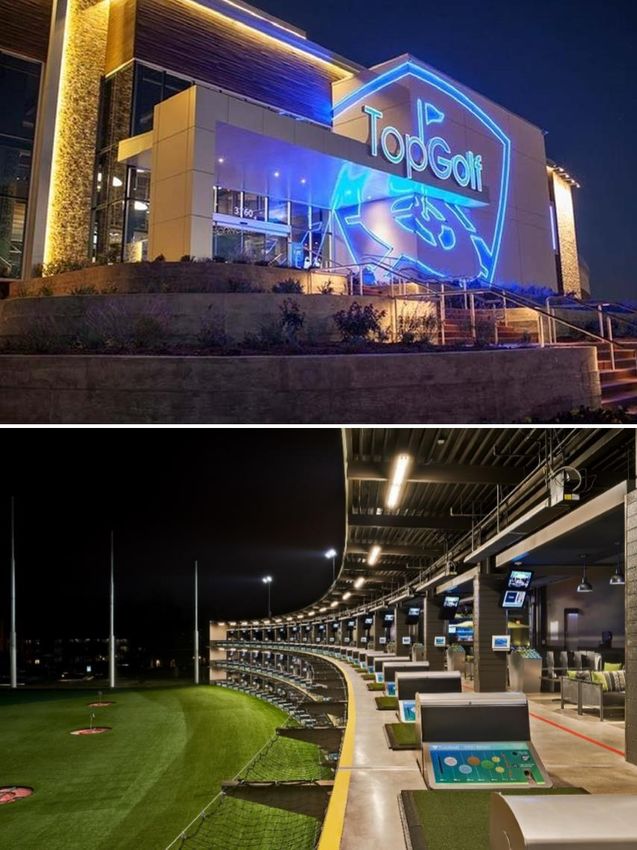
CALLAWAY OVERVIEW

• Global leader in advanced golf technology                          • Successfully executed turnaround to
                                                                       reinvigorate brand
• Manufacture and sell golf clubs and golf
  balls, and sell golf and lifestyle apparel and                     • Now pivoting to a growth strategy in a
  accessories under the Callaway Golf®,                                consolidating industry
  Odyssey®, OGIO® and Travis Mathew®
  brands worldwide                                                   • Continue investments in both core and
                                                                       complementary areas
  Market cap: $1.50B(1)
                                                                     • Strong executive team with deep industry
  Employees: ~2,100
                                                                       experience
  Net Sales: $1,049M(2)
                                                                     • Strong balance sheet with minimal debt
  Gross Margin: 45.8%                           (2)

  Leadership: Chip Brewer, CEO

                                                      STANDOUT PRODUCTS AND BRAND
 1)   Market capitalization as of February 15, 2018
 2)   2017 Full Year GAAP Results                                                                                 3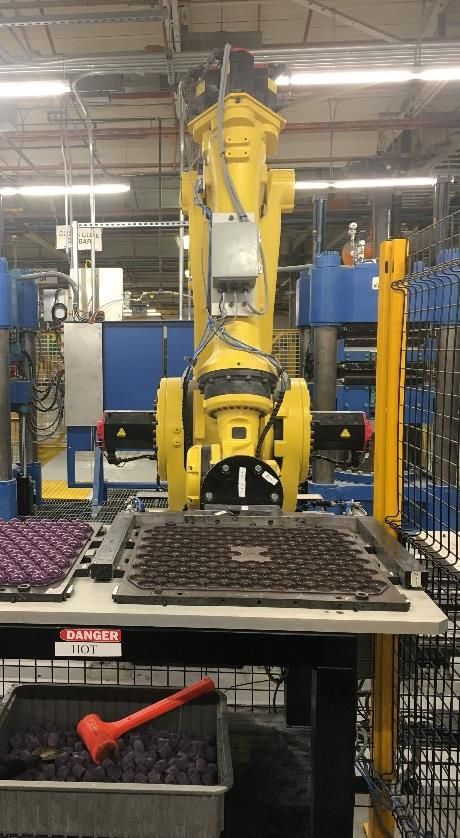
2017 NET SALES AND MARKET SHARES BY REGION                                                                          ROW
                                                                                                                        7% ROA
                                                                                                                            7%

                                                                                                                             EUROPE
                                         EUROPE                                                                                13%        NET
                                                                                                            US
                                                                                                                                        SALES BY
                                          #1 in Hard Goods; 24.3%                                          54%
                                          market share, up 200 bps YOY                                                   JAPAN           REGION
                                                                                                                          19%

US
                                                                                                                          JAPAN
#1 in Total Clubs; 25.1% Hard
Goods market share, up 250                                                                                #1 in Total Clubs; 19.7%
bps YOY                                                                                                  Hard Goods market share,
                                                                                                                   up 400 bps YOY

                                                                                                                             KOREA
                                                                                                             Korea:#1 golf brand with
                                                                                                                 19.5% market share

                                                         MARKET SHARE GROWTH ACROSS ALL MAJOR REGIONS
 Market share data sources: For U.S. and Europe, provided by Golf Datatech; for Asia, provided by GFK.
                                                                                                                                                   4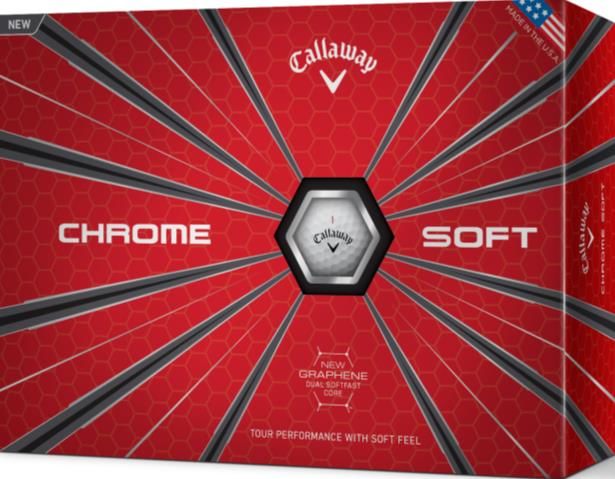
OVER 75% MARKET SHARE GROWTH SINCE 2012

                   U.S. Retail Hard                                                              2017 Callaway U.S. Retail
                 Goods Market Share                                                             Dollar Market Share Rankings

                                             25%
 0.25

                                    23%                                                         STICKS
                             21%                                         #
  0.2
                      19%                                                                       WOODS
                                                                                                DRIVER
        14% 15%
                                                                                                IRONS
 0.15

  0.1

 0.05

   0
                                                                         #                       PUTTER
        2012   2013   2014   2015   2016       2017                                              GOLF BALLS

                             BRAND MOMENTUM CONTINUES TO DRIVE SHARE GAINS

                                           Source: Golf Datatech, on- and off-course combined
                                                                                                                               5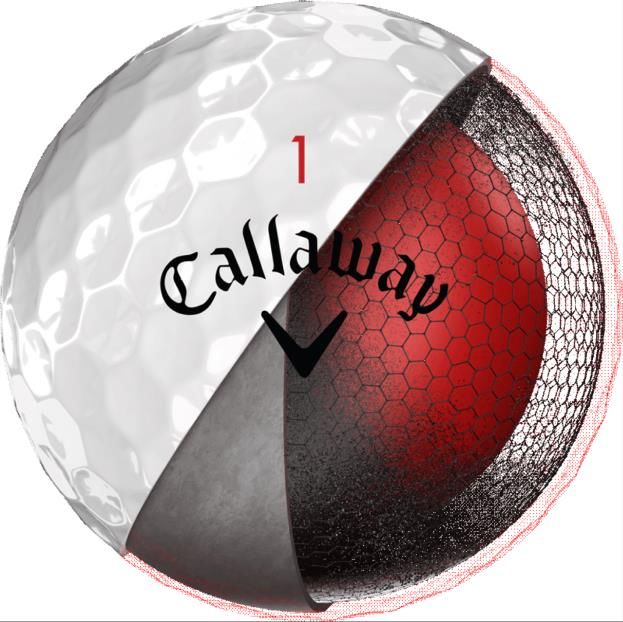
HISTORICAL PERFORMANCE

                                           Net Sales (M)
                                                                                                                                                                             Gross Margin
                                                                                         $1,049
                                      $887                               $871                                                                                                                             44%             46%
                     $843                               $844                                                                                                             40%             42%
                                                                                                                                                        37%

                      2013             2014             2015              2016             2017
                                                                                                                                                        2013             2014             2015            2016             2017

                                                      EPS*                                                                                               Net Cash from Operations (M)

                                                                                          $0.53
                                                                                                                                                                                                                           $118
                                        $0.20                            $0.24
                                                         $0.17
                                                                                                                                                                                                           $78

                                                                                                                                                                        $37               $31
                      $(0.31)

                                                                                                                                                      $(9)
                       2013             2014            2015            2016*           2017*
                                                                                                                                                      2013             2014             2015              2016             2017

                                                                     FURTHER STRENGTHENING OUR FINANCIAL POSITION
*To facilitate year-over-year comparisons, 2016 and 2017 are stated using Non-GAAP EPS: The 2016 $0.24 excludes the $10 million ($0.11 per share) after-tax Topgolf gain, and the $157 million ($1.63 per share) benefit from the reversal of the
valuation allowance. The 2017 $0.53 excludes the $7 million ($0.07 per share loss) of after-tax OGIO/TravisMathew one-time deal expenses and $3 million ($0.04 per share loss) of non-recurring tax expense. Refer to the appendix for a reconciliation
of this non-GAAP measure to its most directly comparable GAAP measure.                                                                                                                                                                                    6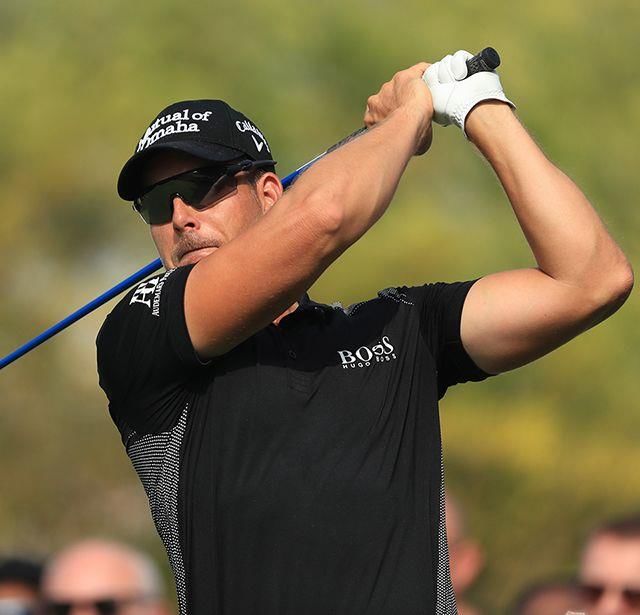
THREE YEAR PERFORMANCE COMPARISON

         Net Sales (M)                              Gross Margin
                         $1,049

              $871                                                            46%
  $844
                                                              44%                                                                     Key Points
                                              42%

                                                                                               •    Successfully generated considerable free cash flow
                                                                                                    over last 12 months

                                                                                               •    Adjusted EBITDA up 72% over 2016
  2015       2016        2017                2015            2016             2017
                                                                                               •    Prudently and successfully deploying increased cash
                                           Adjusted EBITDA*                                         flow for the long-term benefit of shareholders:
Operating Income
                                                  (M)
     Margin              7.5%
                                                                                                   •    Japan Apparel JV
              5.1%                                                                                 •    OGIO

  3.2%                                                                        $100
                                                                                                   •    Strategic reinvestment in core
                                                                                                   •    Share repurchase
                                                              $58
                                              $46
                                                                                                   •    TravisMathew

  2015       2016        2017               2015             2016            2017

                                2017 CONTINUED STRONG MULTI-YEAR PERFORMANCE TRENDS
                                  * Adjusted EBITDA excludes non-recurring OGIO and TravisMathew expenses in 2017 and the Topgolf gain in
                                  2016. Refer to the appendix for a reconciliation of this non-GAAP measure to its most directly comparable GAAP          7
                                  measure.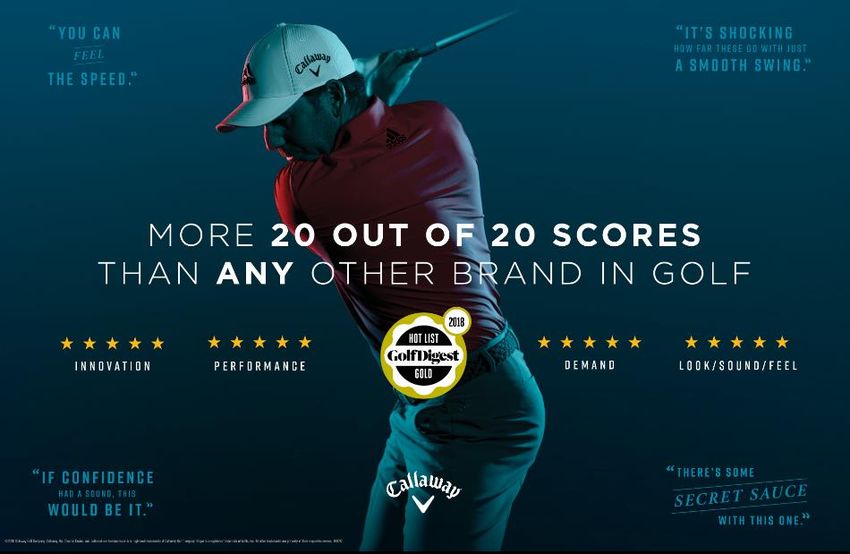
KEY INDUSTRY TRENDS

Improving industry fundamentals is the overarching theme
  •   European market has had a strong year
  •   U.S. and Japan markets up in the second half of 2017
  •   Japan showing growth in recent months
  •   Fewer OEMs
  •   Reduction in field inventory

Healthier retail channel is exemplified in a number of positive trends
  •   Average selling prices have been increasing
  •   Product life cycles have lengthened
  •   Less overall unplanned promotional activity

Benefit to industry in the long-run despite, and in some cases due to, market corrections

                           CAUTIOUS OPTIMISM CHARACTERIZES RECENT INDUSTRY TRENDS

                                                                                            8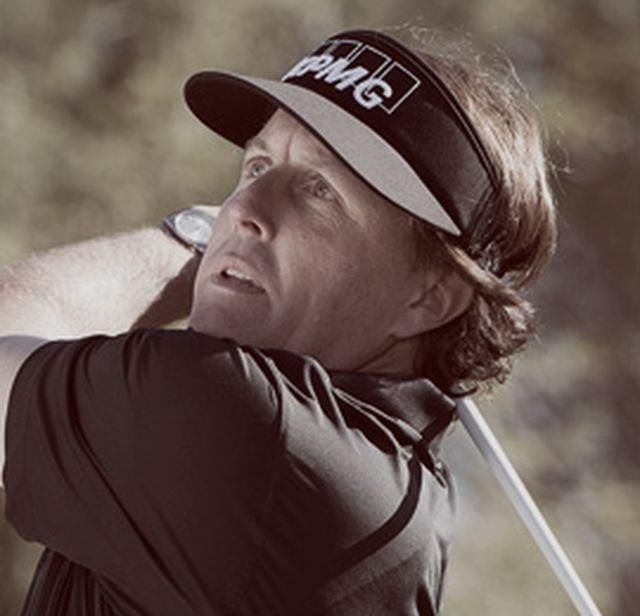
U.S. GOLF MARKET

                                                                                                                                            U.S. Golfers (M)(1)
                                                                                                                               Fringe/Unengaged     Casual/Recreational           Avid
Approximately 24M golfers in U.S.                                                                                            25.7      25.3             24.7
                                                                                                                                               24.7               24.1             23.8
 •   Avids and Casual/Recreational make up committed golfer base
                                                                                                                              5.7           4.4           4.0     4.2
 •   84% of golfers are committed                                                                                                                                         4.6      3.7

 •   Committed golfers grew 3.1% in 2016
                                                                                                                             11.3          11.9          11.8    12.1              11.3
                                                                                                                                                                          11.1

Mixed rounds-played data
 •   2015: +1.8%                                                                                                              8.7           9.0           8.9     8.4     8.4      8.8

 •   2016: +0.6%
                                                                                                                            2011          2012           2013    2014    2015     2016
 •   2017: -2.7%

People new to the sport trying it in record numbers                                                                                 Beginning Golfers (M)(2)
 •   2.5M new golfers in 2016
                                                                                                                                                       10.8% CAGR
 •   Up 67% since 2011

Focused on market share gains as industry rationalizes                                                                                                           2.     2.2
                                                                                                                                                                                 2.5
                                                                                                                                           1.9          1.9
                                                                                                                             1.5

                                                                                                                            2011         2012          2013     2014    2015     2016

                                      STABILIZING MARKET WITH 24M GOLFERS IN THE U.S.
                         1)   People age 6+ who played at least one round of golf; Avids indicate golf is a favorite activity; Casuals indicate golf is one
                              of several ways they like to spend their time. The Fringe group often chooses other ways to spend their recreational time.
                         2)   Source: National Golf Foundation, 2016 report                                                                                                               9
CURRENT STRATEGY

1) Drive growth
 • Organic: Continue to invest in technology, the golf ball business and on Tour;
   Capitalize on digital media strategy

 • Inorganic: Seek M&A and JV opportunities that are in golf or complementary to golf

2) Continue to improve operational efficiency
 • Stringent cost management

 • Drive continued productivity improvement

3) Generate free cash and effectively deploy
 • First priority is to invest in high ROI projects (core business or tangential areas)
 • Return capital to shareholders via buybacks and dividends

                      TRANSFORMATION IS COMPLETE: PIVOTED TO GROWTH STRATEGY

                                                                                          10
EXTENSIVE NEW PRODUCT LINE-UP IN 2018
Leading-edge innovation
• New Rogue woods with next generation jailbreak technology and having jailbreak in fairway
woods and hybrids for the first time
• New Rogue iron with the latest in cup face design, internal tungsten weighting and a new
technology called “Urethane Microspheres” for the ultimate in sound and feel
• New Chrome Soft golf balls featuring a new and larger “Graphene” infused core
• Graphene is a nobel prize winning material, which allows us to make faster balls while maintaining
it’s soft feel
• New introductions across all categories, including OGIO and TravisMathews
PRODUCT EXCELLENCE IS A CORNERSTONE OF OUR STRATEGY
11GOLF BALL GROWTH OPPORTUNITY
U.S. Retail Dollar Ball
2015 Market Share
• Chrome Soft ball introduced
14.3%
• Callaway achieved constant currency sales growth of 10% over 13.8%
prior year(1)
11.4%
2016 9.5%
7.9%
• Dual SoftFast Core technology introduced
• Callaway achieved sales growth of 6% over prior year
2017
• Launched Chrome Soft X with Dual SoftFast Core technology 2013 2014 2015 2016
2017
• Callaway achieved sales growth of 7% over prior year
2018
• Launched next generation Chrome Soft with a new and larger
Graphene infused inner core
MOMENTUM AND DIFFERENTIATED TECHNOLOGY HAVE LED TO GROWTH
Market Share Source: Golf Datatech (Golf Datatech includes only green grass channel and certain off-course specialty outlets).
(1) The reconciliation for this item can be found in the 2015 year-end earnings release.
12STRATEGIC INVESTMENTS IN COMPLEMENTARY AREAS
OGIO Acquisition Japan Joint Venture
• Transaction closed in January 2017 • Commenced July 1, 2016
• Lifestyle brand known for its adrenaline-raising • 52% ownership stake in JV with TSI Groove & Sports
bags and gear Co, Ltd.
• Long-time licensee in Asia
• Strong strategic fit with Callaway, including
potential cost and revenue synergies; platform for • Strong apparel design and retail capabilities
future growth • Includes Callaway-branded apparel, headwear and
• Accretive to earnings in 2017, excluding transition footwear
and transaction expense • Opened new Flagship store in Tokyo, along with three
• Integration into core business complete other stores in 2017
• International expansion in 2018 • Continued store expansion in 2018
EXTENDING OUR RANGE WITH OPPORTUNITIES IN COMPLEMENTARY AREAS
13ACQUISITION OF TRAVISMATHEW
Dynamic apparel business based in nearby Huntington Beach, California
Strong fit with ELY in terms of business, brand and culture
• Company focused on high quality product
• Willingness to invest to grow the brand
• Brand has a distinct southern California vibe
Brand synergy with our existing business and strong financial contribution
• Attractive revenue growth – double digit growth
• Enhancing to our current gross margins, operating margins, EBITDA and free cash flow
• Synergies via brand, operations, sourcing, golf channels and international presence
• Planned to be accretive in 2018
TRANSACTION CLOSED IN AUGUST 2017
14STRATEGIC INVESTMENTS IN CORE BUSINESS
Core Golf Equipment Business Tour and Player Development
• Technology/Capacity driven capital projects • Added promising young and established
for US ball manufacturing plant players to our staff
• Sergio Garcia
• Investments to further momentum in green
• Xander Schauffele (2017 PGA Tour Rookie of the Year)
grass and custom fitting • Sam Burns (College Player of the Year)
• Continued investment in digital marketing • Maverick McNealy (Former #1 World Amateur)
and Direct to Consumer in Europe and • Si Woo Kim
Japan • Continue to invest in Tour to drive
shareholder value
• R&D, management talent
WITH OTHERS PULLING BACK OR EXITING, WE ARE FINDING INVESTMENT OPPORTUNITIES
15INVESTMENT IN BALL MANUFACTURING PLANT
Callaway making a significant investment in our Chicopee Ball
Manufacturing Plant to ensure continued success in our Ball Business
• Planning to invest approximately $25mm over a three period starting in 2016
• Ball revenues grew just over 6% in 2016 and just over 7% in 2017
Investments intended primarily to increase the quality and capability
• Enables new core designs
• Improves core compression and COR processes to allow more efficient transfer of energy
• Improvement in rubber mixing capabilities
• Improvements in Truvis design/printing capabilities
• Investments for continued improvement in consistency and quality for premium balls
Capacity Related
• Investments to expand Truvis and custom ball business
• Investments in TPU/Injection molding and rubber mixing to add overall capacity in premium
ball business
WITH OTHERS PULLING BACK OR EXITING, WE ARE FINDING INVESTMENT OPPORTUNITIES
16PRO TOUR: AUTHENTICATES THE BRAND
Phil Sergio Henrik Ollie Daniel Michelle Morgan
Mickelson Garcia Stenson Schniederjans Berger Wie Pressel
Danny Tom Jim Kevin Branden Marc Xander Emiliano
Willett Watson Furyk Kisner Grace Leishman Schauffele Grillo
PROS REPRESENT THE TOP OF THE PYRAMID OF INFLUENCE IN GOLF
17MARKETING: MULTI-CHANNEL BRAND CAMPAIGNS
Marketing mix includes:
• Print
• Television
• Video
• Social/Digital
OPTIMIZING MARKETING MIX TO REACH TODAY’S CONSUMER
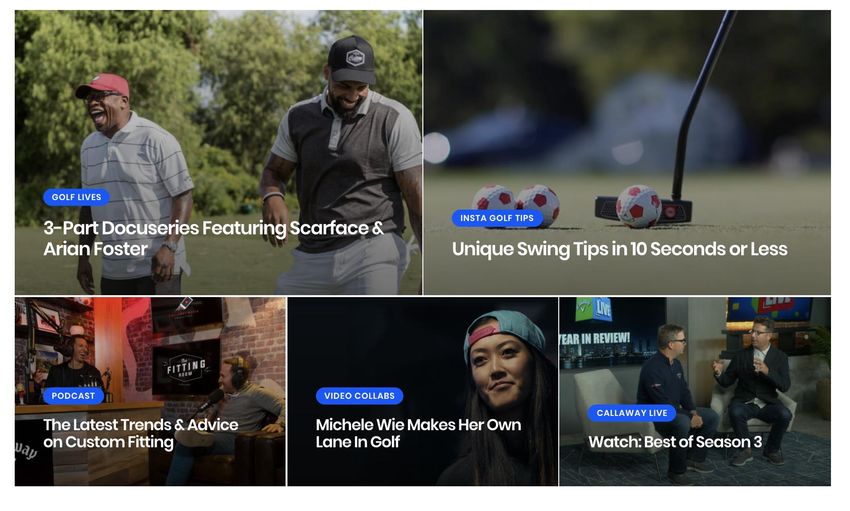
18INDUSTRY - LEADING DIGITAL MEDIA STRATEGY
• In-house studio producing professional, original content
• Ability to produce more content faster and at a lower cost than
outsourcing
• Deliver across multiple social media platforms
• Reach wide yet targeted audience on their time, their channels
• Make what is largely viewed as an aspirational brand more accessible
• Measurable and targeted beyond traditional marketing
capabilities
• Adding Direct to Consumer capabilities in Japan and
Europe
ENGAGING CONSUMERS
19OPERATIONAL EFFICIENCY CONTINUES TO BE A FOCUS
S&OP System Maturing Custom Assembly Execution
• Process has been implemented globally • Making investments in Made-to-Order (MTO)
• Continued investment in systems and process systems and processes
✓ Fill rates up ✓ Fill rates up on custom orders
✓ Inventory turns improvement ✓ Custom clubs revenue up over 50% in U.S. and
✓ Lower freight-in from suppliers and freight-out Europe in 2017
to customers ✓ That business now accounts for approximately
30% of our U.S. sticks’ business
Improving Quality System Facilities Improvements
• HD camera inspection • Global logistics reconfiguration
• Vendor quality systems • Rationalized golf ball manufacturing
• Global Statistical Process Control (SPC) • Reduced buildings to 2 in Carlsbad
• Upgrading international warehouse capabilities
✓ Enhanced brand perception
✓ Higher quality ✓ Facilities cost down significantly since 2012
✓ Local COGS % of sales down
20MARGIN EXPANSION DRIVEN BY OPERATIONAL FOCUS
• Improving Gross Margin through price Gross Margin Expansion
optimization and cost productivity 46%
44%
42%
• Restructured golf ball business; now 40%
37%
profitable and expanding
• Managing inventory better
• Longer life cycles
• Implemented postponement model
• New Sales & Operations Planning Process
2013 2014
2015
2016
2017
CONTINUOUS IMPROVEMENT MINDSET
21GOLF BALL SEGMENT
• Road to profitability
• Eliminated excess capacity and reduced overhead Segment Profitability(1)
$ in millions
• Rationalized supplier base
• Revamped supply chain $26.9
$23.9
• Executed on plant optimization strategy $19.0
$15.2
• Productivity gains resulted in 25%+
manufacturing cost reduction
($3.4)
• Our most profitable segment in 2017 ($14.5)
2012 2013 2014 2015 2016 2017
TURNAROUND IN PROFITABILITY
(1) Excludes Corporate G&A expenses and Other Income/Expenses not utilized by management in determining segment profitability.
22BALANCE SHEET AND CASH FLOW
(in millions, except percentages) As of Dec. 31, 2017 As of Dec. 31, Percent
2016 Change
Cash & Equivalents $86 $126 -32%
Asset-based Loans $88 $12 +633%
Available Liquidity(1) $239 $225 +6%
Net Accounts Receivable $95 $128 -26%
Inventory $262 $189 +39%
Cap Ex $26 $16
D&A $18 $17
Share Repurchase $17 $5
CONTINUING TO BUILD LIQUIDITY AND REDEPLOY CAPITAL TO DRIVE SHAREHOLDER VALUE
1) Available liquidity includes cash on hand, total capacity less outstanding balances under the ABL facilities and letters of credit.
23UPDATED FINANCING - Q4 2017
New Five Year $330M Facility, $360M including a Term Loan
• Replaces current $230M Base ABL with $60M Term Loan
• Backed by U.S./U.K./Canadian Receivables and Inventory, Intellectual Property and
the Carlsbad Headquarters Building
• $230M backed by U.S./U.K./Canadian Receivables and Inventory
• $50M of permanent liquidity backed by Intellectual Property
• $30M backed by Headquarters, which amortizes over 15 years
• $20M backed by Intellectual Property, which amortizes over 4 years
• $30M Term Loan backed by Intellectual Property
• Amortizes over 3 years with a one year holiday
• 6 month delayed draw
PROVIDES ADDITIONAL LIQUIDITY TO SUPPORT CORE AND RECENTLY ADDED BUSINESSES
24CAPITAL DEPLOYMENT PRIORITIES
Reinvest in the business to drive growth
• Building team, tools, processes and pipeline
Opportunistically and thoughtfully explore acquisitions and new ventures
• Seeking opportunities in golf or industries complementary to golf
• We must add value to target (i.e. international reach, R&D, etc.)
• Accretive to earnings in the near- to medium-term
Return capital to shareholders through buybacks and dividends
• $17 million worth of shares repurchased in 2017
• Annual dividend payment of $0.04 per common share
BALANCED APPROACH FOCUSED ON TOTAL SHAREHOLDER RETURN
25TOPGOLF INVESTMENT
High growth entertainment concept
• Combines driving range, nightclub, and dining experience into one venue
• 41 locations globally; adding 8-10/year in U.S.
• 18 additional sites planned and announced (including 5 international sites)
• Introduced Topgolf Swing Suites (3 locations with an additional suite
planned)
• Media Division – Acquisition of WGT and Protracer
Exclusive golf partner of Topgolf and ~14% owner
• Built our position over past decade
• On balance sheet at $70.6M cost basis
Complementary to core golf equipment business and strong
growth potential
TOPGOLF CONTINUING TO EXPAND LOCATIONS
26POSITIVE MOMEMTUM
Proven executive leadership
• Deep golf industry experience
• Fostering culture of innovation to further market share gains
Continued momentum
• Pivoted to growth strategy
• Share gains in all major markets with more runway
• Strong balance sheet and profitability
Signs of industry consolidation
• At retail and among equipment manufacturers
• Presenting opportunities for market participants willing and able to invest
FOCUSED ON INCREASING LONG-TERM SHAREHOLDER VALUE
27INVESTOR PRESENTATION MARCH 2018 APPENDIX
ADJUSTED EBITDA RECONCILIATIONS

             Source: Tables to the February 7, 2018 Earnings Press Release and the February 2, 2017 Earnings Press Release
                                                                                                                             29
2017 FULL YEAR P&L RECONCILIATIONS
Source: Tables to the February 7, 2018 Earnings Press Release
30INVESTOR PRESENTATION MARCH 2018
You can also read