Wacker Neuson Group - Working side by side with our customers
←
→
Page content transcription
If your browser does not render page correctly, please read the page content below
Wacker Neuson Group – Working side by side with our customers

                                           1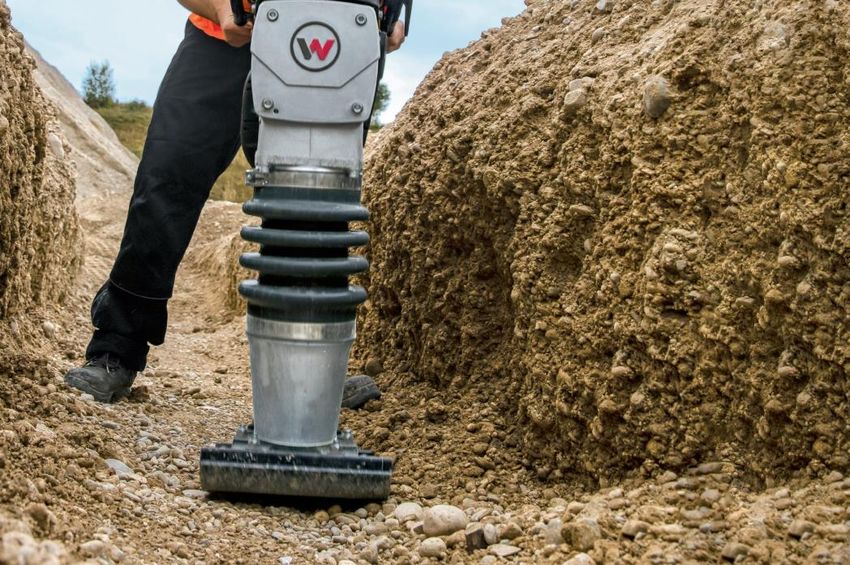
Why Wacker Neuson?            01

What makes us strong?         02

Where are we heading?         03

Appendix: Financial results   04

                                   2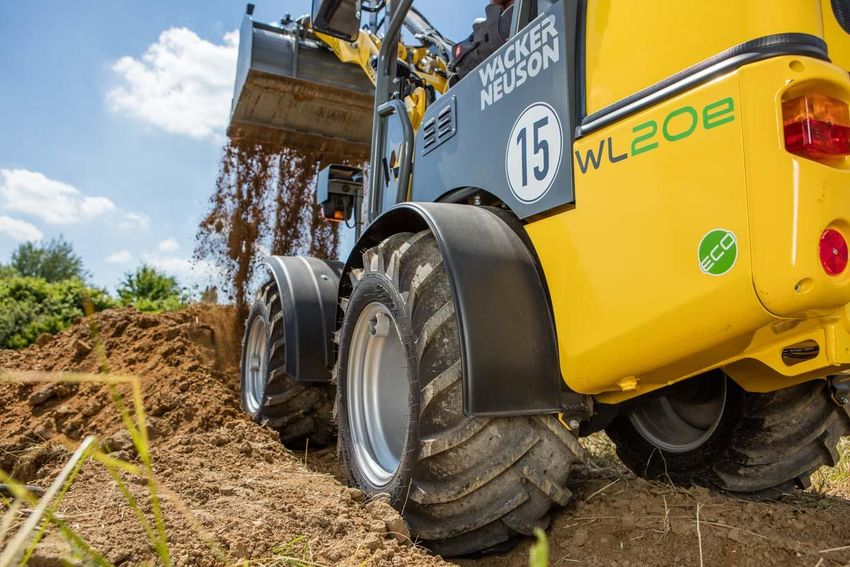
Why Wacker Neuson?
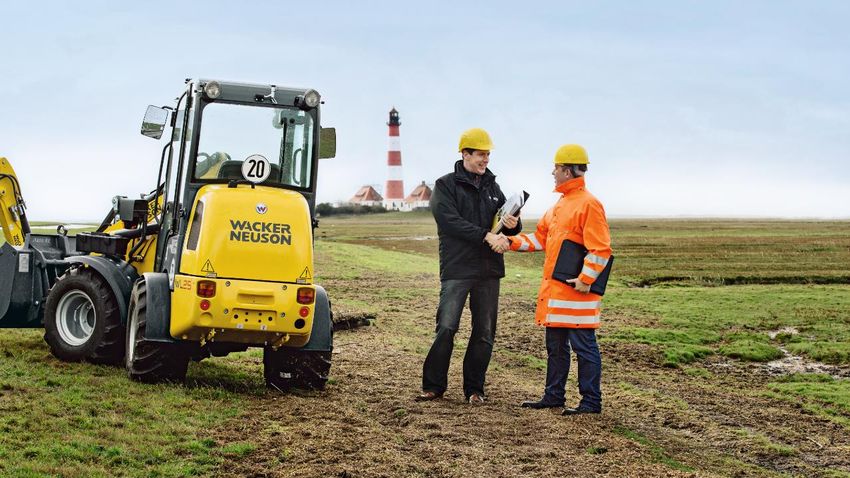
We align growth with our customers’ needs

           Maximum productivity & machine uptime

          Comfortable & intuitive machine handling

         Operator health & safety

        Service, Partnership, Reliability

        Attractive total cost of ownership

                                               4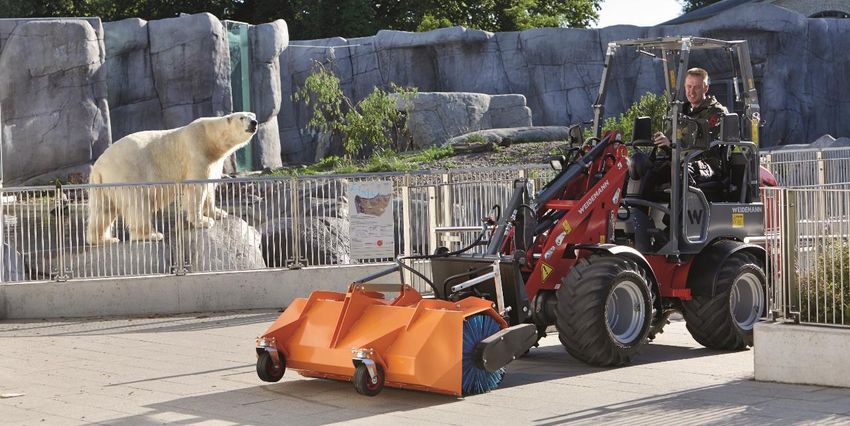
We drive innovation to improve our customers’ processes

                                                                  Wireless                                           On-site
                  Cockpit
                                                                  handling                                         support for
                 rotatable
                                                                   with no                                            our
                  by 180°
                                                                 emissions                                         customers

                                                  Shorter
                                                 process
                                                times due
                                                 to exact
                                                  vertical
                                                  digging

   Dual View Dumper          Vertical Digging System                     Zero emission            Onsite Box – mobile shop

                                              Operating
                                             equipment                               Maximizing
                                             without any                              operator
                                                 time                                 comfort
                                             restrictions

                                                                                                                   Flexibility
                                                                                                                   with one
               Give your                                                                                            battery
               machines a                                                                                           fitting 7
                 voice!                                                                                            products

  Connected products          Hand-arm vibrations                  Remote-control steering            Modular design

                                                             5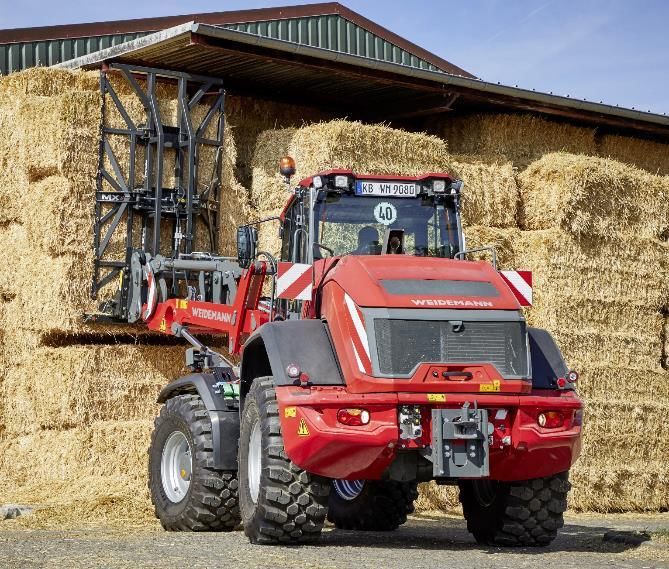
We see our customers as our partners

                                                Voice
                                             of Customer

                                                                 Strong customer involvement in R&D

           Front Loading
           With our accelerated
             customer-oriented                 Technical
           product development               benchmarking
          process, we provide our
          customers with the right
           features and the best                                   Sophisticated value engineering
          quality at the best price.

         Research & Development
                                           Early involvement
                                            of all functions

                                                               Teamwork at every step of the value chain

                                       6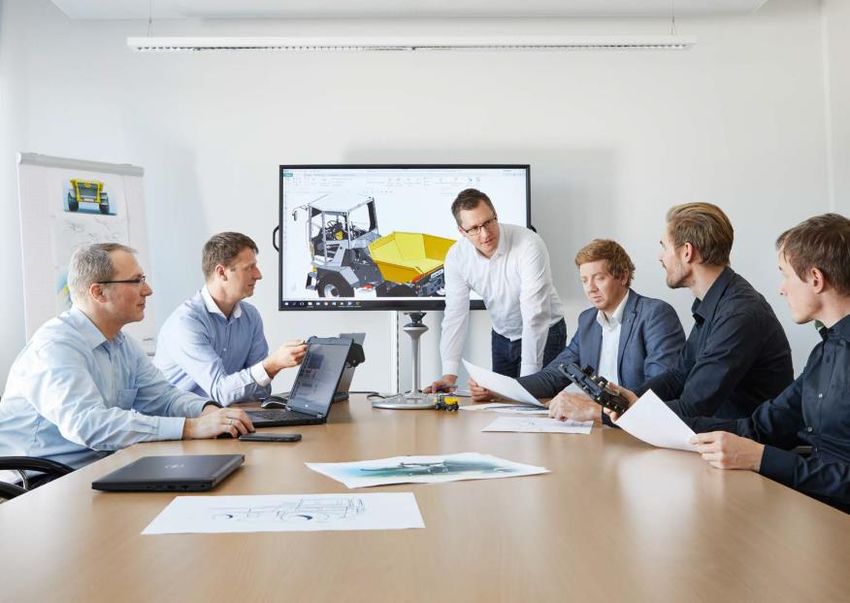
We are a one-stop provider with an unrivaled offering

       Light Equipment (LE)                                                                                   Compact Equipment (CE)
                                                            Different product groups

27%
 of Group sales1
                                                                                                                                   53%of Group sales1

                                                                     same customers

                                                                        Services

20%
 of Group sales1
                    Repair2 &     Rental Service2   Used Machines2    Financial
                                                                      Solutions       E-Store2   Telematics   Concrete    Academy            Genuine Parts
                   Maintenance2                                                                               solutions

                                                                                                                               1   FY 2018. 2 In selected countries.
                                                                                  7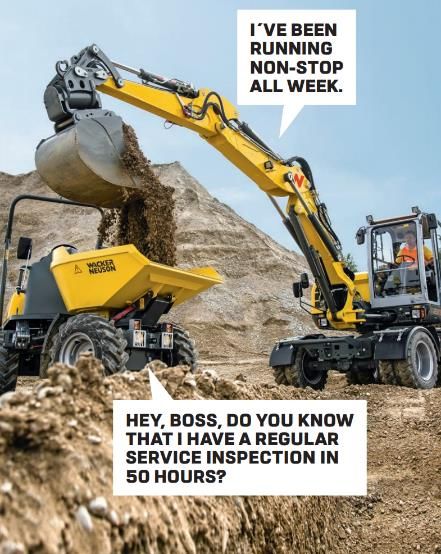
Customers trust in our longstanding expertise in LE

                      Light Equipment (LE)                                 In 1930, Wacker invented
                                                                           the electric rammer. The
Concrete technology                         Compaction                     term "wacker packer" is still
                                                                           used on construction sites.

Demolition                   Power & Lighting            Pumps

                                                                       27%
                                                                       of Group sales1                            Competitors include
                                                                                                                             Ammann

                                                                                   € 1,800
                                                         Heaters
                                                                                                                              Bomag
                                                                                                                           Husqvarna
                                                                                Average price of an LE product1            Weber MT

                                                                                                                                1   FY 2018.
                                                                   8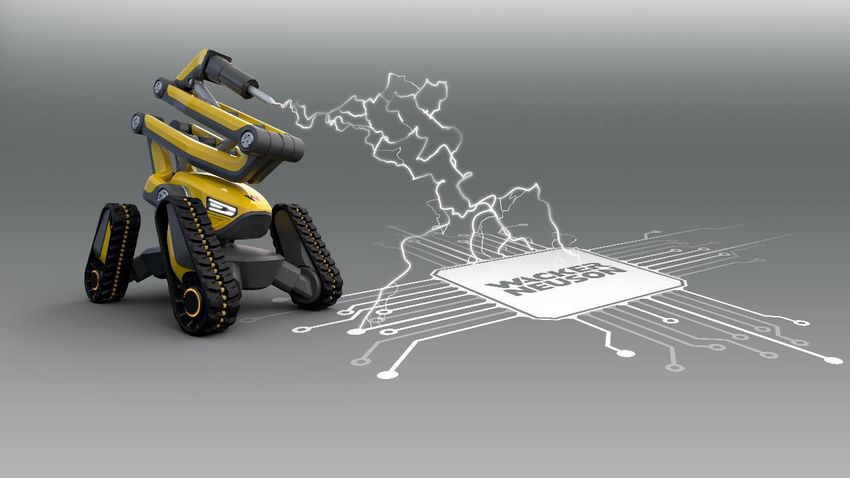
Customers opt for the advantages of compact equipment
Urbanization,                                                                             Compact Equipment (CE)
limited space and
mechanization are                                                  Excavators
driving demand for
compact equipment
in construction and
agriculture.
                       EUR 18 Bn
                            expected value of global compact
                               construction equipment market       Dumpers              Backhoe loaders             Skid steers / Compact track loaders
                        accessible to Wacker Neuson in 20251

 Competitors include
 Kubota
                                        53%
                                         of Group sales2
                                                                   Telehandlers                                  Wheel loaders

 Takeuchi
 Yanmar
 Manitou
 JCB
                        € 32,000
                           Average price of a CE product2
 Bobcat (Doosan)

                                                                                  1   own estimates, based on underlying data from CECE and Off-Highway Research 2 FY 2018.
                                                               9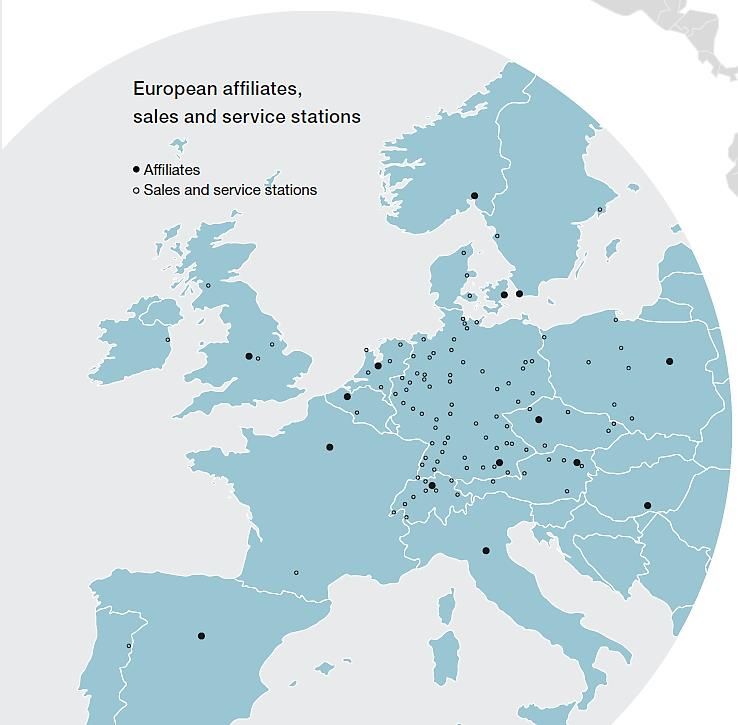
Market leaders trust in the WN Group’s high quality products

          Sales (EMENA & CIS1)          OEM (global2)                                               OEM (APAC)

            Kramer3 distributes     Wacker Neuson produces                                  Wacker Neuson produces
          via JD’s dealer network       for Caterpillar2                                        for John Deere

                                                             1   Commonwealth of Independent States. 2 Not in Japan, phasing out. 3 Kramer “green line” only.
                                              10
Service is key to our customers’ success
Customer proximity Comprehensive services Collaborative relationship
Service,
20%
of Group sales1
We are there for our customers, listening,
sharing our expertise and working closely
with them to find the best solutions.
Partnership, Repair2 &
Maintenance2
Rental Service2 Used Machines2
Reliability
Financial Telematics
Solutions E-Store2
150 sales Concrete Solutions Academy Genuine Parts
and service
locations
>500
service technicians
in close proximity
to our customers
1 FY 2018. 2 In selected countries.
11What makes us strong?
12We serve our markets with three strong brands
Construction, gardening/landscaping, maintenance/repairs, etc. Agriculture, horse breeders, tree nurseries, etc.
13Our diversified sales organization responds to regional needs
Direct sales & Key accounts
Dealers eCommerce1
rent to sell1 & rental firms
Country-specific sales with long-standing customer relationships
1 In selected countries.
14We drive electrification in our industry
“If we learn early enough that
ambitious climate demands will
be imposed, we can drive
innovation forward by
demanding zero-emission
solutions from machinery
manufacturers, equipment
suppliers and contractors.”1
AS60e
Through a smart and AP1840e AP2560e
EZ17e
innovative procurement
AP1850e
strategy, the City of Oslo
reduces climate gas
emissions at
ACBe
construction sites.
Change
We are well prepared for the
DT10e
shift to zero emission
construction sites DW15e
Full portfolio of zero emission products
1 Ole Henrik Ystehede, director of EBA (Contractors Association - Building and Construction) for Oslo/Akershus/Østfold.
15Digitalization creates new opportunities for our business
Give your machines a voice
Connected products –
always a step ahead
Pinpointing location –
connected jobsites
Increasing runtime –
predictive maintenance
Optimizing utilization
Transparency –
Real-time data analysis
Increasing efficiency –
smart products
16Our diversified business balances out cyclical fluctuations
15% of Group sales
from agriculture2
Focus on
maintenance & repair
[units] [€ m] Different cycles in of infrastructure
agriculture & large infrastructure
1,200,000 2,000 construction projects have no major
impact on our
-33% business
1,000,000
1,600
800,000 Resilience
1,200 to cyclical Rental equipment as
buffering alternative
600,000 Broad customer fluctuations to purchasing new
base, diversified machines
800 target industries maximum
400,000 +39% flexibility for
customers
400
200,000
0 0
Only small
investment volumes
1
Global equipment sales (units) Revenue WN Group (€ million)
>10
different target
required
industries
1 Source: Off-Highway Research, April 2019. 2 FY 2018
17Where are we heading?
We are on a steady growth path

                                Strategy                                                    >2 Bn
                                                                                               revenue

                                    2022                            targets

 Revenue development                                                                                     2 times
                                                                                                             market growth
[€ m]
                                    CAGR +10.8%

                                                                              1.9 Bn
                                                                               1,900
                                                                     1,707
                                                            1,534
                                            1,375   1,361
                                    1,284
                            1,160
              992   1,092
        758

                                                                                       19
Internationalization – plenty of room to grow
+11%
73%
[€ m] 1,248.9
1,129.8
1,020.7
of Group sales1
4%
23%
of Group sales1
2016 2017
EUROPE
2018 of Group sales1
+28%
+11%
[€ m] 59.8
397.8
[€ m]
357.5 48.9
46.6
291.8
2016 2017 2018
2016 2017 2018
AMERICAS APAC
1 FY 2018.
20Americas – Anchor dealer strategy to accelerate our growth
Skid steer market North America1 (units)
89,000 91,000
60 years
in the US light equipment market with
81,000
high market shares
2016 2017 2020e
“The equipment [...] rental industry is
growing and continues to expand faster
than the overall economy. […] In the
2018 U.S., equipment and event rental
revenue is expected to grow another
4.2 percent in 2020, 4.3 percent in
2021 and 4.7 percent in 2022 to reach
Light Equipment $63.5 billion.”2
Compact Equipment
Services
Financing Extension of Skid steers as Large
programs set anchor dealer door opener potential for
up to enable network for LE for compact further market
future growth & CE equipment share gains
1 Source: CECE, Off-Highway, 2018. 2 John McClelland, ARA vice president, May 2019.
21Europe – We are striving to increase market shares
Further Gaining Expansion in
strengthening of significant market agriculture with
our market shares in UK & Weidemann and
position France (i.a.) Kramer
Major market shares in DACH –
plenty of room for growth
in other regions
“The market is maturing and
growing, which is encouraging.
Businesses across Europe
increasingly use rental as part of
Game
their competitive toolkit as it
makes better use of capital,
minimizes environmental impact
and provides access to new
changer
equipment and expertise […].”1 We have redefined
2018 safety and accelerated our
customers’ processes with
our Dual View dumpers
Light Equipment
Compact Equipment
Services
1 Michel Petitjean, Secretary-General of the ERA, ERA Market Report 2018.
22Europe – We are growing our business in the ag sector
All-wheel steering
15%
of Group sales
Our customers are mainly dairy and
cattle farmers who work in confined
spaces such as stables.
+18%
growth in CE for the
from agriculture1 They require small, highly
maneuverable machines with a
minimal turning radius and
outstanding stability.
agricultural sector1
Articulated steering
Development of milk prices in Germany2
Price [cent / kg milk]
1 FY 2018. 2 Source: ife Institut für Ernährungswirtschaft, Kiel, September 2019.
23APAC – We benefit from structural market changes in China
Changing market structure in China – compact equipment on the rise1 2018
100%
72,000
65,000
80% Light Equipment
52,100
Compact Equipment
60%
Services
40%
20%
0% 2018 2019e 2023e
Mini excavator market China 2018 – 2023e (units)1
Crawler Excavators Wheeled Loaders
Mini Excavators Mobile Cranes
Compactors & Pavers Graders & Dozers
Partnership with Even small
Ramping up
John Deere will market shares
production at Cooperation with John Deere for the sale of
help improve would leverage “Deere”-brand mini and compact excavators
recently opened
utilization rate in our sales initially in China, Australia and selected Southeast
plant in China Asian countries.
new plant significantly
1 Source: Off-Highway Research, April 2019.
24APAC – In the region for the region
Newly opened production and R&D center in China
>20 years in the Chinese
light equipment market
China – divided competitive landscape
Our R&D team in
China comprises
Caterpillar
18
engineers
Sany
XuGong
(XCMG)
Volvo
Hitachi
Kobelco
LiuGong Kubota
working on
Doosan
solutions tailored
Hyundai
to the region2
Key Chinese players Key International players
Excavator: EZ17.
1 Source: Off-Highway Research, April 2019. 2 May 2019
25We benefit from megatrends
- Maintenance of - Food - Process
infrastructure optimization
- Mechanization
- Limited space - Telematics
- Infrastructure
- Clean air - Smart products
regulations - Housing
- Building Infor-
- Noise pollution - Energy efficiency mation Modeling
(BIM)
- Growing - Waste
middle class management
26Solid Balance Sheet Structure
54%Equity ratio1
1.9
Net financial debt/
EBITDA1
Excellent
basis
for further profitable growth
1 As at September 30, 2019.
27Clear-cut strategy and experienced management team
Martin Lehner
CEO
Responsible for strategy, procurement,
production, technology, quality, investor
relations, corporate communication,
sustainability, compliance, HR and legal
matters.
Wilfried Trepels
CFO
Responsible for finance, audit, IT,
Supply Chain and real estate.
Alexander Greschner
CSO
Responsible for sales, service and
marketing.
28Customer-focused strategy
CUSTOMER CENTRICITY
- Streamlining - Expansion of zero - Streamlining the
production sites emission product Group’s internal
portfolio supply chain
- Focus on core - Development of
areas of expertise - Better integration
digital solutions for
of sales and
our customers
production
- China as a
- Investment in
growth market - Employee
growth fund for
Industry 4.0 development
startups programs
29Share Development
The share in 20191 Dividend payout
% +3% 2.50 100%
175
62% 2.06 80%
53% 48% 53%
2.00 60%
150 38%
40%
1.50 1.30 20%
125 1.25
0%
1.10 Special
0.94
100 1.00 0.81 -20%
dividend
0.60 0.50-40%
0.50 0.50 0.50
75 0.50 -60%
0.60
-80%
0.00 -100%
2014 2015 2016 2017 2018
Wacker Neuson SDAX DAX Peer group2 EPS in € Dividend per share in € Payout ratio
Key figures per share Coverage3 Shareholder structure
Bank TP (€) Recom. Date
in € 9M/19 9M/18
Metzler 27.00 Buy July 04, 2019
Earnings per share 1.14 1.09 Warburg 23.00 Buy Jan 21, 2020
Jefferies 23.00 Buy Jan 28, 2020 Family 58%
Book value per share 17.35 17.11 Hauck & Aufhäuser 22.50 Buy Nov 12, 2019
Bankhaus Lampe 17.00 Buy Jan 23, 2020
Share price at end of period 16.00 22.08 Free float 42%
MainFirst 17.00 Neutral Oct 15, 2019
Commerzbank 15.00 Hold Jan 22, 2020
Market capitalization (€ m) 1,122.2 1,548.7 Kepler Cheuvreux 12.00 Reduce Jan 29, 2020 (Total shares: 70,140,000)
1 As at Dec. 31, 2019 2 Peer group: Ashtead, Atlas Copco, Bauer, Caterpillar, Cramo, Deutz, DoosanBobcat, Haulotte,
30 Husqvarna, John Deere, Komatsu, Manitou, Palfinger, Ramirent, Terex, United Rentals, Volvo. 3 As at Jan. 29, 2020.Wrap up
Innovation- and
Future-proof
market-leading Pioneers in zero Focus on the
product portfolio
Products position in light One-stop shop emission right products for
driven by
and compact solutions the right markets
innovation
equipment
Direct sales & rent Key accounts &
Sales channels Dealers eCommerce
to sell rental firms
Growth opportunities
Megatrends as Global trend towards
Growth potential in Europe, North
business drivers compact equipment
America and APAC
Focus on maintenance Broad customer base,
Resilience to
& repair of diversified target
cyclicality
infrastructure industries
High equity ratio,
Solid base family as anchor
shareholders
31Appendix – Financial results
32Key figures
Q3/19 9M/19
Revenue yoy EBIT yoy Revenue yoy EBIT yoy
+12% -4% +14% +4%
(€ 467 m) (margin: 8.6%) (€ 1,418 m) (margin: 8.8%)
Op. CF FCF Op. CF FCF
€2m € -17 m € -143 m € -203 m
(Q3/18: € 10 m) (Q3/18: € -3 m) (9M/18: € -26 m) (9M/18: € 9 m)
September 30, 2019
NWC ratio1: 48.1% DIO2: 173 days Equity ratio: 54.0%
(+9.8 PP yoy) (+22 days yoy) (-11.3 PP yoy)
1 Net working capital/annualized revenue for the quarter.
33 2 Days inventory outstanding: (inventory/annualized cost of sales for the quarter)*365.Revenue and earnings
Q3/19: Revenue remains on growth path Q3/19: Comments
Revenue +12% EBIT Revenue +12.4% yoy (adj. for FX effects: +11.1%)
[€ m] margin
600 25%
Strong growth in all reporting regions
516
500 455 466
435
467 Sustained above-average growth for compact equipment targeted at the
416 20%
379 392 371 agricultural sector (+23% yoy)
400
12.3% 15%
10.6% 10.1% 10.5%
300
7.8% 8.4% 8.6%
10%
Gross profit +3.5% yoy (gross profit margin -2.2 PP)
6.2% 6.9%
200
Cutbacks in production programs resulted in overcapacity, which
100 5%
impacted productivity at production plants
0 0%
Increase in profitability in the US could not be realized within the
Q3/17 Q4/17 Q1/18 Q2/18 Q3/18 Q4/18 Q1/19 Q2/19 Q3/19
planned timeline
Unfavorable product and customer mix for new equipment sales
Income statement (condensed)
€m Q3/19 Q3/18 9M/19 9M/18 EBIT -3.8% yoy (EBIT margin: -1.5 PP)
Revenue 467.2 415.8 1,417.9 1,240.9
Operating costs increased below average; their share of revenue
Gross profit 117.9 113.9 364.8 339.0
decreased by 0.7 PP yoy
as a % of revenue 25.2% 27.4% 25.7% 27.3%
SG&A incl. other income/expenses -77.7 -72.1 -240.1 -218.6 Decrease in gross profit margin could not be compensated for
as a % of revenue -16.6% -17.3% -16.9% -17.6%
EBIT 40.2 41.8 124.7 120.4 Earnings per share -5.1% yoy
as a % of revenue 8.6% 10.1% 8.8% 9.7%
Financial result -4.2 -2.6 -8.9 -7.9
Financial result € 1.6 m down on prior year: Attributable to a rise in
Taxes on income -10.3 -11.5 -35.7 -45.3 interest expenses caused by an increase in gearing and the initial
Profit for the period1 25.7 27.7 80.1 122.0 application of IFRS 16
EPS (in €) 0.37 0.39 1.14 1.74 Tax rate decreased slightly yoy to 28.6% (Q3/18: 29.3%)
Adj. EPS (in €)2 0.37 0.39 1.14 1.09
1 The 9M/2018 period includes an extraordinary earnings contribution of € 45.8 m after tax from the sale of a real
34 estate company belonging to the Group. 2 Adjusted to discount the extraordinary earnings contribution.Business development by region and business segment
Q3/19: Double-digit growth in all regions Q3/19: Comments
Revenue [€ m] Revenue Europe +10.0% yoy (adj. for FX effects: +9.9%)
share yoy EBIT1
Continued above-average growth in England, France, Germany, Austria,
Europe 337.6 72% +10% 36.0
the Czech Republic, Spain and Italy
Gains in particular with dumpers, wheel loaders, telescopic handlers and
Americas 114.9 25% +18% -1.9 compaction technology
Revenue generated with Weidemann- and Kramer-branded compact
Asia-Pacific 14.7 3% +32% -1.3 equipment for the agricultural sector +23% yoy
EBIT1 was clearly lower than the prior year at € 36.0 m (Q3/18:
Total Q3/19 467.2 100% +12% 40.2 € 47.9 m) due to, among other things, a drop in productivity;
positive effect through consolidation
Revenue Americas +17.6% yoy (adj. for FX effects: +12.7%)
Q3/19: Above-average growth with light equipment Continued strong growth in worksite technology, esp. generators and
light towers
Revenue [€ m]2
share yoy Significant gains with compact equipment imported from Europe
Light equipment 127.1 27% +17% EBIT1 improved vs. PY (Q3/19: € -1.9 m; Q3/18: € -3.6 m); still affected
by cutbacks in the production program and initial difficulties in rolling out
new processes in the US
Compact equipment 248.5 53% +13%
Revenue Asia-Pacific +32.4% yoy (adj. for FX effects: +32.4%)
Services 96.9 21% +6%
Despite the rise in revenue, earnings did not improve due to strong price
pressure in China (among other things)
Sale of equipment to OEM partner below planned figures due to difficult
Total Q3/19 467.2 100% +12%
market dynamics in China
1 EBIT for regions before consolidation.
35 2 Revenue by business segment before cash discounts.Inventory and receivables clearly above target, NWC elevated
Inventories Trade receivables
Inventories DIO1 Trade receivables DSO2
[€ m] [days] [€ m] [days]
700 633 645 663 400 500 200
553 413 400
600 371
500 400
500 439 459 462 300 320 150
434 304 303
300 273
400 179 173
249 235
150 141 153 151 144 155 200 78 73 78 100
300 130 67 64 67
200 60 55 59
200 100 50
100
100
0 0 0 0
Q3/17 Q4/17 Q1/18 Q2/18 Q3/18 Q4/18 Q1/19 Q2/19 Q3/19 Q3/17 Q4/17 Q1/18 Q2/18 Q3/18 Q4/18 Q1/19 Q2/19 Q3/19
Trade payables Comments
Trade payables DPO3
[€ m] [days]
Inventories and trade receivables remained significantly higher than
planned
300 400
Trade payables back at prior-year level after temporary rise in Q4/18
213 208 199 300
200 167
through Q2/19 (caused, among other things, by pre-buy engine stock-
163 164
149
120
134 200 building)
100 Significant rise in net working capital (see next slide)
41 43 50 46 50 56 59 48 43 100
0 0
Q3/17 Q4/17 Q1/18 Q2/18 Q3/18 Q4/18 Q1/19 Q2/19 Q3/19
1 Days inventory outstanding = (inventories/(cost of sales*4))*365 days; 2 Days sales outstanding =
36 (receivables/(revenue*4))*365 days; 3 Days payables outstanding = (payables/(cost of sales*4))*365 days.Free cash flow remains negative
Net working capital Cash flow from operating activities
Net working capital Net working capital Cash flow from operating activities
[€ m] [as a % of revenue] [€ m]
1000 899 100% 150
858
797 100 61
800 80% 63
620 638 644
568 583 50 8
600 536 48% 60% 6 10 2
46%
38% 39% 38% 42% 0
34% 34% 35%
400 40% Q3/17 Q4/17 Q1/18 Q2/18 Q3/18 Q4/18 Q1/19 Q2/19 Q3/19
-50
-41 -29
200 20% -100
-116
0 0% -150
Q3/17 Q4/17 Q1/18 Q2/18 Q3/18 Q4/18 Q1/19 Q2/19 Q3/19
Free cash flow Comments
Free cash flow
[€ m]
Increase in net working capital due to high levels of inventory and trade
receivables coupled with reduction in trade payables (see previous
slide)
80 51 57
46
40 Free cash flow at € -203 m after first three quarters of the year
0 Production cutbacks were more extensive than planned in order to
Q3/17 Q4/17 Q1/18 Q2/18 Q3/18 Q4/18 Q1/19 Q2/19 Q3/19
-40 rapidly reduce inventory levels while minimizing impact on market
-3 -12 -43 -17
-45
-80 prices
-120
-160 -143 Development of cash flow pushed net financial debt up further (see
next slide)
37Increased gearing in balance sheet
Net financial debt and gearing1 Net financial debt/EBITDA2
Net financial debt Net financial debt/
Gearing1
[€ m] EBITDA2 [x]
600 100% 2.0 1.9
513 1.6
484
500 80% 1.5
1.5
400 358 1.2
60%
300 41% 42% 0.8 0.8
1.0 0.8
195 193 188 193 205 29% 40% 0.7 0.6
200 148
18% 17% 16% 16% 17% 0.5
100 13% 20%
0 0% 0.0
Q3/17 Q4/17 Q1/18 Q2/18 Q3/18 Q4/18 Q1/19 Q2/19 Q3/19 Q3/17 Q4/17 Q1/18 Q2/18 Q3/18 Q4/18 Q1/19 Q2/19 Q3/19
Equity and equity ratio Comments
Equity Equity ratio
[€ m] Negative development of cash flow (see previous slide) pushes net
1,400 100% financial debt up to € 513 m
1,200 1,221 1,241 1,188 1,217
1,115 1,122 1,170
1,200 1,103 Gearing1 up further at 42%
80%
1,000
60% Net financial debt / EBITDA2 clearly above target corridor
800 67% 69% 65% 65% 65% 64%
58%
600 53% 54% 40%
400
20%
200
0 0%
Q3/17 Q4/17 Q1/18 Q2/18 Q3/18 Q4/18 Q1/19 Q2/19 Q3/19
1 Net financial debt/equity.
38 2 Net financial debt/annualized EBITDA for the quarter.FY 2019 – preliminary results
Current situation
(based on preliminary and unaudited figures)
Revenue EBIT
EUR 1.9 bn EUR 152 m
rev. guidance: 1.85 bn
vs. PY
EBIT margin Inventories
8.0 % EUR 600 m
(32% of sales)
rev. guidance: 8.3 – 8.8 %
Extensive cost reduction & efficiency enhancement program of EUR 50 million and an
inventory reduction of EUR 100 million launched by the Management Board.
39Cost reduction and efficiency enhancement program
Key provisions
Production & Purchasing Sales & Administration
Reduction on material costs Discounts and impairment 1
Underabsorption Restructuring sales organization
Purchasing costs Shipping costs
Restructuring costs (production affiliate USA)1 Restructuring costs (sales affiliate USA)
Reduction of inventory levels
Cost reduction and efficiency enhancement program covers all Group divisions.
4 focus topics each in production & purchasing and sales & administration
1 Topics which burdened profitability in 2019. Impact in 2020 is estimated to fade.
40Notes
vs. PY
41Notes
vs. PY
42Notes
vs. PY
43Financial calendar and contact
February 4, 2020 Hamburg investors' day (Montega)
March 16, 2020 Publication of the 2019 Annual Report, press conference, Munich
March 25, 2020 Bankhaus Lampe German Conference, Baden-Baden
April 1, 2020 MainFirst Corporate Conference, Copenhagen
May 7, 2020 Publication of Q1 report 2020
May 12, 2020 Berenberg Roadshow, Benelux
June 16, 2020 Commerzbank Roadshow, Zurich
June 17, 2020 Jefferies Roadshow, Milan/Lugano
Disclaimer Contact
This report contains forward-looking statements which are based on current estimates and assumptions made by corporate management at Wacker Neuson SE. Forward-looking statements are
characterized by the use of words such as expect, intend, plan, predict, assume, believe, estimate, anticipate and similar formulations. Such statements are not to be understood as in any way
guaranteeing that those expectations will turn out to be accurate. Future performance and the results actually achieved by Wacker Neuson SE and its affiliated companies depend on a number of risks
and uncertainties and may therefore differ materially from forward-looking statements. Many of these factors are outside the Company's control and cannot be accurately estimated in advance, such as Wacker Neuson SE
the future economic environment and the actions of competitors and market players. The Company neither plans nor undertakes to update any forward-looking statements.
IR contact: +49 - (0)89 - 354 02 - 427
All rights reserved. Valid February 2020. Wacker Neuson SE accepts no liability for the accuracy and completeness of information provided in this brochure. Reprint only with the written approval of
Wacker Neuson SE in Munich, Germany. The German version shall govern in all instances. ir@wackerneuson.com
www.wackerneusongroup.com
44You can also read