WE PACKAGING FOR A - BillerudKorsnäs

Page created by Bryan Wise
 
CONTINUE READING
WE PACKAGING FOR A - BillerudKorsnäs
WE
                     PACKAGING FOR A

Investor presentation | 13 February 2017
Per Lindberg, CEO
WE PACKAGING FOR A - BillerudKorsnäs
IMPORTANT INFORMATION
This presentation has been prepared by BillerudKorsnäsAB (publ) (together with any subsidiary or affiliate, “BillerudKorsnäs”) solely for use at its presentation to selected recipients (each referred to hereafter as
a “Recipient”). This presentation has been provided for information purposes only and should not be relied upon by the Recipients and no liability, responsibility, or warranty of any kind is expressed, assumed or
implied by (i) BillerudKorsnäs or (ii) SEB Enskilda, Skandinaviska Enskilda Banken AB (publ) or Svenska Handelsbanken AB (publ) (together, the “Joint Lead Managers”) for the accuracy, inaccuracy,
interpretation, misinterpretation, application, misapplication, use or misuse of any statement, claim, purported fact or financial amount, prediction or expectation. For purposes of this notice, this “presentation”
shall include these slides and any question-and-answer session that follows oral briefings by the executives of BillerudKorsnäs.

THIS PRESENTATION IS CONFIDENTIAL AND DOES NOT CONSTITUTE OR FORM PART OF, AND SHOULD NOT BE CONSTRUED AS A PROSPECTUS OR OFFERING MEMORANDUM OR AN OFFER
OR INVITATION OR RECOMMENDATION TO SUBSCRIBE FOR, UNDERWRITE OR OTHERWISE ACQUIRE, SELL OR HOLD ANY SECURITIES OF BILLERUDKORSNÄS, NOR SHOULD IT OR ANY PART
OF IT FORM THE BASIS OF, OR BE RELIED ON IN CONNECTION WITH, ANY CONTRACT TO PURCHASE OR SUBSCRIBE FOR ANY SECURITIES OF BILLERUDKORSNÄS, NOR SHALL IT OR ANY
PART OF IT FORM THE BASIS OF OR BE RELIED ON IN CONNECTION WITH ANY CONTRACT OR COMMITMENT WHATSOEVER. ANY OFFER OF SECURITIES OF BILLERUDKORSNÄS WILL BE
MADE BY MEANS OF A PROSPECTUS OR OFFERING MEMORANDUM THAT WILL CONTAIN DETAILED INFORMATION ABOUT THE COMPANY AND ITS MANAGEMENT, AS WELL AS FINANCIAL
STATEMENTS. ANY PERSON CONSIDERING THE PURCHASE OF ANY SECURITIES OF BILLERUDKORSNÄS MUST INFORM HIMSELF OR HERSELF INDEPENDENTLY BASED SOLELY ON SUCH
PROSPECTUS OR OFFERING MEMORANDUM (INCLUDING ANY SUPPLEMENT THERETO). THIS PRESENTATION IS BEING MADE AVAILABLE TO THE RECIPIENT SOLELY FOR THE RECIPIENT’S
INFORMATION AND BACKGROUND AND IS SUBJECT TO AMENDMENT WITHOUT NOTICE. NO PUBLIC OFFERING OF ANY SECURITIES HAS BEEN OR WILL BE MADE IN THE UNITED STATES.
RECEIPT OF THIS PRESENTATION CONSTITUTES AN EXPRESS AGREEMENT TO BE BOUND BY SUCH CONFIDENTIALITY AND THE OTHER TERMS SET OUT IN THIS “IMPORTANT NOTICE”.

This presentation should not be reproduced, distributed or transmitted to any person without the consent of BillerudKorsnäs and is not intended for distribution, in whole or in part, directly or indirectly, in any
country where such publication or distribution would violate applicable laws or rules or would require additional documents to be completed or registered or require any other actions to be taken in addition to the
requirements under Swedish law. Failure to comply with this instruction may result in a violation of the U.S. Securities Act of 1933, as amended (the “Securities Act”) or laws applicable in other jurisdictions.

The information in this presentation is supplied in summary form and is therefore not necessarily complete. This presentation does not constitute investment, legal, accounting, regulatory, taxation or other advice
and does not take into account investment objectives or the legal, accounting, regulatory, taxation or financial situation or particular needs of the Recipients. The material contained in this presentation may
include information derived from publicly available sources that have not been independently verified. No representation or warranty is made as to the accuracy, completeness or reliability of the information.

This presentation contains forward-looking statements that are based on current expectations or beliefs, as well as assumptions about future events. These forward-looking statements can be identified by the
fact that they do not relate only to historical or current facts. Forward-looking statements often use words such as anticipate, target, expect, estimate, intend, plan, goal, believe, will, may, should, would, could or
other words of similar meaning. Undue reliance should not be placed on any such statements because, by their very nature, they are subject to known and unknown risks and uncertainties and can be affected
by other factors that could cause actual results, and BillerudKorsnäs' plans and objectives, to differ materially from those expressed or implied in the forward-looking statements. Factors that could cause actual
results to differ materially from those described or implied in the forward-looking statements include, but are not limited to, changes in the global, political, economic, business, competitive, market and regulatory
environment, future exchange and interest rates, changes in tax rates and future business combinations or disposals. A summary of some of the potential risks faced by BillerudKorsnäs is set out in its most
recent Annual Report.

Forward-looking statements speak only as of the date they are made. Other than as required by applicable law or the rules of an applicable securities exchange, BillerudKorsnäs undertakes no obligation to
revise or update any forward-looking statement contained within this presentation or any other forward-looking statements it may make, regardless of whether those statements are affected as a result of new
information, future events or otherwise.

The Recipient understands that in order to be eligible to receive this presentation, the Recipient must be (i) a non-U.S. person that is outside the United States (within the meaning of Regulation S under the
Securities Act) or (ii) a qualified institutional buyer (“QIB”) in accordance with Rule 144A under the Securities Act, and by receiving this presentation, the Recipient warrants that it is (i) a non-U.S. person that is
outside the United States (within the meaning of Regulation S under the Securities Act) or (ii) a QIB.

The Recipient further understands that in order to be eligible to view this presentation, the Recipient must be a person: (i) who has professional experience in matters relating to investments being defined in
Article 19(5) of the United Kingdom Financial Services and Markets Act 2000 (Financial Promotion) Order 2005 (as amended) (the ‘‘FPO’’), (ii) who falls within Article 49(2)(a)-(d) of the FPO, (iii) who is outside
the United Kingdom, or (iv) to whom an invitation or inducement to engage in investment activity (within the meaning of section 21 of the United Kingdom Financial Services and Markets Act 2005) in connection
with the issue or sale of any securities may otherwise be lawfully communicated or caused to be communicated (all such persons together being referred to as ‘‘Relevant Persons’’), and by attending this
presentation, the Recipient warrants that the Recipient is a Relevant Person. In relation to each Member State of the EEA that has implemented the Prospectus Directive (each, a “Relevant Member State”), this
presentation and any related presentation may only be distributed to and accessed (i) by any legal entity which is a “qualified investor” as defined within the meaning of the law in that Relevant Member State
implementing Article 2(1)(e) of the Prospectus Directive; and (ii) in any other circumstances falling within Article 3(2) of the Prospectus Directive, provided that no such offer of securities by BillerudKorsnäs shall
require it or the Joint Lead Managers to publish a prospectus pursuant to Article 3 of the Prospectus Directive. “Prospectus Directive” means Directive 2003/71/EC (and amendments thereto, including the 2010
PD Amending Directive, to the extent implemented in the Relevant Member State) and includes any relevant implementing measure in each Relevant Member State and the expression “2010 PD Amending
Directive” means Directive 2010/73/EU.

                                                                                                                                                                                                                             2
WE PACKAGING FOR A - BillerudKorsnäs
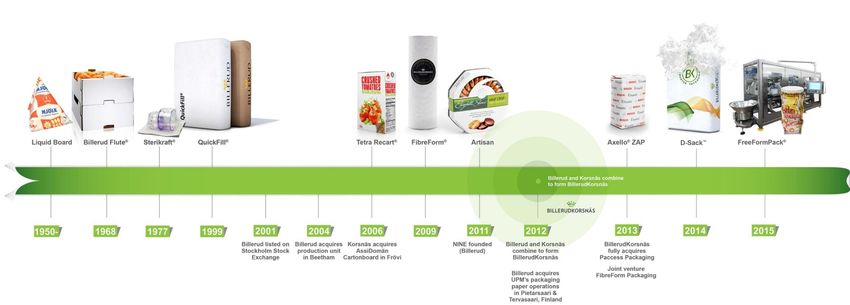
PURE PLAY PACKAGING MATERIALS COMPANY

     High
 performance
  packaging     Target customer segments requiring strong, light and/or pure packaging
  materials

   Stable
   product      74% of sales going to consumer sectors
  portfolio

 Sustainable
 alternatives
   through      Innovation challenging other materials and solutions
 innovation

   Strong
  financial     Well-positioned for profitable growth investments
  position

                                                                                         3
WE PACKAGING FOR A - BillerudKorsnäs
STRONG FINANCIAL DEVELOPMENT AFTER MERGER

                                                                 ADJUSTED EBITDA
                                        SEKm

                                        5 000                                                                       20%
     Successful synergies extraction                                                          17%
                                                                                                          18%
                                                                                16%                                 18%
                                        4 000
                                                     14%           14%                                              16%
     Lower relative currency exposure   3 000                                                                       14%
                                        2 000                                                                       12%
     Reduced pulp market exposure                                                                                   10%
                                        1 000
                                                                                                                    8%
     Broader product portfolio             0                                                                        6%
                                                    2012*          2013         2014         2015        2016
                                                             Adjusted EBITDA           Adjusted EBITDA margin

                                        SEKm                           NET DEBT
                                                                                                                   multiple
                                        10 000                                                                          5,0
     Rapid deleveraging:
         Strong cash flow generation     8 000                       3,3                                                4,0
                                                       2,9
         Asset disposal                  6 000                                   2,2                                    3,0
         Reduced working capital         4 000                                                                          2,0
                                                                                               1,2          1,1
                                         2 000                                                                          1,0

                                                0                                                                       0,0
                                                      2012*         2013         2014         2015         2016

                                                    Interest-bearing net debt      Interest-bearing net debt / EBITDA

                                                                                                                              4
*Pro-forma EBITDA
WE PACKAGING FOR A - BillerudKorsnäs
CAPITAL ALLOCATION POST MERGER
FOCUSING ON DEBT REPAYMENT AND DIVIDENDS

                                      CAPITAL ALLOCATION 2013 - 2016

      SEKm

     16 000
     14 000                                   940
               12 120          240
     12 000
                                                            4 100
     10 000
      8 000                                                               1 800

      6 000                                                                             2 600
      4 000
      2 000                                                                                            4 800

         0
              Cash flow     Change in     Divestment of   Base capex   Growth capex Distributed to Change in net
              generated   working capital    assets                                 shareholders       debt

                                                                                                                   5
WE PACKAGING FOR A - BillerudKorsnäs
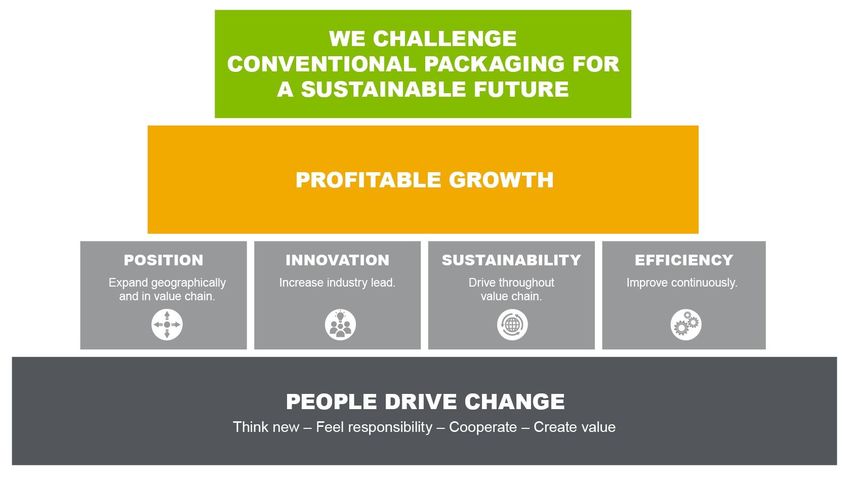
BILLERUDKORSNÄS IN BRIEF

            NET SALES
                                     Europe 72%
                                     Asia 17%                                                              PACKAGING PAPER
                                                                    OTHER

          21.7                       Africa 4%
                                     South America 3%                                    8%
                                                                                                           Kraft paper
                                                                                                           Sack paper
                                                                                                           Market pulp
              SEKbn                  Middle East 2%                                                  38%
                                                                                         SHARE
                                     Other 2%                                       37% OF SALES

              EBITDA*
                                                           CONSUMER BOARD                     17%

                                                           Liquid packaging board                          CORRUGATED SOLUTIONS

             3.8                                           Cartonboard
                                                                                                           Fluting
                                                                                                           Liner
              SEKbn                                                                                        Managed Packaging

                          7                                 3.0                                     4 300
                PRODUCTION UNITS                        PRODUCTION CAPACITY                         NUMBER OF EMPLOYEES
                   (SWE, FI, UK)                          (MILLION TONNES)
                                                                                                                               6
*Full year 2016. Excluding non-recurring items
WE PACKAGING FOR A - BillerudKorsnäs
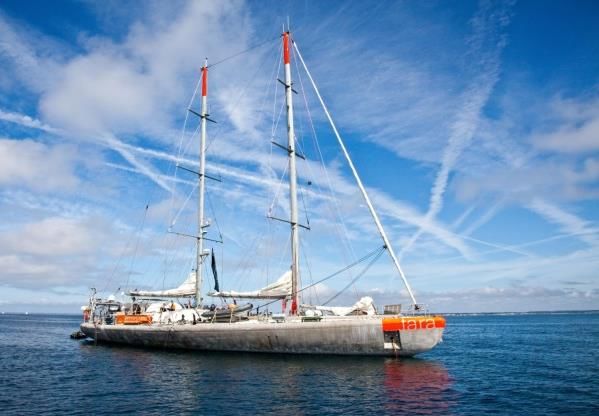
THREE BUSINESS AREAS WITH STRONG MARKET POSITIONS

       PACKAGING PAPER                    CONSUMER BOARD                CORRUGATED SOLUTIONS

% of business area sales volume:   % of business area sales volume:   %of business area sales volume:
Kraft paper                  60%   Liquid packaging board 85%         Fluting                           60%
Sack paper                   40%   Cartonboard            15%         Liner                             40%

                                            LIQUID                                                      PURE WHITE
  KRAFT PAPER                                                                   NSSC FLUTING
                                      PACKAGING BOARD                                                     LINER
                                     – AMBIENT PACKAGES
    #1                                                                             #1                     #2
  GLOBALLY                                 #1                                     EUROPE                  EUROPE
                                         GLOBALLY
                                                       LIQUID                              COATED WHITE
                SACK PAPER                       PACKAGING BOARD                             TOP LINER
                                               – ALL PACKAGE TYPES
                  #2                                                                           #2
                GLOBALLY                                  #2                                   EUROPE
                                                    GLOBALLY

                                                                                                                     7
WE PACKAGING FOR A - BillerudKorsnäs
AIMING TO CAPTURE GROWTH FROM GLOBAL
MEGATRENDS

                   Demographic shifts and
                   a changing world map

                   Sustainability connecting
                   several subtrends

                   Consumers and supply chains
                   are changing

                                                 8
WE PACKAGING FOR A - BillerudKorsnäs
PACKAGING PAPER & BOARD MARKET IS
GROWING BY 2.2%

                                                                                        Europe

   North-America

                                                                        1.5%

                             0.3%                                                                                               Asia
                                                                                       3.3%                   3.0%

                                                                           2.8%                                              Australasia
                                       2.7%                                                     Middle
                                                                                                East
                                                                                                                      0.4%
Central & South America                                        Africa

Estimated demand CAGR 2013-2030, combined market for cartonboard, containerboard and sack paper. Source: Pöyry 2014                        9
WE PACKAGING FOR A - BillerudKorsnäs
WE TARGET GLOBAL PACKAGING MARKET
GROWING BY 3.4%

                                                                                     Europe

   North-America

                                                                          1.8%

                               2.0%                                                                                 Asia
                                                                                     4.7%          5.1%

                                                                              4.4%                               Australasia
                                         3.7%                                             Middle
                                                                                          East
                                                                                                          2.2%
Central & South America                                          Africa

Estimated CAGR 2014-2024, for all packaging materials. Source: Smithers Pira 2014                                              10
WE HAVE ESTABLISHED A CLEAR GROWTH STRATEGY

                                          11
2016 – START OF TWO MAJOR RESTRUCTURING
    PROJECTS
    IMPROVING EFFICIENCY AND SECURING GROWTH

1    Moving unintegrated MG paper machine from Tervasaari, Finland to Skärblacka,                                     Karlsborg
     Sweden and making it integrated to the pulp production. SEK 1,2 billion investment.

2    Building new board machine at the production unit in Gruvön with capacity of                                    Pietarsaari

     approx. 550 000 t/a of liquid packaging board, cartonboard, food service board
     and white kraftliner. SEK 5,7 billion investment.                                                                Tervasaari

                                                                                                     Gävle

                                                                                              2              Frövi
                                                                                           Gruvön
                                                                                                                     1
                                                                                                    Skärblacka

                                                                              Beetham
                                             2
                        1
                                        Production start on
                  Production start on
                                        board machine in
                  MG machine in                               Machine in
                                        Gruvön
                  Skärblacka                                  Gruvön fully
                                                              utilised

 Q2         Q4               Q1                Q1
2016       2016             2018              2019                 2023                                                            12
TO IMPROVE UNDERLYING PROFITABILITY AND
SECURE ORGANIC GROWTH
   PACKAGING PAPER                 CONSUMER BOARD                CORRUGATED SOLUTIONS
     SELECTIVE GROWTH                VOLUME GROWTH                     VALUE GROWTH

Focusing on growth             Increasing volumes on             Expanding solution based
segments growing by            growing Liquid Packaging          sales to brand owners
2-4% per year                  Board and Cartonboard
                               markets                           Exiting oversupplied white
Decreasing volumes on                                            liner market
oversupplied markets

            Improved underlying EBITDA > +1 200 SEKm when fully implemented
            Continued growth with 3-4% per year

                                                                              Limited
     Lower currency        Reduced price           ROI well above
                                                                             exposure
        exposure             volatility in        our return target
                                                                              to pulp
       - SEK 2 bn         product portfolio            of 13%
                                                                              market

                                                                                              13
M&A MAY BOOST LONG-TERM GROWTH

 We have the financial capacity to add M&A growth to organic growth
 We have proven experience in merging businesses and quickly extracting
 synergies
 Bolt-on acquisitions with synergy potentials are currently the most interesting
 candidates

                                                                                   14
WE ARE INVESTING TO MOVE FURTHER UP THE VALUE
CHAIN TOWARDS BRAND OWNERS

    Packaging                                    Packaging
    material                                     material
    50-85 % of                                   2-5% of
    the cost                                     the cost

                 Price              Brand image
                 Payment terms      Package solution
                 Runability         Sustainability
                 Delivery terms     Shelf appearance

                                                             15
WE ARE EXPANDING THE REACH OF OUR OFFERING
OUR PRESENCE 2013 AND NEW SALES HUBS 2015

                                            Sweden
                                            Finland
                                            Germany
                                            UK
                                            France
                                            Spain
                                            Indonesia
                                            Italy
                                            UAE
                                            China
                                            Singapore
                                            Thailand
                                            US
                                            India
                                            Turkey
                                            South Africa

                                                           16
INNOVATION WILL FURTHER BOOST TOP LINE AND
    MARGINS
                                2015         2016         2020 Target
Proportion of sales accounted          17%          13%                 20%
for by new products

                                                                          17
SUSTAINABILITY AS A BUSINESS OPPORTUNITY

                       MAXIMIZING
                     POSITIVE IMPACT

                                   SUSTAINABLE
           INCREASED
                                  AND BIO-BASED
         CUSTOMER VALUE
                                     SOCIETY

                RESPONSIBLE VALUE CHAIN

                   MINIMIZING NEGATIVE
                          IMPACT

                                                  18
WE PROVIDE SUSTAINABLE SOLUTIONS
          Towards fossil-free production                                                                            Paper bag*
                                                                                                             Best choice for the climate

                                                                                            *BillerudKorsnäs paper bag from primary fibre, produced in Sweden

          Innovation for sustainability                                                                       Co-operation for learning

1 Life cycle assessment, Comparative study of virgin fibre based packaging products with competing plastic materials. IVL, 2015.

                                                                                                                                                                19
CREDENTIALS – WE WALK THE TALK

           ADVANCED LEVEL

                                 20
2016 HIGHLIGHTS

                                             ktonnes           SALES VOLUMES
                                              2 800

                                              2 750                              2 772
 Record high production and sales             2 700                      2 734
                                                                 2 699
 volumes                                      2 650

                                              2 600
 All-time high cash flow and EBITDA                    2 591
                                              2 550
 Several investments to accelerate            2 500
                                                       2013      2014    2015    2016
 growth in solutions sales
 Numerous recognitions for                   SEKm       OPERATING CASH FLOW
 BillerudKorsnäs’ leading sustainability     2 500

 position                                    2 000
                                                                                 2 101
                                                                         1 957
 Start of two major restructuring projects   1 500               1 739

                                             1 000

                                               500
                                                       529
                                                 0
                                                       2013      2014    2015    2016

                                                                                         21
FINANCIAL TARGETS AND TARGET FULFILLMENT
      FULL YEAR 2016

                         ORGANIC GROWTH 3-4 %
                                                                              EBITDA > 17%
                               PER YEAR

                                            0.3%
                                                              1
                                                                         ✔       18%
                                                                                          2

                                        ROCE > 13%                        Net Debt / EBITDA < 2.5

                     ✔                                                   ✔
                                                              2
                                             14%                                 1.08

                                                   DIVIDEND POLICY: 50% OF NET PROFIT
                                                       59% (proposal to the AGM 2017)

1.   For comparable units (excluding divested and acquired operations)                              22
2.   Excluding non-recurring items
DEBT MATURITY AND STRUCTURE

                       DEBT MATURITY PROFILE                                            DEBT STRUCTURE

   SEKm
  7 000
                                                                                                          Loans from
                                                                                                          financial institutions
  6 000
  5 000
  4 000
                                                                                                       1 500
                                                                                       1 800   SEKm
  3 000
  2 000
  1 000
                                                                                 MTN
                                                                                                 529
      0
            2017     2018       2019        2022      2023        2024   2025>
                                                                                                   Project financing
                    Interest bearing debt     Unused Credit Facility

  FINANCING CONSIDERATIONS
       Financial target Net Debt / EBITDA < 2.5

       Sources of liquidity in the coming 12 months to exceed uses by a factor of 1.2x

As per 2016-12-31                                                                                                           23
UPCOMING CAPEX NEEDS AND FINANCING STRATEGY

                                                                            CAPEX 2017-2019
    Capex financing through a mix of:
                                                         SEKm
        Cash flow
                                                         5 000
        Export credit facility
        Long-term debt                                   4 000

        Short-term funding sources                       3 000                        3 400
                                                                 3 000

    Maintaining financial flexibility                    2 000                                        200

    throughout investment period                         1 000
                                                                 1 300                1 300           1 300
    Diversified funding sources and an                      0
                                                                 2017                 2018            2019
    even maturity profile                                                Base capex    Growth capex

  DEBT PROGRAMS AND FACILITIES*

MTN program (5 000 mSEK)             1 800               3 200

Commercial paper program
(3 000 mSEK)                             3 000

Revolving credit facility
                                                 5 500
(standby facility 5 500 mSEK)

*As per 2016-12-31                                                                                            24
SUMMARY

 Focused product portfolio with leading global and regional positions
 in growing markets
 Global trends imply major growth opportunities
   Sustainability, demographic shifts, digitalization and changed consumer behavior

 We invest in all of our four strategic pillars:
   Position expansion, Innovation, Sustainability and Efficiency

 Two major restructuring projects to increase profitability
 and secure growth
 Strong financial position with low leverage and a well-balanced leverage policy

                                                                                      25
WE
     PACKAGING FOR A

                       26
APPENDIX

           27
SUCCESSFUL INTEGRATION HAS ENABLED A STRONG
PLATFORM FOR GROWTH

             2006   2009     2012   2013   2014   2015   2016   2017   2018   2019   2020   2021   2022

 Packaging focused materials and solutions                         Annual synergies of approximately SEK 530
 provider                                                          million

 Broader product portfolio                                         Sharply reduced pulp market exposure

 Higher portion of sales to consumer segments                      Lower relative currency exposure

                                                                                                               28
Q4 2016
   SALES VOLUMES REACHED ALL-TIME HIGH. NET SALES ON THE SAME LEVEL

                    SALES                                               NET SALES                          NET SALES*
kton               VOLUMES                             SEKm                                     SEKm     comparable units
                        +1.4%                                                      N/A                           +0.3%
2 700                                       2 772      21 000                   21 814 21 657   21 000
                                 2 734                                                                                   21 338 21 393
2 400
                                                       18 000                                   18 000
2 100
                                                       15 000                                   15 000
1 800

1 500                                                  12 000                                   12 000

1 200                                                   9 000                                    9 000

 900
                +3%                                     6 000      +5%                           6 000      +3%
 600         670        689                                     5 213   5 468                            5 213   5 375
                                                        3 000                                    3 000
 300

   0                                                       0                                        0
           Q4 15      Q4 16 Jan-Dec Jan-Dec                     Q4 15   Q4 16 Jan-DecJan-Dec             Q4 15   Q4 16 Jan-DecJan-Dec
                              15      16                                        15     16                                15     16
        * Excluding divested and acquired operations                                                                                 29
Q4 2016 - IMPROVED PROFITABILITY
ONE-OFF COSTS IN Q4 AND LATGRAN DIVESTITURE PREVIOUS YEAR

                                 EBITDA                                   Adjusted EBITDA*
SEKm                                                              SEKm

4 000                                               -10%          4 000                        +5%
                                           4 003
                                                                                                     3 836
3 500                                                     3 606   3 500                    3 661

3 000                                                             3 000

2 500                                                             2 500

2 000                                                             2 000

1 500                                                             1 500
                                                                             +34%
1 000               +3%                                           1 000
                                                                                  898
  500         671            693                                   500    672

     0                                                               0
             Q4 15          Q4 16        Jan-Dec        Jan-Dec           Q4 15   Q4 16   Jan-Dec   Jan-Dec
                                           15             16                                15        16
* Adjusted EBITDA is adjusted for items affecting comparability                                               30
Q4 2016 - FINANCIAL TARGETS

        OP. CASH FLOW                      Adjusted ROCE                                NET DEBT/EBITDA
SEKm                                      %                                  multiple
                                                                              2,50
2 100                                     15
                                 2 101
1 800                    1 957                              14                2,00
                                                 13
1 500
                                          10                                  1,50
1 200
                                                                                        1,24    1,27
 900                                                                          1,00                      1,08
                                          5
 600
                619
                                                                              0,50
 300    360

   0                                      0                                   0,00
        Q4 15   Q4 16   Jan-Dec Jan-Dec        Jan-Dec   Jan-Dec                        Q4 15   Q3 16   Q4 16
                          15      16             15        16
                                           ROCE based on rolling 12 months                                      31
OUTLOOK

  Demand and order situation for the first quarter is expected to be stable
  with normal seasonal variances for all business areas
  Average prices in local currency in the first quarter are anticipated to be
  unchanged in all segments except for the impact of previously announced
  price increases in the sack segment
  For the coming quarter the wood cost is expected to increase
  approximately 3% due to higher transportation cost. However no changes
  to wood prices are expected
  Investment level 2017 will be approximately SEK 4 300 million

  The Board of Directors proposes a dividend of SEK 4.30 per share for 2016

                                                                                32
PACKAGING PAPER
      SELECTIVE GROWTH
                                                                                                                                  % of Group
                                      Asset transformation for increased profitability                                                               NET SALES
                                                                                                                                               38%
                                                                                                                                                     SEKm
           2-4%
           CAGR
                                      Development of new business models
                                                                                                                                                     8 339
                                                                                                                                                     EBITDA
                                      Expansion to growing markets                                                                             41%
                                                                                                                                                     SEKm
                                                                                                                                                     1 486
                                              MAIN GROWTH DRIVERS
                                                                                                                                                     SALES VOLUME
                                                                                                                                               42%
             Population growth in emerging markets drives demand for food and building                                                               kTON
             materials packaging

             Ageing population drives demand for medical packaging
                                                                                                                                                     1 167
             Environmental awareness provides opportunities to substitute plastic
                                                                                                                                                     Full year 2016
             packaging

             Global cement demand CAGR 5.0%1

             Global food packaging demand CAGR 3.5%2

1. Estimated CAGR 2012-2022. Source: Freedonia World Cement Report (2013)                                                                                             33
2. Estimated CAGR 2014-2024. Source: Smithers Pira, The Future of Packaging – long-term strategic forecast to 2024 (2014), CAGR
CONSUMER BOARD
      VOLUME GROWTH
                                                                                                            % of Group
                                      Attractive market providing growth opportunities                                         NET SALES
                                                                                                                         37%
                                                                                                                               SEKm
           4-5%
           CAGR
                                      Investments for volume growth
                                                                                                                               8 015
                                                                                                                               EBITDA
                                      Innovation with customers and brand owners                                         48%
                                                                                                                               SEKm
                                                                                                                               1 723
                                              MAIN GROWTH DRIVERS
                                                                                                                               SALES VOLUME
                                                                                                                         38%
             High urbanization rate, primarily in Asia, drives demand for liquid packaging                                     kTON
             Change in consumer behavior drives demand for smaller packages
                                                                                                                               1 051
             Global liquid packaging board demand CAGR 3.4%1
                                                                                                                               Full year 2016
             Global cartonboard demand CAGR 4.0%2

1. Estimated CAGR 2014-2025. Source: BillerudKorsnäs analysis on Pöyry 2014 and Zenith International 2015                                       34
2. Estimated CAGR 2011-2025. Source: Vision Hunters 2015
CORRUGATED SOLUTIONS
      VALUE GROWTH
                                                                                        % of Group
                                     Strong product portfolio setting market standard                      NET SALES
                                                                                                     17%
                                                                                                           SEKm
           2-4%
           CAGR
                                     Integrating new business model
                                                                                                           3 620
                                                                                                           EBITDA
                                    Increasing sales to brand owners                                 23%
                                                                                                           SEKm
                                                                                                           829
                                           MAIN GROWTH DRIVERS
                                                                                                           SALES VOLUME
                                                                                                     20%
            Increasing e-commerce and fresh food consumption                                               kTON
            Package differentiation
                                                                                                           554
            Changing supply chains require simplification of packaging solutions
                                                                                                           Full year 2016
            Global containerboard demand CAGR 2.6%1

                                                                                                                            35
1. Estimated CAGR 2013-2025. Source: Pöyry 2014
WE HAVE INVESTED SEK 2 BILLION SINCE 2012 TO
INCREASE CAPACITY AND QUALITY LEAD

    PACKAGING PAPER           CONSUMER BOARD           CORRUGATED SOLUTIONS

260 SEKm                   1600 SEKm                 180 SEKm
Brown sack paper           Liquid Packaging Board    S/C fluting
- Improved paper quality   Cartonboard               - Improved quality
   restoring leadership    - Improved quality           enhancing leadership
- Increased capacity by    - Increased capacity by   - Increased capacity by
   20 000 tonnes              200 000 tonnes            40 000 tonnes

                           +260 000 tonnes
                                                                               36
GLOBAL PACKAGING MARKET

GLOBAL PACKAGING MARKET,                                          GLOBAL PACKAGING MARKET,
BY REGION1                                                        BY MATERIAL1

                                  Asia, 38%                                            Paper and board, 36%
                                  Europe, 27%                                          Hard plastics, 22%
                                  North America, 22%
                                                                                       Flexible materials excl. Paper, 16%
                                  South and Central America, 5%
                                                                                       Metals, 14%
                                  Middle East, 3%
                                  Africa, 2%                                           Glass, 7%

                                  Pacific Region, 2%                                   Other, 5%

  1. Source: Smithers Pira 2014                                                                                         37
SALES PER REGION

             PACKAGING PAPER                                       CONSUMER BOARD                                    CORRUGATED SOLUTIONS

    SALES PER REGION                                           SALES PER REGION                                       SALES PER REGION
    • Europe 70%                                               • Europe 69%                                           • Europe 72%
    • Asia 14%                                                 • Asia 22%                                             • Asia 19%
    • Africa 7%                                                • Middle East 5%                                       • Africa 5%
    • South America 4%                                         • Africa 2%                                            • South America 2%
    • Middle East 2%                                           • South America 2%                                     • Other 2%
    • Other 3%

All figures relate to sales in 2015. Figures for 2016 will be disclosed in BillerudKorsnäs annual report for 2016.                          38
PRODUCTION UNITS

SWEDEN                                            Total production capacity
Gävle, 725 ktonnes
Gruvön, 710 ktonnes
Frövi/Rockhammar, 470 ktonnes
Skärblacka, 420 ktonnes
Karlsborg, 300 ktonnes
                                                          2 970
FINLAND                                                    Thousand
Pietarsaari, 200 ktonnes
                                                            tonnes
Tervasaari, 100 ktonnes
(mill closed as of end of Q3 2016)

UNITED KINGDOM
Beetham, 45 ktonnes

 All figures relate to production capacity 2016                               39
SENSITIVITY ANALYSIS

IMPACT ON PROFIT/LOSS BEFORE TAX

 Variable                                                   Change                                               SEKm

 Sales volume                                               +/- 10%                                              +/-900

 Exchange rate, SEK1                                        +/- 10%                                              -/+640

 Fibre prices                                               +/- 10%                                              -/+700

 Price of electricity2                                      +/- 10%                                              -/+30

 Interest rate on loans3                                    +/- 1 percentage point                               -/+43

 1 Excluding effects of currency hedging.
 2 Excluding effects of electricity price hedging.
 3 Excluding effects of interest hedging.

All figures based on figures for 2015. Figures for 2016 will be disclosed in BillerudKorsnäs annual report for 2016.      40
COST STRUCTURE

                                            Fibre (wood and external pulp), 37%
                                                                                                      No significant forest assets
                                            Employee benefits expense, 16%
                                                                                                      Purchases made from handful of major
                                            Chemicals, 10%                                            suppliers
                                                                                                          Bergvik Skog, Holmen, Mellanskog, Stora
                                            Delivery expenses, 9%                                         Enso and Sveaskog
                                                                                                          Large amount of private land owners in
                                            Depreciation/amortisation, 7%                                 Central and Northern Sweden

                                            Energy, 4%                                                The majority of wood raw materials
                                                                                                      acquired locally
                                            Other variable costs, 4%
                                                                                                      About 20% of the wood requirement is
                                            Other fixed costs, 13%                                    imported
                                                                                                          Majority from the Baltics

All figures relate to cost structure 2015. Figures for 2016 will be disclosed in BillerudKorsnäs annual report for 2016.                            41
FX RISK
          Total net currency exposure of SEK 6.4 billion                BillerudKorsnäs uses Swedish Riksbank’s FIXING rate (Month
                                                                        End)

                                                                        During month Sales, AP, AR etc: End of month rate previous
                 GBP 10%
                                                                        month

                                                                        AP and AR: revalued to at end of month using End of month rate.
                                                                              Revaluation of AR booked in ”Currency hedging etc”
              USD 30%                                 EUR 60%                 Revaluation of AP in Business areas

                                                                        FX contracts: Market value at month end. Contracts due within
                                                                        two months in Sales (”Currency hedging, etc”), rest is booked in
                                                                        Balance Sheet (OCI).

                         FX Hedge (SEK hedge) %
               100%
Average
               80%
hedge rates
               60%
EURSEK
9,55
USDSEK         40%
8,70
GBPSEK         20%
11,50
                0%
                                                                        FX hedging policy
                      Q4-16   Q1-17   Q2-17   Q3-17    Q4-17    Total      0-80% of flows over coming 15 months
         EUR          79%     78%     78%     78%      70%      76%
                                                                           0% is default hedge level
         USD            88%   71%     64%     59%      48%      66%
                                                                           No speculation in FX movements
         GBP            31%                                     6%
         Max policy                                             80%

        As per 2016-12-31                                                                                                                  42
OWNERSHIP STRUCTURE

                                      Shareholder                            Number of shares    Percent of votes
                                      FRAPAG Beteiligungsholding AG                 31 300 000               15.1
                                      AMF Insurance & Funds                         20 583 373                9.9
                                      Swedbank Robur Funds                           9 384 808                4.5
                                      Fourth Swedish National Pension Fund           6 578 034                3.2
                                      Alecta                                         5 448 000                2.6
                                      Handelsbanken Funds                            4 656 994                2.2
                                      DFA Funds (USA)                                4 159 482                2.0
                                      Norges Bank Investment Management              4 142 062                2.0

  Foreign shareholders. 41.2%         Vanguard                                       3 272 338                1.6
                                      Lannebo Funds                                  2 200 000                1.1
  Swedish mutual funds, 23.7%         Total 10 largest shareholders                 91 725 091               44.2
                                      Total excluding share buy-backs              207 089 336              100.0
  Swedish individuals incl. closely
  held companies, 19.3%
                                      The company’s own bought-back shares           1 130 498                0.0
  Swedish institutions, 15.8%
                                      Total                                        208 219 834              100.0

Ownership structure per 2016-12-31                                                                                  43
BILLERUDKORSNÄS SHARE

      Symbol: BILL
      Trading platform: Nasdaq Stockholm
      IPO: November 20, 2001

                  Share performance 2017
                                                                                    Share performance 2006-2016
170                                                                 170
160                                                                 150
150                                                                 130
140                                                                 110
130                                                                  90
120                                                                  70
110
                                                                     50
100
                                                                     30
90
                                                                     10
80
                                                                    -10

      BILL   OMX Stockholm PI   OMX Stockholm Forestry & Paper PI         BILL   OMX Stockholm PI   OMX Stockholm Forestry & Paper PI

                                                                                                                                        44
45
You can also read