Forecast 2025 for the global Foundry Industry - Düsseldorf, June 2019 Dr. Heinz-Jürgen Büchner - Foundry Gate

 
CONTINUE READING
Forecast 2025 for the global Foundry Industry - Düsseldorf, June 2019 Dr. Heinz-Jürgen Büchner - Foundry Gate
Forecast 2025 for the global Foundry Industry
Düsseldorf, June 2019
Dr. Heinz-Jürgen Büchner
Forecast 2025 for the global Foundry Industry - Düsseldorf, June 2019 Dr. Heinz-Jürgen Büchner - Foundry Gate
Agenda
                                                                2

    1    Macroeconomic Environment                                  3

    2    Forecast 2025 for the Global Foundry Industry              14

    3    Future Challenges for the worldwide Casting Industry       22

    4    Appendix                                                   25
Forecast 2025 for the global Foundry Industry - Düsseldorf, June 2019 Dr. Heinz-Jürgen Büchner - Foundry Gate
Agenda
                                                                3

    1    Macroeconomic Environment                                  3

    2    Forecast 2025 for the Global Foundry Industry              14

    3    Future Challenges for the worldwide Casting Industry       22

    4    Appendix                                                   25
Forecast 2025 for the global Foundry Industry - Düsseldorf, June 2019 Dr. Heinz-Jürgen Büchner - Foundry Gate
Lower Growth Rates
                                                                                                                  4

                        US Real GDP; qoq; in%                          China Real GDP; yoy; in %

                     Euro Zone Real GDP; qoq; in %                               In Detail
                                                     ➢ The US-GDP grew by 3.1 % (qoq) during the first quarter of
                                                       2019. In total, the economic development was very strong.
                                                       Therefore, IKB forecasts a growth rate of 2.6 % in 2019
                                                     ➢ China‘s economy had a strong start into the current year.
                                                       The GDP grew by 6.4 % yoy. The consensus forecast had
                                                       expected a lower growth in relation to the last quarter. We
                                                       expect an average growth of the industrial production
                                                       between 5 and 6 % in the current year
                                                     ➢ Eurostat confirms for the euro zone a GDP growth of 0.4 %
                                                       qoq for the first quarter of 2019: A significant improvement
                                                       in relation to the previous quarter. IKB forecasts for the euro
                                                       zone a GDP growth of 1.2 % in 2019
Sources: Bloomberg
Forecast 2025 for the global Foundry Industry - Düsseldorf, June 2019 Dr. Heinz-Jürgen Büchner - Foundry Gate
Crude Oil: Geopolitical Disturbances
                                                                                                                                                         5

                          Brent Blend; US-$/Barrel1)                                                     High Realibility of Supply

160                                                                                  ➢ In 2018 a strong rise of the worldwide demand for crude oil
                                                                                       was seen: On average the demand rose by 1.4 mbd (million
140
                                                                                       barrel per day) to 98.75 mbd
120
                                                                                     ➢ For 2019, we expect another rise in the global crude oil
100                                                                                    demand of 1.15 mbd to nearly 100 mbd
 80
                                                                                     ➢ In addition to a higher oil production in Non-OPEC countries
 60                                                                                    an OPEC production of 35.4 mbd will be necessary.
 40                                                                                    Around 4.8 mbd will come from the OPEC NGL grades
 20                                                                                  ➢ As a result an OPEC production of around 30.5 mbd is
  0                                                                                    necessary in the current year. This equals the OPEC monthly
   2007          2009         2011         2013          2015          2017   2019     production in the first quarter of 2019. But in April and May
                                                                                       2019 the monthly production of the OPEC was below this level
                                                                                     ➢ We have seen a rise in geopolitical disturbances, e.g. the
                             Active Oil Rigs USA2)
                                                                                       war in Yemen, the war in Syria and the political instability in
                                                                                       Venezuela. But the highest risk in our point of view is the
                                                                                       conflict after the cancellation of the nuclear agreement with
                                                                                       Iran by President Trump
                                                                                     ➢ The number of active oil rigs in the United States of America
                                                                                       equal 788, significantly below the peak
                                                                                     ➢ Therefore, we forecast a crude oil price fluctuating between
                                                                                       60 and 70 US-$ per barrel Brent for the next three months of
                                                                                       2019. WTI will be around 8 US-Dollars per barrel below the
                                                                                       Brent price

Sources: 1) Bloomberg 2) Baker Hughes North America Rotary Rig Count
Forecast 2025 for the global Foundry Industry - Düsseldorf, June 2019 Dr. Heinz-Jürgen Büchner - Foundry Gate
Higher Geopolitical Risks
                                                                                                                                              6

                     Crisis in the Middle East                                            Brexit: Is it time to say “Good bye”?
➢ The main geopolitical risks are the wars in Yemen and Syria, the         ➢ The retirement of Prime Minister May raises the possibility of a
  political instability in Venezuela and the cancellation of the nuclear     hard Brexit
  agreement with the Iran including strong sanctions                       ➢ We could see a rising uncertainty in the British sentiment
➢ We see no process of democratization in Saudi-Arabia                       indicators, which have been going down since the summer of
➢ Iran‘s threat to close the Strait of Hormuz – an important part of the     2018
  crude oil exports from the Gulf region is passed through the Strait      ➢ For the second quarter of 2019 a decrease in the British GDP
  of Hormuz – could induce an explosion                                      is expected as a result of anticipatory effects of the Brexit
➢ The attacks on several oil tankers lead to a rise in insecurity in       ➢ A hard Brexit will induce a reduction in economic growth in the
  the region                                                                 countries of the EU

                      Tweets and Trade Wars                                                   Tariffs on Automotive Imports
➢ For President Trump there are threats concerning tariffs on imports      ➢ Trump is threatening to impose tariffs on imports of European
  and other sanctions, an instrument to sharpen his domestic                 light vehicles as a possible reaction in the trade conflict. His main
  political profile                                                          focus is on deliveries from Germany
➢ Even very newly closed agreements (e.g. with Mexico) are no              ➢ The EU proposal to eliminate tariffs on light vehicles was
  longer reliable                                                            rejected by Trump as insufficient. Reason: Europeans are used
➢ The conflict with China has more and more negative impacts on              to buying European cars, thus American OEM’s do not have a
  the major trading partners                                                 real chance
➢ Does it make sense to close agreements and contracts with the
                                                                           ➢ The US-American car manufacturers are in total against tariffs
  US government, if a quick cancellation via tweets is possible?
                                                                             on car imports
Forecast 2025 for the global Foundry Industry - Düsseldorf, June 2019 Dr. Heinz-Jürgen Büchner - Foundry Gate
Production of Light Vehicles
                                                                                                                         7
  In million €

                                                                                               China
                                                    Europe
                 North America

                                                                                                          Japan/ Korea
                                                 Middle East / Africa

                                                                             South East Asia

                                 Latin America

➢ The European automotive industry recovers. The growth is stronger in the Eastern European countries
➢ Within the NAFTA we see a rising importance of Mexico: The new manufacturing plants of several global OEM‘s will not
  reduce their production volume as a result of “America First”
➢ Japan and Korea will lose production volume to new manufacturing plants in China

Source: IHS March 2019
Forecast 2025 for the global Foundry Industry - Düsseldorf, June 2019 Dr. Heinz-Jürgen Büchner - Foundry Gate
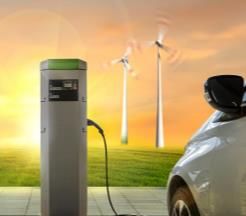
Production of Medium & Heavy Vehicles
                                                                                                                                                                                   8
  In thousand €

                                                                                                                                   China
                                                                                   Europe

                                                                    662     724      767     806     797

              North America
       602    561    570    593      599                            2018    2020     2022    2024    2025

       2018   2020   2022   2024     2025                                                                                                                     Japan/ Korea
                                                                                  Middle East / Africa
                                                                                                                                                       271     259   260    254        251
                                                                            1        1       1       1       1

                                                                           2018     2020    2022    2024    2025                                       2018   2020   2022   2024       2025

                                                                                                                          South East Asia

                                           Latin America                                                           696                   703    713
                                                                                                                           683    688

                               141      169    193    151    160

                                                                                                                   2018    2020   2022   2024   2025
                              2018     2020    2022   2024   2025

➢ Stronger emission regulations in the European Union and the US induce a reduced fuel consumption
➢ This stimulates investments in a new generation of trucks and commercial vehicles

Source: IHS January 2019
Global Electrical Vehicle Stock with strong Growth
                                                                                                                                                                        9

                                    Outlook to 2030                                                                                              In Detail
In million                                                                                                 ➢ The following forecast is the basic scenario of the
 140                                                                                                         International Energy Agency (IEA). The scenario is based
                                                                                                             on the announced policies and measures that
                                                                                                             governments all over the world put in place
 120                                                                                                       ➢ In 2020, the global stock will rise to 13 million vehicles from
                                                                                                             3.7 million in 2017
 100                                                                                                       ➢ Between 2020 and 2030 the total stock of vehicles will
                                                                                                             nearly tenfold to around 130 million in this scenario
                                                                                                           ➢ The increase will result primarily from the private
   80                                                                                                        passenger light vehicles market
                                                                                                           ➢ In the commercial sector we see – with the exception of
   60                                                                                                       buses – only a very slight rise

   40

   20

     0
      2017                         2020                         2025                         2030
        PLDVs - BEV                       PLDVs - PHEV                       LCVs - BEV
        LCVs - PHEV                       Buses - BEV                        Trucks - PHEV

1) PLDV = Passanager light duty vehicle; LCV = light commerical vehicle; BEV = battery eletric vehicle; PHEV = plug-in hybrid electric vehicle
Source: International Energy Agency ; Picture credit: Lynk & Co 01
Mechanical Engineering: Slight Recovery in Europe, Growth in Asia
                                                                                                                                                                         10
  In billion €

              North America                                                           Europe                                                        China
                                                                                815    825   820   830
                 390   350                                                                                                                                  998   1005
        343                  330   330                                   751                                                                         995
                                                                                                                                              980
                                                                                                                                        964

        2016 2018      2020 2022   2024                                  2016   2018 2020    2022 2024                                  2016 2018    2020 2022    2024

                                            Rest of the World                                                  Other Asia

                                                                                                         446
                                                                                                               430   435         429
                                                             77    75                                                      412
                                           61    65    66

                                          2016   2018 2020   2022 2024                                   2016 2018   2020 2022   2024

➢ Globally, we expect further increases in demand for mechanical engineering products
➢ Sales in China will show a further growth within the next years. Chinese sales will be higher than the combined sales of
  the rest of Asia and North America
➢ In Europe, Germany and Italy will gain market share compared to other western European states
➢ In the mechanical engineering industry there is a movement towards lightweight construction (robotics, machine tools,
  etc.)

Sources: VDMA, IKB estimates
World Market for Electric Products and Electronics
                                                                                                                                                            11
  In billion €

                              America                                             Europe                                              China

                                      995 1064                                                                                                            2204 2469
          825 833 858 901 928 956 975                                                             834                           1867 1978 2038 2119
                                                                  672 685 699 713 727 749 764 787           1538 1646 1761

          2015        2017         2019        2021        2025   2015    2017      2019      2021   2025   2015         2017         2019         2021          2025

                       Rest of the World                                         Other Asia                        Oceania /South Africa / Egypt

                                                                                          1007 1047 1108
                                                                  840 851 861 886 912 968

                                    77    80    81    84    92                                               65     66    67     68    70     72   75     77     83
           68    71    75     75

          2015        2017         2019        2021        2025   2015    2017      2019      2021   2025   2015         2017         2019         2021          2025

➢ The global market for electric products and electronics was estimated with around €4,500 billions in 2016. By 2025 we see a
  production volume of above 5,600 bn. Euros
➢ During the next years a stable growth is expected. The growth rate in China will fluctuate between 5 and 7 per cent after
  double-digit rates in previous years
➢ We expect an increasing production in all major sub-segments of the market

Sources: ZVEI, IKB forecast
Construction Sector: Further Growth Prospects
                                                                                                                                                       12

           Urbanization and Development of Megacities1)                                 Recovery of the European Construction Sector
                                                                               20%
                                                                               15%
                                                                               10%
                                                                                5%
                                                                                0%
                                                                                -5%
                                                                               -10%
                                                                                        2015       2016      2017        2018      2019e    2020e     2021e
                                                                                       Germany                      France                   Italy
                                 Megacity in 2014   Megacity in 2030                   Spain                        Western Europe           Eastern Europe

                  Forecast Global Construction Sector                                                            In Detail
                                                                               ➢ The global construction industry will be on a stable growth path
                            5%                                                   during the next five years. We do not only expect a strong urbanization
                                       22%                                       process in the emerging markets. By 2030 several new „megacities“
                                                                                 will have been developed
                             Total:                     Americas
                              10.2                      Europe                 ➢ Between 2017 and 2021 the global construction output will grow at an
                            trillion                                             average of 2.8 % a year to more than 10 trillion US-$
             47%                                        Asia / Pacific
                             US-$                                              ➢ China, the US, Japan, India and Germany will account for more than
                                                        Middle East / Africa     half of the global construction output in 2021
                                       26%
                                                                               ➢ Therefore we forecast a rising demand for construction-related
                                                                                 casting products in the major markets. Mainly iron cast will profit from
                                                                                 this development
1) Megacity: > 10 mill. inhabitants
Sources: Euroconstruct, UNEP, CIC
Challenges in major Customer Industries
                                                                                                           13

                  Challenge Automotive Industry                              Challenge Digitalization

➢ For 2019 we forecast a small dip in the global        ➢ The digital transformation will strengthen
  automotive production. This is the result e.g. of:      existing supply chains. Customers with digital
  the impact of trade conflicts                           requirements for casting products will have a
  the secondary effects of the diesel crisis problems     look on geographical proximity
  with new testing methods in Europe                    ➢ The development in lightweight construction
➢ The Brexit has a negative impact in Europe              in the automotive industry could only be
➢ In the middle and long run the trend towards            realized together with foundries
  E-Mobility has a negative impact on foundries.
                                                        ➢ Medium-sized foundries will be successful if
  The light-weight construction reduces the part
                                                          they are able to strengthen their own USP
  weights and the change in the power train has
                                                          between niche players and commodity
  impacts on the supply chain
                                                          producers

                   Challenge Emerging Markets                             Challenge Climate Protection
➢ We forecast new capacities for foundries mainly       ➢ We expect rising energy costs in Europe.
  in the emerging markets, e.g. India, Brazil and         Therefore, high needs for investments
  Mexico                                                  into energy efficiency are necessary
➢ We see a rising importance of Eastern Europe.           in Europe
  Especially countries with new or extended             ➢ The regulation on emission reductions
  automotive production, e.g. Slovakia, Poland or         will increase during the next years
  Romania                                               ➢ As a result a loss of competitiveness
➢ In the long run countries like Indonesia or             mainly for medium-sized foundries is
  Vietnam have an increased potential for                 possible
  casting production
Agenda
                                                                14

    1    Macroeconomic Environment                                   3

    2    Forecast 2025 for the Global Foundry Industry               14

    3    Future Challenges for the worldwide Casting Industry        22

    4    Appendix                                                    25
Cast Iron: Growth only in China?
                                                                                                                                                                                                  15

                      Cast Iron Production from 2000 to 2017                                                                                                       In Detail
in mill. tons                                                                                                                         ➢ The global iron cast production rose from 54.5 million metric
                                                                                                                                        tons in the year 2000 to over 85 million tons in 2017
 100
                                                                                                                                      ➢ In 2000, China produced around 9.9 million tons of iron cast
  90                                                                                                                                    products in total. Until 2017, the country expanded its foundry
                                                                                                                                        production output to around 41 million tons
  80                                                                                                                                  ➢ During the same time, the cast iron production in the rest of the
                                                                                                                                        world stabilized
  70
                                                                                                                                      ➢ While some of the leading producers in the western world
  60                                                                                                                                    (e.g. USA, Japan, France, Italy) as well as Russia lost market
                                                                                                                                        shares, the production in some emerging markets (e.g. India,
  50                                                                                                                                    Brazil, Turkey) expanded
                                                                                                                                      ➢ Between 2000 and 2017 the output of grey iron cast rose by
  40
                                                                                                                                        around 40 % while the production volume of ductile iron cast
                                                                                                                                        doubled worldwide to around 27 million tons. The steel cast
  30
                                                                                                                                        production grew by 65%
  20                                                                                                                                  ➢ China showed a similar trend: While grey cast nearly
                                                                                                                                        quadrupled, the output of ductile iron cast sextupled and the
  10                                                                                                                                    steel cast output became three times higher

    0
                                                                                                                               2017
        2000
               2001
                      2002
                             2003
                                    2004
                                           2005
                                                  2006
                                                         2007
                                                                2008
                                                                       2009
                                                                              2010
                                                                                     2011
                                                                                            2012
                                                                                                   2013
                                                                                                          2014
                                                                                                                 2015
                                                                                                                        2016

                                       Rest of the World                        China

Sources: CAEF, Modern Census, IKB Research
Aluminum Cast Production on a stable Growth Path
                                                                                                                                                                                                   16

             Cast Aluminium Production from 2000 to 2017                                                                                                          In Detail
in mill. tons                                                                                                                       ➢ The global aluminum foundry production rose from
                                                                                                                                      8 million metric tons in the year 2000 to 19 million tons in
 20
                                                                                                                                      2017
 18                                                                                                                                 ➢ China’s aluminum cast output equaled only 0.8 million
                                                                                                                                      tons in 2000
 16                                                                                                                                 ➢ But in the year 2017 the Chinese aluminum foundries
                                                                                                                                      manufactured a new all-time record with 7.3 million tons of
 14                                                                                                                                   casting products: Within 17 years their aluminum foundry
                                                                                                                                      production increased by a factor of over nine
 12
                                                                                                                                    ➢ In the rest of the world the aluminum cast output rose from
 10                                                                                                                                   7.2 million tons to over 12 million tons in 2017
                                                                                                                                    ➢ While the global growth of the iron cast production
  8                                                                                                                                   mainly resulted from an increase of the Chinese
                                                                                                                                      production with a stable output level in the rest of the world,
  6                                                                                                                                   the aluminum cast production rose in all major regions
                                                                                                                                      of the world
  4
                                                                                                                                    ➢ Between 2000 and the year 2017 the production level
                                                                                                                                      stabilized in the USA, France and Russia. During the
  2
                                                                                                                                      same period Japan and Italy realized a slight growth of
  0
                                                                                                                                      around 20 per cent, while the German output grew by
                                                                                                                                      around 75 per cent
                    2002

                                                                                                                             2017
      2000
             2001

                           2003
                                  2004
                                         2005
                                                2006
                                                       2007
                                                              2008
                                                                     2009
                                                                            2010
                                                                                   2011
                                                                                          2012
                                                                                                 2013
                                                                                                        2014
                                                                                                               2015
                                                                                                                      2016

                                                                                                                                    ➢ As a result of new plants for aluminum wheel rims the
                                         Rest of the World                         China                                              Turkish foundry production expanded tenfold, while the
                                                                                                                                      Indian output sextupled

Sources: CAEF, Modern Census, IKB Research
Global Production of Iron and Ductile Iron Cast stabilizes1)
                                                                                                                            17
in mill. tons

                                                                                                                    China
                                                                     Western Europe   Eastern Europe
                    NAFTA

       2025
       2022                                                                                            Other Asia
       2020                             Rest of world
       2018
       2016
       2014

  Production in Western Europe will move sideways by 2025 with a slight decline from 2020 on
  Despite the partly re-industrialization of the US economy and temporary lower energy costs the foundry production in the
      NAFTA declined between 2014 and 2016. Development will level off from 2022 onwards
     China will dominate the world market but India will catch up. Japan and Korea will lose cast production to these countries

Sources: World Census, CAEF, IKB forecast; 1) Including Steel Cast
Iron Cast recovers in Eastern Europe1)
                                                                                                                            18
in mill. tons

                             Others
                                                                     Germany            Eastern Europe

                                                     France

                                                                                                                           2025
                                                                                                                           2022
                                                                               Italy
                                                                                                                           2020
                             Spain
                                                                                                                           2018
                                                                                                                           2016
                                                                                                                           2014

  In Eastern Europe a large part of growth will take place in Turkey but we also expect a recovery after sharp declines
      in Russia and Ukraine
     Western European production shows a tendency towards declining volumes. Spain could show stronger growth
     We see chances for Germany in case of a stronger recovery of mechanical engineering activities

Sources: World Census, CAEF, IKB forecast; 1) Including Steel Cast
Global Aluminum Cast Production will strengthen
                                                                                                                           19
in mill. tons

                                                                                                             China
                                                       Western Europe      Eastern Europe
                   NAFTA

    2025
                                                                                            Other Asia
    2022
                                       Rest of world
    2020
    2018
    2016
    2014

  The trend towards electrical vehicles and light-weight production induces a rising aluminum foundry production
  In addition to the higher production volume in Western Europe some of the leading foundry groups invest in Eastern
      Europe, too. We see a recovery in Russia and Ukraine and a catching-up process in Turkey
     The majority of growth in the NAFTA region will be fueled by investments of foreign OEMs and global foundry groups
     Korea and Japan will lose market shares to China
Sources: World Census, CAEF, IKB forecast
European Aluminum Cast Production shows stronger Growth
                                                                                                                         20
in mill. tons

                           Others
                                                                                       Eastern Europe
                                                          Germany

                                            France

                                                                              Italy                                    2025
                                                                                                                       2022
                            Spain                                                                                      2020
                                                                                                                       2018
                                                                                                                       2016
                                                                                                                       2014

  For Eastern Europe we see a steady recovery within the next years (e.g. Russia, Ukraine)
  In the medium-term an expansion of aluminum rim production in Turkey as well as increased capacities in Slovakia, the
      Czech Republic and other countries will stimulate European production
     After a strong growth in the past years German aluminum foundries are expected to produce 1.2 million tons from 2018 on
Sources: World Census, CAEF, IKB forecast
Global Copper Casting Production with slight Increase
                                                                                                                                                                                                                                                                       21
in thousand tons

                                                                                                     Western Europe                                                                                                                        China
                                                                                                                                                  Eastern Europe
                                                                                                                                                                                                                                       810 810 810
                                                                                             200 214 226 227 227 227                      159 197 203 193 183 183                                                          739 800 800
                          NAFTA
                                                                                              2014     2016   2018   2020   2022   2025
                                                                                                                                           2014     2016   2018   2020   2022           2025

          480 437 460 489 489 489

                                                                                                                                                                                                                            2014    2016   2018   2020   2022   2025

            2014   2016    2018   2020   2022     2025

    2025
                                                                                                                                                                                               Other Asia
    2022
                                                         Rest of world
    2020                                                                                                                                                                        181 175 180 180 180 182
                                                31 29 45 47 49 49
    2018                                        2014      2016   2018   2020   2022   2025
                                                                                                                                                                                 2014          2016   2018   2020   2022     2025

    2016
    2014

  The global copper die casting production increased by 11.7 % from 2010 to 2017
  By 2025 we expect global copper die casting production to rise to about 1.95 million tons
  While copper die casting production will slightly recover in Western Europe and Northern America, more than half of
      the global copper die casting production will take place in Asia
Sources: World Census, CAEF, IKB forecast
Agenda
                                                                22

    1    Macroeconomic Environment                                   3

    2    Forecast 2025 for the Global Foundry Industry               14

    3    Future Challenges for the worldwide Casting Industry        22

    4    Appendix                                                    25
Consequences for the global Foundry Demand
                                                                                                  23

    ➢ The trend towards e-mobility has tremendous consequences for the supply chain.
      Mainly the suppliers of powertrain components are negatively affected
1   ➢ If we assume the weight of an average engine block of around 50 kg and expect a
      shift of 10 million light vehicles from combustion engine to e-battery-vehicles …
    ➢ … this will result in a reduction of around 500,000 tons of iron cast

    ➢ Hybrid vehicles are a better solution for foundries under the aspect of the necessary
      volume of casting production:
2   ➢ They do not only need a battery but also an engine block
    ➢ The average engine block for an e-vehicle is smaller in relation to a traditional
      combustion engine, but the battery leads to a higher total weight of the car

    ➢ A higher usage of copper (autonomous driving) and higher battery weight will
      intensify the trend towards light-weight production:
3   ➢ This will result either in a reduction of the specific weight of a cast part (as a result
      of a change in the geometry of the cast product) …
    ➢ … or in a substitution of iron cast by aluminum cast
Strategic challenges of foundries
                                                                                                                                  24

                             ➢ Emerging markets will account for the majority of demand growth
Globalization                ➢ The automotive industry in particular demands local production outside of Europe
                             ➢ Increased requirement of a global presence close to the customer will raise logistics costs

                             ➢ Preservation of technology leadership is of high importance, especially for the foundry industry
Technological
                             ➢ Pressure on weight reduction will continue (e.g. in automotive and machine construction)
challenges
                             ➢ The E-Mobility discussion will significantly change the supply chain, especially in powertrain

Retaining                    ➢ Many qualified employees will retire in the upcoming years (primarily in Western Europe)
qualified                    ➢ Competition for qualified personnel intensifies due to changing demographics
personnel                    ➢ Need for new employee retention programs (e.g. balance between work and family) and training

                             ➢ Trend towards delivery of completely processed castings will demand corresponding investment
Investment
                             ➢ Increased complexity of metal alloy will also demand investment
requirements
                             ➢ High costs of energy will have to be managed

                             ➢ International competition in vehicle construction will go up
Margin
                             ➢ This limits the possibility of cost transfer to the end customer
pressure
                             ➢ OEMs could pass on cost pressure to suppliers

                             ➢ Continuation of industry consolidation is expected
Industry
                             ➢ Main reasons are globalization pressure and increased investment requirements
consolidation
                             ➢ Many family businesses face problems in terms of company succession in our point of view

 The global foundry industry is facing increased investment requirements. In combination with technological changes this
   should intensify industry consolidation
Agenda
                                                                25

    1    Macroeconomic Environment                                   3

    2    Forecast 2025 for the Global Foundry Industry               14

    3    Future Challenges for the worldwide Casting Industry        22

    4    Appendix                                                    25
Iron Cast in Asia: India with high Growth Potential1)
                                                                                                                            26
in mill. tons

                                                                                                              South Korea

                                Other Asia

                                                                  China

                                                                                                                Japan

    2025
    2022                                               India
    2020
                                                                           Republic of China (Taiwan)
    2018
    2016
    2014

  The Indian foundry industry will have a high growth potential: The infrastructure has an enormous investment backlog in
      relation to China and an improving car production will induce a rising demand for foundry products
  The loses of car manufacturing in South Korea and Japan to Chinese car production plants result in a declining iron
      cast output, which cannot be compensated by other customer segments
     From 2020 on the increasing importance of electrical vehicles will reduce the casting output in China

Sources: World Census, CAEF, IKB forecast; including steel cast
Asian Aluminum Cast Production on further Growth Path
                                                                                                                           27
in mill. tons

                                                                                                          South Korea

                              Other Asia

                                                             China

                                                                                                             Japan

    2025
    2022                                    India
    2020
                                                                          Republic of China (Taiwan)
    2018
    2016
    2014

  The Chinese aluminum cast production shows a continuously strong growth. The main driver is the demand from the car
      manufacturing industry. In addition we see a substitution of iron cast by aluminum foundry parts in the mechanical
      engineering industry
     India will catch up, but will start from a relatively low level
     The production level in Japan and South Korea will remain relatively constant
Sources: World Census, CAEF, IKB forecast
Your Contact
                                                       28

       Dr. Heinz-Jürgen Büchner
       Managing Director, Industrials & Automotive
       IKB Deutsche Industriebank AG
       Eschersheimer Landstraße 121
       60322 Frankfurt am Main

       Phone:          +49 69 79599-9602
       Mobile:         +49 171 2249517
       E-Mail:         Heinz-Juergen.Buechner@ikb.de
Disclaimer
                                                                                                                                                                                                                       29

Diese Werbemitteilung und die darin enthaltenen Informationen begründen weder einen Vertrag noch irgendeine Verpflichtung und sind von der IKB Deutsche Industriebank AG ausschließlich für (potenzielle) professionelle
Kunden und Geeignete Gegenparteien mit Sitz und Aufenthaltsort in Deutschland bestimmt, die auf Grund ihres Berufes/Aufgabenstellung mit Finanzinstrumenten vertraut sind und über ausreichende Erfahrungen,
Kenntnisse und Sachverstand verfügen, um Entscheidungen über ihre Geldanlage und die Inanspruchnahme von Wertpapier(neben)dienstleistungen zu treffen und die damit verbundenen Risiken angemessen beurteilen zu
können. Außerhalb Deutschlands ist eine Verbreitung untersagt und kann gesetzlich eingeschränkt oder verboten sein.
Die Inhalte dieser Werbemitteilung stellen weder eine Anlageberatung noch eine individuelle Anlageempfehlung oder eine Einladung zur Zeichnung oder ein Angebot zum Kauf oder Verkauf von Wertpapieren oder sonstigen
Finanzinstrumenten dar. Die Werbemitteilung wurde nicht mit der Absicht erarbeitet, einen rechtlichen, steuerlichen oder bilanziellen Rat zu geben. Es wird darauf hingewiesen, dass die steuerliche Behandlung einer
Transaktion von den persönlichen Verhältnissen des jeweiligen Kunden abhängt und künftigen Änderungen unterworfen sein kann. Stellungnahmen und Prognosen stellen unverbindliche Werturteile zum Zeitpunkt der
Erstellung der Werbemitteilung dar. Die Angaben beziehen sich ausschließlich auf den Zeitpunkt der Erstellung der Werbemitteilung. Eine Änderung der Meinung des Verfassers ist daher jederzeit möglich, ohne dass dies
notwendigerweise publiziert wird. Die in der Werbemitteilung zum Ausdruck gebrachten Meinungen spiegeln nicht zwangsläufig die Meinung der IKB wider. Prognosen zur zukünftigen Entwicklung geben Annahmen wieder,
die sich in Zukunft als nicht richtig erweisen können; für Schäden, die durch die Verwendung der Werbemitteilung oder von Teilen davon entstehen, wird nicht gehaftet.
Die jeweiligen individuellen Verhältnisse eines Kunden oder Investors, besonders seine finanzielle und wirtschaftliche Situation, werden in diesen Informationen nicht berücksichtigt. In der Werbemitteilung genannte
Konditionen sind als unverbindliche Indikationen zu verstehen. Für einen eventuellen Abschluss gelten die dann aktuellen Konditionen, die vom Marktgeschehen zum Abschlusszeitpunkt abhängen. Eine Anlage in etwa
erwähnte Finanzinstrumente beinhaltet gewisse spezifische Risiken, darunter Kapital , Zins-, Währungs-, Kredit-, politische, Liquiditäts-, Zeitwert-, Produkt-, Branchen- und Marktrisiken und ist nicht für alle Anleger geeignet.
Ein möglicher Investor muss feststellen, ob der Erwerb etwa erwähnter Finanzinstrumente sich mit seinen finanziellen Bedürfnissen, Zielen und Bedingungen deckt, mit allen darauf anwendbaren Vorgaben und
Einschränkungen übereinstimmt und es sich um eine angemessene und geeignete Anlage handelt, ungeachtet der benannten Risiken, die mit einer Anlage in das etwa erwähnte Finanzinstrument einhergehen. Mögliche
Investoren sollten die Informationen, die in dem möglicherweise veröffentlichten Wertpapierprospekt enthalten sind, einschließlich und insbesondere des Abschnitts „Risikofaktoren“ sorgfältig prüfen und eine
Investitionsentscheidung gegebenenfalls erst nach einem ausführlichen Beratungsgespräch durch einen Anlageberater treffen.
Die vorliegende Werbemitteilung ist urheberrechtlich geschützt. Das Bearbeiten oder Umarbeiten der Werbemitteilung ist untersagt. Eine Verwendung der Werbemitteilung für gewerbliche Zwecke, auch auszugsweise, ist
nur mit vorheriger schriftlicher Zustimmung der IKB Deutsche Industriebank AG zulässig.

Ansprechpartner in der IKB Deutsche Industriebank AG
Wilhelm-Bötzkes-Straße 1
40474 Düsseldorf
Telefon +49 211 8221-0

Dr. Heinz-Jürgen Büchner
Managing Director Industrials, Automotive & Services
Tel.: +49 69 79599-9602

© 2019
Herausgeber: IKB Deutsche Industriebank AG, Wilhelm-Bötzkes-Straße 1, 40474 Düsseldorf
Vorsitzender des Vorstands: Dr. Michael H. Wiedmann
Vorstand: Claus Momburg, Dr. Jörg Oliveri del Castillo-Schulz, Dirk Volz
Vorsitzender des Aufsichtsrats: Dr. Karl-Gerhard Eick
Aufsichtsbehörde: Bundesanstalt für Finanzdienstleistungsaufsicht, Graurheindorfer Straße 108, 53117 Bonn und Marie-Curie-Straße 24-28, 60439 Frankfurt am Main, www.bafin.de
Sitz der Gesellschaft: Düsseldorf
Handelsregister des Amtsgerichts Düsseldorf B Nr. 1130
Umsatzsteueridentifikationsnummer: DE 121298843
You can also read