H1 2021 RESULTS AND OUTLOOK - Saint-Gobain IO Project

Page created by Jessie Vazquez
 
CONTINUE READING
H1 2021 RESULTS AND OUTLOOK - Saint-Gobain IO Project
H1 2021 RESULTS
AND OUTLOOK
H1 2021 RESULTS AND OUTLOOK - Saint-Gobain IO Project
01   H1 2021 HIGHLIGHTS

    02   H1 2021 RESULTS

    03   STRATEGY

    04   OUTLOOK

2
H1 2021 RESULTS AND OUTLOOK - Saint-Gobain IO Project
+11.9% in organic growth versus H1 2019 and +27.4% versus H1 2020:

         +7.6% in volumes on H1 2019

         +4.3% in prices on H1 2019 (+3.9% on H1 2020)

     +53% in like-for-like operating income versus H1 2019 to €2,376m

     10.7% operating margin in H1 2021 versus 7.6% in H1 2019

     +34% EBITDA on H1 2019 to €3,248m and EBITDA margin at 14.7%

     +60% in recurring net income on H1 2019 to €1,506m

     +47% in free cash flow on H1 2020 to €2,461m, with a conversion ratio of 84%

              Exceptional
              NOUVEAUX    mobilization
                       RECORDS  DE TOUSof allINDICATEURS
                                        LES   Saint-Gobain
                                                         DE teams
                                                            PERFORMANCE

3/                                            H1 2021 RESULTS AND OUTLOOK
H1 2021 RESULTS AND OUTLOOK - Saint-Gobain IO Project
Enhanced growth and profitability profile:
     -    Divestment of under-performing assets: €5.3bn in sales, ~2% in
          EBITDA margin                                                              “Transform & Grow”
                                                                                    objectives significantly
     -    Acquisition of fast-growing and profitable assets: ~€1.5bn in sales,
                                                                                      exceeded, with the
          ~20% in EBITDA margin
                                                                                   operating margin at 10.4%
     Agile, collaborative and efficient organization:                               over the last 12 months
                                                                                    (versus a target of >100 bps
     -    Dedicated teams empowered at country level                               compared to the 7.7% of 2018)

     -    Numerous synergies benefiting customers via integrated,
          differentiated solutions

                      ENHANCED GROWTH AND PROFITABILITY PROFILE
                         DRIVEN BY DECARBONIZATION SOLUTIONS

4/                                                   H1 2021 RESULTS AND OUTLOOK
H1 2021 RESULTS AND OUTLOOK - Saint-Gobain IO Project
01   H1 2021 HIGHLIGHTS

    02   H1 2021 RESULTS
         A. GROUP
         B. SEGMENTS

    03   STRATEGY

    04   OUTLOOK

5
H1 2021 RESULTS AND OUTLOOK - Saint-Gobain IO Project
2021/2020                                  2021/2019
                                       +27.4%                                     +11.9%
                                       like-for-like                              like-for-like

                                                        +23.5%      +24.6%

                                                                                             Organic growth of 11.9% versus H1 2019

                                                                                             Exchange rates: depreciation of the US dollar,
                -2.6%                        +3.9%                                           the Brazilian real and other emerging country
                           -0.2%
                                                                                             currencies

  17,764                                                            22,131
   (€m)                                                              (€m)                    Structure: continued optimization of Group profile
                                                                                             (divestments and acquisitions)
H1-2020 sales   Exchange   Structure            Price   Volumes   H1-2021 sales
                  rates

6/                                                                H1 2021 RESULTS AND OUTLOOK
H1 2021 RESULTS AND OUTLOOK - Saint-Gobain IO Project
Quarterly organic growth vs 2019

                                                          +14.7%

                                              +9.0%
                                    +6.4%                                          +9.0% in Q1, o/w volumes +5.8%
                       +3.2%

                                                                                   +14.7% in Q2, o/w volumes +9.4% with a
  -4.9%                                                                            positive +3% calendar impact

            -19.2%

Q1-2020/   Q2-2020/   Q3-2020/     Q4-2020/   Q1-2021/   Q2-2021/
Q1-2019    Q2-2019    Q3-2019      Q4-2019    Q1-2019    Q2-2019

7/                                                       H1 2021 RESULTS AND OUTLOOK
H1 2021 RESULTS AND OUTLOOK - Saint-Gobain IO Project
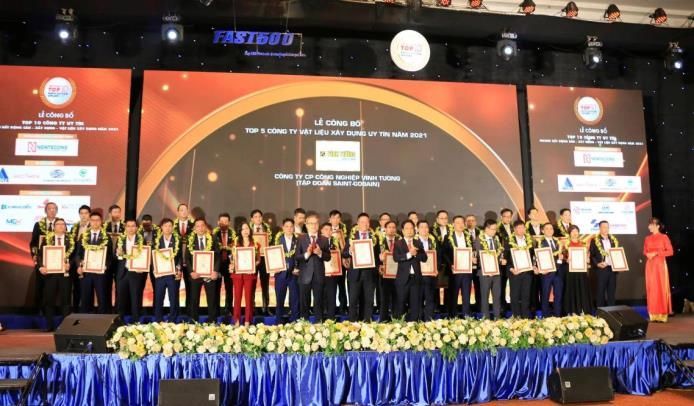
Group total price increase

excluding Distribution (Europe):                                                   Inflation in raw material and energy costs
+4.3% in H1 2021, of which +5.5% in Q2 2021                                        of >€1bn expected for the year, versus
                                                                                   previous estimates of between €300m-

                                                              +5.1%
                                                                                   €400m in February and €600m-€700m in
                                                                                   April 2021

                                                 +2.6%
                                      +1.8%
                                                                                   Positive price-cost spread expected for
     +0.6%       +0.2%     +0.9%
                                                                                   the full year
     Q1-2020/   Q2-2020/   Q3-2020/   Q4-2020/   Q1-2021/      Q2-2021/
     Q1-2019    Q2-2019    Q3-2019    Q4-2019    Q1-2020       Q2-2020

8/                                                   H1 2021 RESULTS AND OUTLOOK
H1 2021 RESULTS AND OUTLOOK - Saint-Gobain IO Project
+45%
                         actual vs
                         2019           Strong leverage effect from sales volumes

                          2,376         Positive price-cost spread ~ +€125m versus H1 2020

                                        Additional savings of €100m in H1 2021 to lower the
     1,638                              break-even point of certain activities impacted by the
                                        coronavirus, in addition to €50m in H2 2020

                827
                                        Reinforcement of the operational excellence program

                                        Low level of overheads thanks to discretionary savings
      7.6%      4.7%     10.7%

                                        Positive structural impact of “Transform & Grow”
     H1-2019   H1-2020   H1-2021

9/                                   H1 2021 RESULTS AND OUTLOOK
H1 2021 RESULTS AND OUTLOOK - Saint-Gobain IO Project
Change in operating margin

                   2018            7.7%
                                             Divestment of under-performing assets, acquisition of fast-growing and
       Portfolio                   +60 bps
                                             profitable assets

       Cost structure              +60 bps   T&G cost savings

       Volumes & mix               +60 bps   Volume growth, High Performance Solutions mix effect, currency effect

       Normalized last 12 months
          (at end-June 2021)
                                   9.5%
                                             Price/cost spread, discretionary savings, post-coronavirus volume
       Exceptional                 +90 bps
                                             catch-up effects
        Published last 12 months
           (at end-June 2021)
                                   10.4%     Operating margin at 10.0% in H2 2020 and 10.7% in H1 2021

10 /                                                H1 2021 RESULTS AND OUTLOOK
H1-2021/   H1-2021/
                                                           H1-2019             H1-2020       H1-2021
       €m                                                                                              H1-2020    H1-2019

   Operating income                                          1,638                 827        2,376    +187%      +45.1%
   Non-operating costs                                       (168)                (142)        (82)
   Disposal gains (losses) and impacts resulting from
                                                               (16)                   (22)    (53)
   changes in Group structure
   Asset write-downs and other                                (201)               (712)        (97)
   Business income                                            1,253                (49)       2,144      n.s.     +71.1%

   Operating income                                           1,638                827        2,376     +187%     +45.1%
   Operating depreciation and amortization                     947                 950         954
   Non-operating costs                                        (168)               (142)        (82)
   EBITDA                                                     2,417               1,635       3,248     +98.7%     +34.4%
   EBITDA margin (as a % of sales)                            11.2%               9.2%        14.7%    +550 bps   +350 bps

11 /                                                    H1 2021 RESULTS AND OUTLOOK
H1-2021/   H1-2021/
                                                              H1-2019          H1-2020        H1-2021
       €m                                                                                               H1-2020    H1-2019

       Business income                                         1,253               (49)        2,144      n.s.     +71.1%
       Net financial expense                                   (250)              (234)        (213)
                    Average cost of gross debt (at June 30)    2.2%                2.0%        2.0%
       Dividends received from investments                      28                  34           0

       Income tax                                              (318)              (183)        (593)

       Net attributable income                                 689                (434)        1,298
       Recurring net income                                    944                 272         1,506      n.s.     +59.5%

       Half-year recurring EPS (€)                             1.74               0.51         2.85       n.s.     +63.8%

12 /                                                            H1 2021 RESULTS AND OUTLOOK
2,915
                                     (213)
                                                                                                                           2,461         +47%
                                                            (593)
                                                                                                          +662
                                                                                   (310)

                                                          FCF conversion: 84%

             H1-2021             Finance costs               Tax            Capital expenditure       Change in WCR     Free cash flow
             EBITDA*                                                          excl. additional        over a 12-month
                                                                                capacity**                 period

H1-2020 : €1,299m                                           FCF conversion : 129%                                         €1,678m
         * EBITDA less depreciation of right-of-use assets: €3,248m - €333m = €2,915m (versus €1,299m in H1-2020)
        ** Capital expenditure = €431m, including €121m in additional capacity investments linked to organic growth
 13 /                                                                   H1 2021 RESULTS AND OUTLOOK
19.3
                                                                                       18.2
                                                                 19.5
                                          18.4

       Net debt
       Shareholders’ equity                                                    9.8
                                                                                                     7.6
                                   6.7
 Rating: BBB/Baa2                                        4.5

                                    06-2020                06-2021              06-2020               06-2021

                                          before IFRS 16**                                 after IFRS 16

Net debt/shareholders’ equity            36%                   23%               54%                       39%

Net debt/EBITDA*                         2.0                   0.9                   2.4                   1.3

 * EBITDA over a 12-month period
** before IFRS 16: estimates
14 /                                             H1 2021 RESULTS AND OUTLOOK
01   H1 2021 HIGHLIGHTS

     02   H1 2021 RESULTS
          A. GROUP
          B. SEGMENTS

     03   STRATEGY

     04   OUTLOOK

15
2021/2020                                              2021/2019
                                 +23.6%                                                 +2.0%
                                 like-for-like                                          like-for-like

                                                            +23.9%        +18.6%
                                                                                                           502                 496

                              +0.1%
                                                                                                                     231
                   -5.1%                         -0.3%

       3,102                                                              3,679                           13.0%      7.4%     13.5%

  H1-2020 sales    Exchange    Structure          Price     Volumes     H1-2021 sales                     H1-2019   H1-2020   H1-2021
                     rates

                                                 Mobility         Other ind.
         Change in
       sales on a like-   2021/2020              +31.2%               +19.3%
        for-like basis
                          2021/2019               -3.3%               +5.5%

16 /                                                                        H1 2021 RESULTS AND OUTLOOK
2021/2020                                          2021/2019
                                    +19.9%                                             +9.9%
                                    like-for-like                                      like-for-like

                                                             +16.2%      +21.8%
                                                                                                                              585

                                                                                                          460
                                                    +3.7%
                    +1.5%      +0.4%

                                                                                                                    256

       6,090                                                             7,418                           6.0%       4.2%      7.9%

  H1-2020 sales     Exchange      Structure          Price   Volumes   H1-2021 sales                     H1-2019   H1-2020   H1-2021
                      rates

                                              Nordics         UK           Germany
   Change in
 sales on a like-     2021/2020               +7.8%          +46.7%         +14.3%
  for-like basis
                      2021/2019               +11.8%         +6.2%           +6.8%

17 /                                                                       H1 2021 RESULTS AND OUTLOOK
2021/2020                                            2021/2019
                                 +34.7%                                               +13.1%
                                 like-for-like                                        like-for-like

                                                          +31.8%        +31.6%
                                                                                                                             680

                                                 +2.9%                                                   350

                   -0.7%
                              -2.4%
                                                                                                                    99
       5,668                                                            7,457                           5.0%       1.7%      9.1%

  H1-2020 sales    Exchange    Structure         Price    Volumes     H1-2021 sales                     H1-2019   H1-2020   H1-2021
                     rates

                                                 France        Spain-Italy
         Change in
       sales on a like-   2021/2020              +37.2%             +30.3%
        for-like basis
                          2021/2019              +14.4%             +5.5%

18 /                                                                      H1 2021 RESULTS AND OUTLOOK
2021/2020                                               2021/2019
                                 +32.0%                                                  +25.2%
                                 like-for-like                                           like-for-like

                                                             +21.4%        +22.1%                                               555

                                                 +10.6%

                               +2.5%                                                                        250
                                                                                                                      190

                   -12.4%
       2,670                                                               3,260                           9.0%       7.1%     17.0%

  H1-2020 sales     Exchange   Structure          Price      Volumes     H1-2021 sales                     H1-2019   H1-2020   H1-2021
                      rates

                                             North America       Latin America
         Change in
       sales on a like-   2021/2020              +26.1%                +50.1%
        for-like basis
                          2021/2019              +19.9%                +37.1%

19 /                                                                         H1 2021 RESULTS AND OUTLOOK
2021/2020                                         2021/2019
                               +40.3%                                            +16.2%
                               like-for-like                                     like-for-like
                                                       +36.6%      +33.6%
                                                                                                                         98
                                                                                                     85

                                               +3.7%
                             +0.1%
                                                                                                               46

                  -6.8%
       655                                                           875                           9.5%       7.0%     11.2%

  H1-2020 sales   Exchange   Structure         Price   Volumes   H1-2021 sales                     H1-2019   H1-2020   H1-2021
                    rates

20 /                                                                 H1 2021 RESULTS AND OUTLOOK
01   H1 2021 HIGHLIGHTS

     02   H1 2021 RESULTS

     03   STRATEGY

     04   OUTLOOK

21
Acceleration on growth markets                                                                                   Unmatched solutions offering

       1. Sustainable solutions contribute to energy and environmental transition or to final users’ and installers’ well-being and comfort
22 /
                                                                                             H1 2021 RESULTS AND OUTLOOK
Agile organization                                                Customer satisfaction                                                   Operational excellence

        Constant focus on price/cost                                                                                                                            Increase in
                                                                                              Customer NPS2 in
        spread                                                                                                                                                  productivity in
                                                                                 +3pts        Distribution
                                                                                                                                                                Distribution3
        Supply chain optimization for
        raw materials availability                                                                                                                              Plants opened in the
                                                                             Award-winning customer                                                             last 12 months
                         Post-coronavirus                                    service in Vietnam in 2021
           savings       adaptation measures1
                                                                                                                                                                Increase in plant
                                                                                                                                                                productivity

       1. €150m savings over the last 12 months until end of June 2021, as part of post-coronavirus adaptation measures to lower the break-even point of certain businesses
       2. H1 2021 Distribution France customer NPS: Net Promoter Score
23 /   3. European distribution excluding German divestment H1 2021 vs. H1 2019         H1 2021 RESULTS AND OUTLOOK
Improved growth and profitability profile                                               Innovative & digital solutions

                                                                                                                    sales

                                                                                             Webercol Flex Eco

                                                                                           Glasroc X plasterboard

                                                              Netherlands

                                                              Germany

       1. Deals signed or closed in H1 2021
24 /   2. H1 2021 vs. H1 2019 in France
                                                                        H1 2021 RESULTS AND OUTLOOK
       3. Dahl Nordics (Norway, Sweden, Denmark) in H1 2021
roadshow to raise
                                                             eco-organism for            awareness           work-study
                                                                                                                              per employee
                Internal                                     circularity in the         on biosourced     positions opened
                                           gypsum plant                                                                        from our US
              Carbon Fund                                     building sector              materials          for young
                                             worldwide                                                                           employee
                                                                 in France                                  professionals       relief fund1
                                                                                                               in France

            global indicator           against COVID-19                                                                       completion of
              to measure              offered to employees   women members                                of Principles of
                                                                                           employee                          anti-harassment
             occupational                in Saint-Gobain     of the Executive                              Conduct and
                                                                Committee                 shareholders       Action Day         campaign
                 health                     premises3
                                                                                                                                 in the US

     1. For employees suffering hardship
     2. HICE: Health Indicator for Occupational Exposure
25 /
     3. Wherever permitted by health authorities                   H1 2021 RESULTS AND OUTLOOK
SAINT-GOBAIN IS AT THE HEART OF GLOBAL CHALLENGES

                                                     of the global economy

                       70%                           committed to carbon neutrality
                                                     UN December 2020

                                  x3                 increase in resource
                                                     consumption in the last 50 years

                                                     urban population

                     +2bn                            in emerging markets
                                                     By 2050, UN projections 2015-2050

             MAKING THE WORLD A BETTER HOME

26 /
                       H1 2021 RESULTS AND OUTLOOK
CHALLENGE                        OUR ACTIONS
  Supported by stimulus packages and raise in
  environmental awareness
                                                                                      Pre.formance
                                                                                      Energy performance improvement in
                                                                                      Germany with 2-D offsite: 50%
                                                                                      reduction in CO2 emissions vs.
                                                                                      traditional homes

                                                greenhouse gas emissions
                                                by 2030 in European Union             Renov’up
                                                                                      Program launched in association with
                                                       Compared to 1990               start-ups and SMEs in France to
                                                                                      accelerate innovative solutions for
                                                                                      building renovation

                                                             ~50% Group sales in renovation market

27 /
                                                  H1 2021 RESULTS AND OUTLOOK
CHALLENGE                          OUR ACTIONS
   Supported by light construction & circular
   economy

                                                                                        Glass wool recycling
                                                                                        Insulation material recycling service

                                                  increase in natural
                                                resources consumption                   Kitting solutions for
                                                          1970-2017
                                                                                        light construction
                                                    consumption increase                Plasterboards, metal framing and
                                                  vs. x2 population increase            accessories to reduce on-site waste and
                                                                                        improve productivity

                                                              ~40% Group sales in light construction

28 /
                                                H1 2021 RESULTS AND OUTLOOK
CHALLENGE                             OUR ACTIONS

  Supported by Saint-Gobain’s solutions &
  global footprint                                                                      +90% growth in Saint-Gobain’s
                                                                                        EV sales (17-21 CAGR)
                                                                                        ~20% of Saint-Gobain Mobility
                                                                                        sales on EV market by end-2021

                                                  urban population
                                               in emerging countries
                                                                                        Prioritize plant
                                            Urban inhabitants in emerging countries     openings in emerging
                                             by 2050 - UN projections 2015-2050
                                                                                        countries

                                                            ~20% Group sales in emerging countries

29 /
                                               H1 2021 RESULTS AND OUTLOOK
CHALLENGE                          OUR ACTIONS

  Supported by Saint-Gobain’s solutions &
  global footprint                                                                   Bioprocessing
                                                                                     solutions
                                                                                     Recyclable single-use systems to
                                                                                     avoid water & chemicals usage

                                                                                     Refractories for glass
                                            Share of manufacturing                   furnaces
                                            industry emissions out of                25% reduction in greenhouse gas
                                            total CO2 emissions1                     thanks to design improvements and
                                                                                     cruciform use

                                                             Targeting net zero carbon by 2050

 1. Climate Watch
30 /
                                              H1 2021 RESULTS AND OUTLOOK
01   H1 2021 HIGHLIGHTS

     02   H1 2021 RESULTS

     03   STRATEGY

     04   OUTLOOK

31
High Performance Solutions: continued sequential improvement in industrial markets, excluding
       automotive in Europe. Businesses related to customer investment should rally steadily, although
       are expected to remain down on the good level recorded in 2018

       Europe: continued outperformance in construction led by renovation and support from stimulus
       programs, albeit with a high comparison basis for the summer months and in December, when
       trade professionals are expected to take more holiday than in 2020

       Americas: market growth, particularly residential construction, in both North and Latin America

       Asia-Pacific: market growth with continued good momentum in China, ongoing uncertainty in
       India and significant health-related disruptions in South-East Asia

32 /                                            H1 2021 RESULTS AND OUTLOOK
Accelerate growth as leader in light and sustainable construction, offering
       decarbonization solutions for construction and industry

           Outperformance versus the market thanks to an agile organization focused on its customers in each
           country and end market

           A range of integrated, differentiated and innovative solutions to help our customers decarbonize

           Further ESG progress with the deployment of our 2030 roadmap towards carbon neutrality in 2050

           Continued optimization of the Group’s profile (divestments and acquisitions) and integration of
           Chryso, leading global player in construction chemicals

33 /                                           H1 2021 RESULTS AND OUTLOOK
Continue our initiatives focused on profitability and performance: maintain robust
       margins and strong free cash flow generation
           Constant focus on the price-cost spread amid strong inflation in raw material and energy costs
           Reduction in costs as part of post-coronavirus adaptation measures
           Reinforcement of the operational excellence program
           Maintaining the structural improvement in operating working capital requirement
           Capital expenditure of around €1.5 billion and ongoing digital transformation
           Continued reduction in non-operating costs

       For full-year 2021, the Group is now targeting a very strong increase in operating
       income to a new all-time high, with like-for-like operating income in second-half
       2021 close to the previous record of second-half 2020

34 /                                         H1 2021 RESULTS AND OUTLOOK
SANTHANAM B.                 Patrick DUPIN             Thierry FOURNIER
                        Asia-Pacific           Northern Europe          Southern Europe & MEA

                                                                                                               38%      % women

       Javier GIMENO          Cordula GUDDUSCHAT                 Anne HARDY                   Benoit
        Latin America                  Marketing                    Innovation             d’IRIBARNE
                                                                                      Industrial Performance
                                                                                                                     % international
                                                                                                               50%      members
                 David MOLHO                  Benoit BAZIN             SREEDHAR N.
            High Performance Solutions                               Chief Financial Officer
                                               Chief Executive
                                                   Officer
                                                                                                                     average years of
                               Claire PEDINI                                            Mark RAYFIELD
                                                                                                               18     experience in
                                                         Laurence PERNOT                                               Saint-Gobain
                           Human Resources & ESG                                           North America
                                                              Communications

         Ursula SORITSCH-RENIER              Maud THUAUDET               Antoine VIGNIAL
               Chief Digital Officer               Strategy              Corporate Secretary
35 /                                                                  H1 2021 RESULTS AND OUTLOOK
This presentation contains forward-looking statements with respect to Saint-Gobain’s financial condition, results,
 business, strategy, plans and outlook. Forward-looking statements are generally identified by the use of the words
 “expect”, “anticipate”, “believe", "intend", "estimate", "plan" and similar expressions. Although Saint-Gobain believes
 that the expectations reflected in such forward-looking statements are based on reasonable assumptions as at the
 time of publishing this document, investors are cautioned that these statements are not guarantees of its future
 performance. Actual results may differ materially from the forward-looking statements as a result of a number of
 known and unknown risks, uncertainties and other factors, many of which are difficult to predict and are generally
 beyond the control of Saint-Gobain, including but not limited to the risks described in the “Risk Factors” section of
 Saint-Gobain’s Universal Registration Document available on its website (www.saint-gobain.com). Accordingly,
 readers of this document are cautioned against relying on these forward-looking statements. These forward-looking
 statements are made as of the date of this document. Saint-Gobain disclaims any intention or obligation to
 complete, update or revise these forward-looking statements, whether as a result of new information, future events
 or otherwise. This presentation does not constitute any offer to purchase or exchange, nor any solicitation of an
 offer to sell or exchange securities of Saint-Gobain. No representation or warranty, express or implied, is made by
 Saint-Gobain or its managers, corporate officers, employees, contractors, representatives or advisors as to the
 accuracy or completeness of the information or opinions contained in this presentation.

36 /                                                   H1 2021 RESULTS AND OUTLOOK
APPENDICES
change/H1-2020                         change/H1-2019
                                         actual                like-for-like     actual   like-for-like

                                     +24.6%                    +27.4%          +2.1%       +11.9%
Sales                  €22.1bn
Operating income       €2,376m       +187%                     +193%           +45.1%      +52.7%

Operating margin         10.7%      +600 bps                                   +310 bps

EBITDA                 €3,248m       x2                                        +34.4%

EBITDA margin            14.7%     +550 bps                                    +350 bps

Recurring net income   €1,506m       x 5.5                                     +59.5%

Free cash flow         €2,461m       +46.7%                                    x 3.6

38 /                             H1 2021 RESULTS AND OUTLOOK
2021/2020                                          2021/2019
                               +28.1%                                             +13.7%
                               like-for-like                                      like-for-like
                                                        +24.7%      +26.8%                                               638

                  +1.3%                        +3.4%
                                                                                                     349

                             -2.6%
                                                                                                               137

       7,558                                                        9,584                           3.6%      1.8%       6.7%

  H1-2020 sales   Exchange   Structure          Price   Volumes   H1-2021 sales                     H1-2019   H1-2020   H1-2021
                    rates

39 /                                                                  H1 2021 RESULTS AND OUTLOOK
Breakdown of H1 2021                                              Industrial assets
                  Operating income                                                at June 30, 2021

               Asia-Pacific                                                  Asia-Pacific

                         4%                                                                            HPS
                                       HPS                                             7%
                              21%                                                               22%
 Americas                                                         Americas
                23%                                                              17%

                               24%
                                       Northern                                                  27%
  Southern                                                                       27%
Europe - ME        28%                 Europe                       Southern                           Northern
    & Africa                                                      Europe - ME                          Europe
                                                                      & Africa

 40 /                                        H1 2021 RESULTS AND OUTLOOK
H1 2021 Sales                                             H1 2021 Operating income

              North
              America                                                                                France
                                          France                     North
                       15%                                           America                   19%
         Latin                      27%                                            24%
        America
                  6%
    Asia-
   Pacific        7%
                                                                   Latin         9%
  Eastern         7%                                             America                                 Other Western
  Europe,                                                                                          30%
                                                                                    9%                     European
Africa & ME                                                                                                countries
                              38%                                                        9%
                                                                   Asia-Pacific

                        Other Western                                            Eastern Europe,
                          European                                                 Africa & ME
                          countries
 41 /                                              H1 2021 RESULTS AND OUTLOOK
Residential new-build - USA                                 Non-residential - India                        Schools and hospitals - Nordics

       DESIGN                                                       PRODUCE                                           DISTRIBUTE

                   Co-development                  Industrial partnerships            Consulting and logistics         Intermediation

               BIM                          Building science          Off-site manufacturing               Training               Recycling

       Multi-family residential - Eastern Europe                             Sustainable mobility                             Renovation - France

42 /                                                                              H1 2021 RESULTS AND OUTLOOK
Energy-efficient renovation of a single-family house in France
                                                                                                                                       100% solutions manufactured or distributed by Saint-Gobain

              +150%                                             €677bn
        “Energy renovation”                                  Annual European                                                                   Potential maximum yearly
          key words web                                     building renovation                                                 -88%5          energy expense reduction
                                                                                                                                                                          1              Mechanical ventilation
             search1                                              market3

                                                                                                                                                                          2
                                                                                                                                                                                         Glass wool, wood fiber

                                                                                                                                           1
                                                                                                                                                 2                        3              External thermal insulation
                 88%                                                72%
                                                              of buildings in                                                                         4                                  composite systems (ETICS)
          of people spend
         more time at home                                     Europe to be                                                            3
        since the pandemic2                                 renovated by 2050
                                                                                                                                                      5                   4
                                                                                                                                                                                         Double-glazed windows

                                                                                                                                                                          5              Heat pump, thermodynamic
                                                                                                                                                          6                              boiler, water radiators
              +150%                                        x2 objective
             Visitors on
                                                            Annual renovation                                                     +4       Energy performance analysis
            Saint-Gobain                                                                                                                                                  6
                                                              rate in the EU                                                   classes                                                  Intermediation with end customer
         renovation website4

                                                                                             Saint-Gobain, the one-stop-shop for
                                                                                              sustainable and light construction
       1. Google trends France 12 months rolling vs. previous period 2. USP survey 3. Euroconstruct 2021 – 19 countries
43 /   4. H1 2021 vs. H1 2019 5. Calculations for a single-family house built between 1948 and 1974 based on the          H1 2021 RESULTS AND OUTLOOK
       French report to the European Commission
Renovation of a hospital
                                                                                                                               100% solutions manufactured or distributed by Saint-Gobain

                                                                                                                                                                                     1   Air quality
                                                                                                                  -20% 6        Energy consumption
                    2x                                             2/3
           Expected increase                                Share of world                                                      Example of Montfermeil renovation in France - also   2
                                                                                                                                includes savings enabled by consumption
          in people over 60 by                            population in urban                                                   monitoring through captors
                                                                                                                                                                                         Health, shock
                 20501                                      areas by 20502                                                                                                               resilience and
                                                                                                                                                                                     3   acoustic
                                                                                                                                                                8
                                                                                                                                                                                         performance:
                                                                                                                                                                                         partitions,
                                                                                                                                                                                     4   ceilings,
                                                                                                                       2           1            5
              2bn/year                                                                                                                                              4                    and X-ray
                                                                +3.6%                                                                                                                5   plasterboards
        Avg EIB investment in                             Expected 5y growth
       healthcare infrastructure                                                                                           3
                                                             in surgeries
            and innovation3                                  performed4                                                                          7                                       Visual and thermal
                                                                                                                                                                                     6
                                                                                                                                                                                         comfort:
                                                                                                                                       6                                                 architectural membranes,
                                                                                                                                                                                     7   Sage electrochromic
                                                                                                                                                                                         glass
              340kWh                                               3%
                                                            Target for yearly
       Average yearly electricity
          use /m² in a hospital                              public building                                      -11% 6 Potential reduction in                                      8   Upstream project
              in the US5                                      renovation
                                                                                                                         length of patient stays                                         assistance:
                                                                                                                                                                                         prescription, BIM

                                                                                     Saint-Gobain, the one-stop-shop for
                                                                                        sustainability & performance
       1. OECD 2. United Nations DESA 3. WHO 4. PR Newswire data for 2017-2022 period 5. Bizenergy Advisor
44 /   6. Building 4 People report published by BPIE (Building Performance Institute Europe)                 H1 2021 RESULTS AND OUTLOOK
Saint-Gobain electric mobility solutions
                                                                                                                                                             Well-being & energy savings
                                                                                                                       Average car weight reduction
                                                                                                                -7kg   thanks to Saint-Gobain solutions        1               Lightweight glazing

                    x3                                             ~15%                                                                                                        Tinted glass & repair
                                                               Contribution of                                                   2                             2
         Passenger transport
                                                             transport sector to
         increase 2015-20501
                                                             world CO2 emissions2
                                                                                                                                             1                 3               Thermal & acoustic insulation
                                                                                                                                                         5
                                                                                                                                                 3
                                                                                                                                                             Performance & energy savings
                                                                                                                                         4
                                                                                                                                                                               Tolerance rings
              €5-10tn                                                36m                                                                                       4
           Recovery plans                                    estimated regular
           worldwide with                                   users of car sharing
          mobility initiatives3                              services by 20254                                                                                 5               Films & battery separators

                                                                                                                                                             Well-being & energy savings
                                                                                                                             2                                 1               Climacoat heated windshield
                                                                                                                                     3
                  27m                                                  x2
               Expected                                                                                                                              1
          electric vehicles in                                Total energy use                                                                                 2               Thermal insulation
          circulation by 2030                               increase in transport
                                                             sector 2010-20505
                                                                                                                                                               3               Micaver electrical insulation

                                                                                              Performance solutions
                                                                                       to consume less energy per kilometer
45 /   1. BCC Research 2. WRI 3. €750bn in EU, $1.9tn in the USA, €6tn in China 4. Frost & Sullivan 5. IEA 6.
                                                                                                                   H1 2021 RESULTS AND OUTLOOK
       European Commission
NEW RESIDENTIAL               1%                  7%                   8%         5%           2%
             CONSTRUCTION
                        23%
       NEW NON-RESIDENTIAL                 1%                5%                   3%          2%           1%
          CONSTRUCTION
                         12%
                                          1%                    20%                22%         8%
     RENOVATION / INFRAST.                                                                                 1%
                     52%**
                   MOBILITY                    6%
                        6%
         OTHER INDUSTRIES                      7%
                        7%

                                         HPS        NORTHERN             SOUTHERN        AMERICAS   ASIA-PACIFIC
                                        ~16%         EUROPE               EUROPE -         ~15%         ~4%
* Saint-Gobain estimated end markets                  ~32%               ME & AFRICA
** Renovation 46% & Infrastructure 6%                                       ~33%

     46 /                                           H1 2021 RESULTS AND OUTLOOK
Theme                                                    Saint-Gobain indicators                                                                2019    2020
       CLIMATE                                                  CO2 emissions (Mt) – scope 1+2                                                         10.8     10.4
                                                                CO2eq avoided emissions thanks to our insulation solutions sold in 1 year (Mt)                 1,200*
                                                                kgCO2/€ sales                                                                           0.25    0.27
 E
       ENERGY                                                   Renewable electricity contribution as part of electricity consumption (%)              18.2%   18.9%
       WATER                                                    Industrial water withdrawal (M of m3)                                                   48.9    45.4
       CIRCULAR ECONOMY                                         Avoided virgin raw materials (Mt)                                                        8.5    10.1
       HEALTH & SAFETY                                          Group accident frequency rate (TRAR)
                                                                                                                                                        2.2     1.8
                                                                (employees, temporary workers and permanent subcontractors)
       DIVERSITY                                                Share of women managers among managers (%)                                             24.2%   25.3%
                                                                Share of women on Group Executive Committee (%)                                                 25%
       ENGAGEMENT                                               Satisfaction survey:
 S     & TALENT DEVELOPMENT                                      Employees responding (% total)                                                       74%      78%
                                                                 Engagement index score                                                                79       82
                                                                 Employees feel adequately trained to do their work (% respondents)                   87%      88%
       SOCIAL PROTECTION                                        "CARE by Saint-Gobain" social protection program coverage (% employees):
                                                                 Parental pillar (14 weeks maternity leave on full salary and a minimum of 3
                                                                                                                                                               100%
                                                                    days leave on full salary for the spouse after the birth or adoption of a child)
       ETHICS & COMPLIANCE                                      % of new managers trained to our Principles of Conduct and Action in their first
                                                                                                                                                       93%      97%
                                                                year
       DIVERSITY                                                Share of women on Board (%)                                                            45%     45%
 G
       BOARD STRUCTURE                                          Share of independent directors on Board (%)                                            73%     82%
       MANAGEMENT INCENTIVES                                    % ESG criteria in long-term incentive plans                                            15%     20%
       GROUP SAVINGS PLAN                                       Proportion of shares held by Group employees’ savings plan (%)                         8.7%    9.1%
47 /   * Estimate based on 2017 sales of insulative solutions                                   H1 2021 RESULTS AND OUTLOOK
You can also read