CapitaMalls Asia Limited - Asia's Leading Mall Developer, Owner and Manager US & Europe Non-Deal Roadshow 5-13 March 2014 - Finanznachrichten
←
→
Page content transcription
If your browser does not render page correctly, please read the page content below
CapitaMalls Asia Limited
          Asia’s Leading Mall
     Developer, Owner and Manager
       Singapore •China •Malaysia • Japan •India

    US & Europe Non-Deal Roadshow
            5-13 March 2014
0
Disclaimer
    This presentation may contain forward-looking statements that involve assumptions, risks and
    uncertainties. Actual future performance, outcomes and results may differ materially from those
    expressed in forward-looking statements as a result of a number of risks, uncertainties and
    assumptions. Representative examples of these factors include (without limitation) general industry
    and economic conditions, interest rate trends, cost of capital and capital availability, competition
    from other developments or companies, shifts in expected levels of occupancy rate, property
    rental income, charge out collections, changes in operating expenses (including employee
    wages, benefits and training costs), governmental and public policy changes and the continued
    availability of financing in the amounts and the terms necessary to support future business. You
    are cautioned not to place undue reliance on these forward-looking statements, which are based
    on the current view of management on future events.

    The information contained in this presentation has not been independently verified. No
    representation or warranty expressed or implied is made as to, and no reliance should be placed
    on, the fairness, accuracy, completeness or correctness of the information or opinions contained in
    this presentation. Neither CapitaMalls Asia (“CMA”) or any of its affiliates, advisers or
    representatives shall have any liability whatsoever (in negligence or otherwise) for any loss
    howsoever arising, whether directly or indirectly, from any use, reliance or distribution of this
    presentation or its contents or otherwise arising in connection with this presentation.

    The past performance of CMA is not indicative of the future performance of CMA.

    The value of shares in CMA (“Shares”) and the income derived from them may fall as well as rise.
    Shares are not obligations of, deposits in, or guaranteed by, CMA or any of its affiliates. An
    investment in Shares is subject to investment risks, including the possible loss of the principal
    amount invested.
1                                          CapitaMalls Asia Limited * March 2014
Contents
Overview of CapitaMalls Asia
FY 2013 Highlights
Our Key Markets
Financial Performance
Valuation of Properties
Capital Management
Our Strategic Thrusts
Outlook
Appendix
2 CapitaMalls Asia Limited * March 2014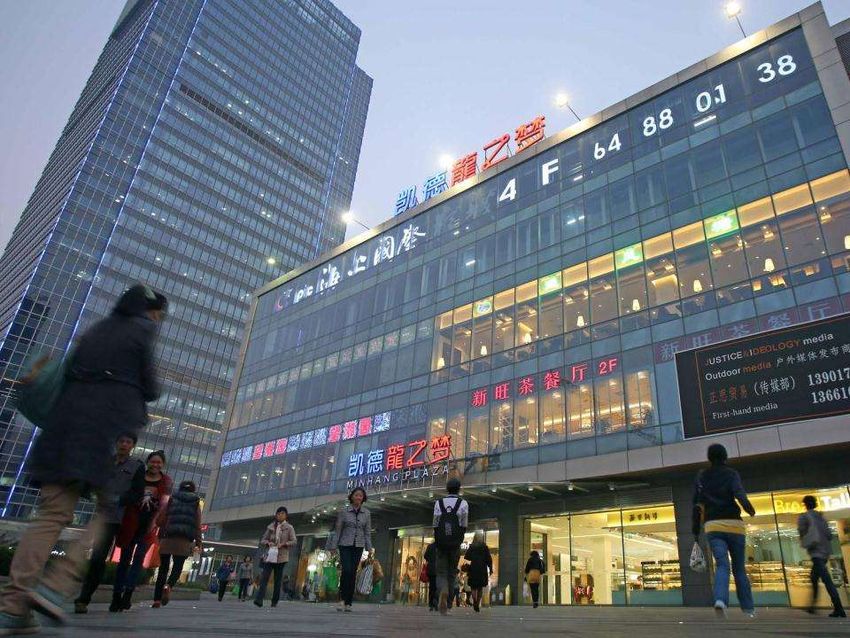
Overview of
        CapitaMalls Asia

3   Westgate, Singapore   CapitaMalls Asia Limited * March 2014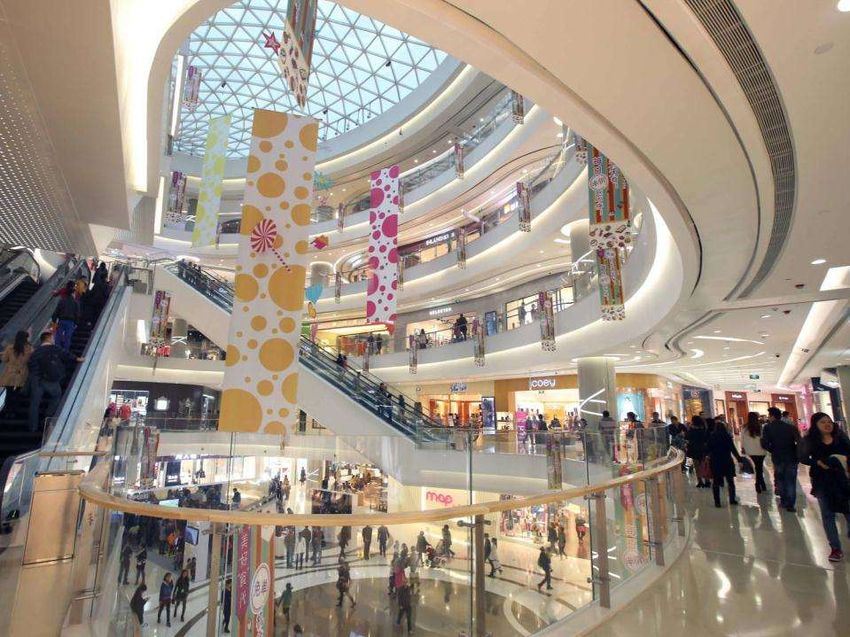
Overview of CapitaMalls Asia Limited
                      Asia’s Leading Mall Developer, Owner and Manager

     • CapitaMalls Asia (“CMA”) is one of the largest listed
       shopping mall developers, owners and managers in Asia by
       total property value of assets and by geographic reach
     • Listed on SGX and HKEx, total market capitalisation of
       about S$7.6 bil1
     • 1052 shopping malls with a total property value3 of
       approximately S$34.3 bil2 as at 31 Dec 2013                                                                                          ION Orchard
                                                                                                                                             Singapore

       Hongkou Plaza                           Gurney Plaza                                 Olinas Mall                            The Celebration Mall
      Shanghai, China                        Penang, Malaysia                              Tokyo, Japan                               Udaipur, India
    (1) As at 31 Dec 2013.
    (2) Excludes CMA’s interest in Horizon Realty Fund, which CMA does not manage.
    (3) Aggregate property value of the properties in CMA’s portfolio (where the property value of each of the properties is taken in its
        entirety regardless of the extent of CMA’s interest).

4                                                               CapitaMalls Asia Limited * March 2014
FY 2013 Highlights

5                                                  CapitaMalls Asia Limited * March 2014
    CapitaMall Jinniu (Phase II), Chengdu, China
Highlights
Strong Financial Performance
4Q 2013 FY 2013
Operating PATMI S$60.9 mil (+54.9%) S$246.3 mil (+40.1%)
Total PATMI1 S$216.4 mil (+17.1%) S$600.0 mil (+9.9%)
EPS 5.6 Singapore cents (+16.7%) 15.4 Singapore cents (+10.0%)
Steady Sales Growth in Key Markets for FY 2013
Singapore China
+13.2% total tenants’ sales
Tenants’ sales2 +3.2% per sq m
+10.1% per sq m
Shopper traffic2 +2.4% +2.2%
Same mall NPI +4.5% +13.1%
Proposed Final Dividend of 1.75 Singapore cents
(1) Total PATMI for 4Q 2013 includes: Operating PATMI of S$60.9 mil, Portfolio Gain of S$5.1 mil and Revaluation Gain of S$150.4 mil.
Total PATMI for FY 2013 includes: Operating PATMI of S$246.3 mil, Portfolio Gain of S$25.3 mil and Revaluation Gain of S$328.4 mil.
(2) On a same-mall basis.
6 CapitaMalls Asia Limited * March 2014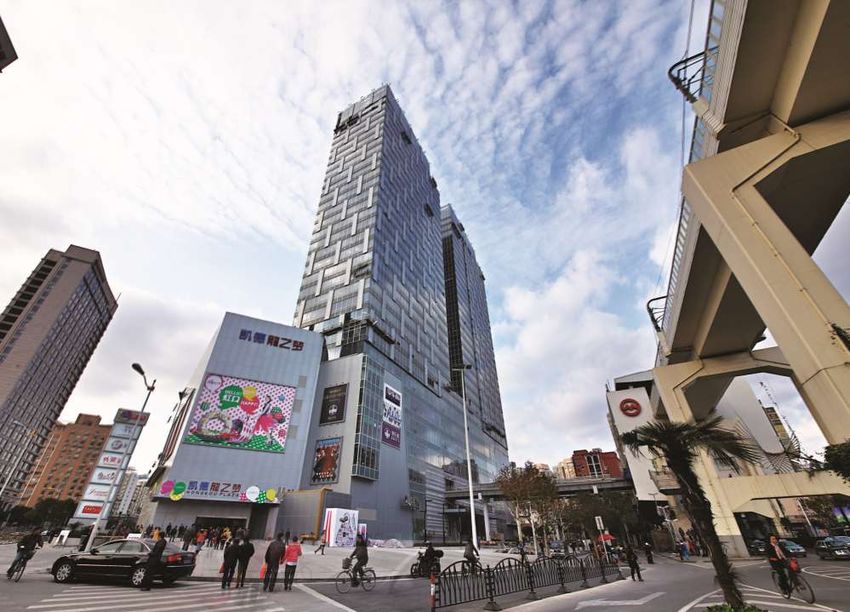
Sustained Growth in Dividend and NTA
Commitment to distribute at least 20% of PATMI, taking into
consideration reinvestment needs
Proposed Dividend Details1 Proposed final dividend of
1.75 Singapore cents
Name of Dividend Final (One-tier)
7.7% higher than 2012 final
dividend
Type of Dividend Cash
NTA per share plus proposed
1.75 Singapore cents dividends grew 12.2%
Dividend per share (10.7 Hong Kong year-on-year3
cents2)
(1) Subject to final shareholders’ approval at the upcoming Annual General Meeting. Dividends distribution timetable will be determined and
announced at a later date.
(2) Based on an exchange rate of S$1 = HK$6.1143
(3) Net tangible assets (NTA) per share grew from S$1.67 to S$1.84 in 2013, while full year dividends increased from 3.25 Singapore cents to 3.5
Singapore cents.
7 CapitaMalls Asia Limited * March 2014
2013 Year in Brief
                    4 Malls Opened; 3 Capital Recycling; 4 Acquisitions

                                                    Luwan Integrated
                        CapitaMall Meilicheng,   Development, Shanghai,                       CapitaMall SKY+,
                          Chengdu, China                                                                         Project Jewel, Singapore
                                                        China                                 Guangzhou, China

       Jan                      Apr                       Jul                          Sep            Nov                 Dec

     Gutian Site,          CapitaMall 1818,      CapitaMall Grand Canyon, CapitaMall Jinniu (Phase II),
                                                                                                                   Westgate, Singapore
    Wuhan, China            Wuhan, China               Beijing, China          Chengdu, China

    Mall Opening

    Acquisition

    Capital Recycling
                         CapitaMall Xinduxin,
                           Qingdao, China                                                                         Bedok Mall, Singapore

                                                                                                                             2Q
8                                                    CapitaMalls Asia Limited * March 2014                                  2013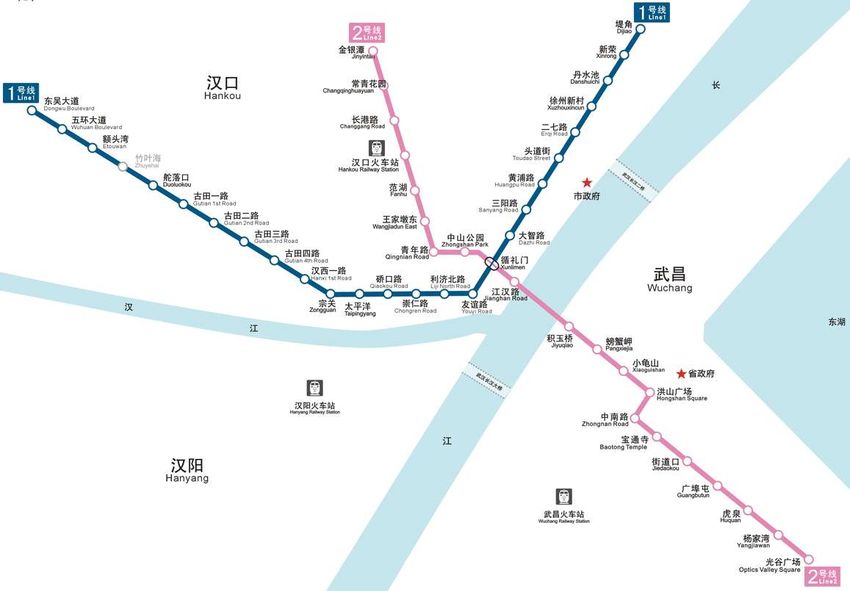
Shopper Traffic & Tenants’ Sales
                                                                                                     FY 2013 vs.
                                          YTD Dec 2013
       Malls                                                                                        FY 2012 (%)*
     opened                  NPI Yield (%)                Committed                   Shopper               Tenants’ Sales
      before                 on Valuation1                Occupancy                    Traffic              (on a per sq ft
    1 Jan 2012                                             Rate (%)2                                              or
                                                                                                            per sq m basis)

    Singapore                         5.8                        99.3                  +2.4%                        +3.2%

                                                                                                                  +10.1%
    China                             5.4                        97.3                  +2.2%             (excl. Tier 1 cities:
                                                                                                               11.0%)

    Malaysia                          6.8                        97.8                  (2.5%)                           -

    Japan                             5.8                        96.9                   +3.4%                       +6.0%

    India                             4.7                       86.83                   +6.1%                       +4.4%
    Note: The above figures are on a 100% basis, with the NPI yield and occupancy of each mall taken in their entirety regardless of CMA’s interest. This analysis takes into account
    all property components that were opened prior to 1 Jan 2012.
    (1)    Average NPI yields based on valuations as at 31 Dec 2013.
    (2)    Average committed occupancy rates as at 31 Dec 2013.
    (3)    Excluding Serviced Apartment Component

    *   Notes on Shopper Traffic and Tenants’ Sales:
        Singapore: Excludes Bugis Junction (which is undergoing AEI), JCube, The Star Vista, Bugis+, The Atrium@Orchard and Hougang Plaza,
        China: Excludes 3 master-leased malls under CRCT. Excludes tenants’ sales from supermarkets and department stores. Excludes CapitaMall Minzhongleyuan, which is
               undergoing AEI.
        Malaysia: Point of sales system not ready.
9       Japan: For Vivit Minami-Funabashi and Chitose Mall only.       CapitaMalls Asia Limited * March 2014
China: Strong Growth in NPI Yields of
Operational Malls
Total tenants’ sales growth of +13.2% and +10.1% on psm basis
Cost NPI Yield on Cost (%) Yield Tenants’ Sales
Year of Number (100% Effective (100% basis) Improvement (psm) Growth1
Opening of Malls basis) Stake FY FY FY 2013 FY 2013
(RMB bil) 2013 2012 vs. FY 2012 vs. FY 2012
20052 4 1,214 57.9% 5.5 5.1 +7.3% +9.4%
20063 8 2,990 43.5% 9.8 8.8 +10.9% +4.0%
2007 2 1,829 28.5% 9.9 9.4 +4.8% +11.0%
2008 5 2,951 32.4% 7.7 6.7 +14.6% +16.6%
2009 8 3,933 26.6% 8.1 6.8 +18.5% +9.5%
2010 6 2,512 41.8% 4.0 3.4 +18.4% +9.2%
2011 3 9,234 65.0% 4.4 3.9 +15.4% +18.5%
YTD Dec 2013 NPI Yield on Cost Gross Yield on Cost
China Portfolio4 7.1% 12.1%
(1) Tenants’ sales are on a same-mall basis (100%) and exclude sales from supermarkets and department stores.
(2) Excludes Raffles City Shanghai.
(3) Excludes malls under or previously under master lease, namely, CapitaMall Shuangjing, CapitaMall Anzhen, CapitaMall Erqi and CapitaMall Saihan.
(4) For property components that were opened before 1 Jan 2012.
For more information of our portfolio, please refer to our website:
http://www.capitamallsasia.com/en/corporate/investor-relations/property-details.
10 CapitaMalls Asia Limited * March 2014Same-Mall NPI Growth (100% basis)
Local
Change
Country Currency FY 2013 FY 2012
(%)
(mil)
Singapore1 SGD 6894 659 +4.5%
China2 RMB 2,239 1,980 +13.1%
Malaysia MYR 264 243 +8.7%
Japan3 JPY 1,789 1,732 +3.2%
India INR 193 176 +10.1%
Note: The above figures are on a 100% basis, with the NPI of each mall taken in its entirety regardless of CMA’s interest. This analysis compares the
performance of the same set of property components opened prior to 1 Jan 2012.
(1) Excludes JCube, which was opened in Apr 2012, The Star Vista, which opened in Sep 2012, Bugis+, which underwent AEI until Jul 2012, The
Atrium@Orchard, which underwent AEI until Oct 2012, and Hougang Plaza, which was divested by CMT in Jun 2012.
(2) Excludes CapitaMall Minzhongleyuan, which is undergoing AEI. Excluding CRCT, NPI grew by 15.0%.
(3) Excludes Olinas Mall, the acquisition of which by CMA was completed in Jul 2012.
(4) Includes one-off write-back of S$1.8 million provision of property tax that was no longer required.
11 CapitaMalls Asia Limited * March 2014NPI Breakdown by Country (effective stake)
Local
Change
Country Currency FY 2013 FY 2012
(%)
(mil)
Singapore SGD 235 206 +14.2%
China RMB 848 620 +36.9%
Malaysia MYR 131 117 +11.5%
Japan1 JPY 2,689 1,838 +46.3%
India INR 39 31 +27.0%
Note: The above figures are on the basis of CMA’s effective stakes in the respective properties. This analysis takes into account all property components
that were open as at 31 Dec 2013 and 31 Dec 2012 respectively.
(1) La Park Mizue, Izumiya Hirakata and Coop Kobe Nishinomiya-Higashi were acquired by CMA in Jan 2012. Olinas Mall was acquired by CMA in Jul
2012.
12 CapitaMalls Asia Limited * March 2014Our Key Markets 13 CapitaMall Jinniu (Phase II), Chengdu, China CapitaMalls Asia Limited * March 2014
Westgate, Singapore
                                Opened on 2 Dec with ~90% occupancy
                                3.4 mil shopper traffic in opening month

                                                                                    New to Market Brands

     Note: as at 31 Dec 2013.

14                                          CapitaMalls Asia Limited * March 2014
Bedok Mall, Singapore
Opened on 3 Dec with full occupancy
1.4 mil shopper traffic in opening month
New to Market Brands
Note: as at 31 Dec 2013.
15 CapitaMalls Asia Limited * March 2014Project Jewel, Singapore
Iconic integrated lifestyle development at Changi Airport
49:51 joint venture with Changi Airport
Group
~1,443,000 sq ft of total GFA1
~S$1.47 bil expected total project
development costs
Targeted opening by end-2018
To serve tourists, airport passengers
Artist Impression(subject to change)
and Singaporeans with exciting and
distinctive retail offerings
Exclusive landmark project to attract
and introduce new-to-market retailers
and concepts
Artist Impression(subject to change)
(1) Total GFA includes retail (~969,000 sq ft), facilities for airport operations(~185,000 sq ft), indoor gardens and attractions
(~238,000 sq ft) and hotel (~51,000 sq ft).
16 CapitaMalls Asia Limited * March 2014Westgate Tower, Singapore
Block sale of office tower for S$579.4 mil
Net gain of ~S$90.0 mil based on
CMA’s effective stake of 58.3%1
Expected TOP by end 2014
Artist Impression(subject to change)
(1) As at 3 Jan 2014. Based on CMA’s 50% direct interest and 27.6% indirect interest through CapitaMall Trust which has 30% direct
interest.
17 CapitaMalls Asia Limited * March 20142 Malls Opened in Chengdu, China
CapitaMall Meilicheng, Chengdu CapitaMall Jinniu (Phase II), Chengdu
Opened on 28 Apr, >98% committed Opened on 29 Sep, >93%1 committed
~5% yield after 1st year of operation ~7% yield after 1st year of operation
(1) Occupancy rate is for both Phase 1 and Phase 2 of CapitaMall Jinniu
18 CapitaMalls Asia Limited * March 2014CapitaMall SKY+, Guangzhou, China
Attractive landmark shopping mall in Guangzhou
Strategic entry into first-tier city in South China
Strategic location in core
commercial centre of Baiyun
District
Differentiated retail offerings for
under-served shoppers and
retailers
~RMB2,646 mil expected total
investment cost
Targeted phased opening from 4Q
Artist Impression(subject to change) 2014, with 4-5% yield after 1st year
of opening
Build scale in Guangzhou
19 CapitaMalls Asia Limited * March 2014Financial Performance 20 Minhang Plaza, Shanghai, China CapitaMalls Asia Limited * March 2014
FY 2013 Financial Results
                  PATMI Up 9.9% To S$600.0 million

                          FY 2013                          FY 2012   Change
       (S$ mil)                                                        %

     Rev under mgt        2,110.2                          1,803.7    17.0

       Revenue              380.4                            361.2    5.3
        PATMI               600.0                            546.0    9.9

          EPS             15.4cts                          14.0cts    10.0
     NTA per share         S$1.84                           S$1.67    10.2

21                        CapitaMalls Asia Limited * March 2014
FY 2013 Financial Results
Operating PATMI Up 40.1% To S$246.3 million
FY 2013 FY 2012 Change
(S$ mil)
%
Operating PATMI 246.3 175.7 40.1
Portfolio Gains 25.3* 100.6# (74.8)
Revaluation 328.4 269.7 21.8
Total PATMI 600.0 546.0 9.9
Note:
* Included portfolio gain on completion of transfer of assets to CapitaMalls China Development Fund III (S$18.8 mil) and gain from
warehousing (S$7.1 mil), partially offset by portfolio loss arising from divestment of an asset in India by the Horizon Fund (S$0.6 mil).
# Gain from monetisation of CapitaMall Tianfu and CapitaMall Meilicheng to CapitaMalls China Development Fund III (S$64.5 mil),
share of disposal gain of Hougang Plaza (S$24.1 mil) and dilution of Group’s stake in CapitaMall Trust (S$7.6 mil) and CapitaRetail
China Trust (S$4.4 mil) following the equity placements in 4Q 2012.
22 CapitaMalls Asia Limited * March 2014Operating PATMI (by Category)
45.5% 39.8%
S$ mil 121 176 246
w 52 74 102 120 126
300
250
200
245 236
205
150
148 193
100
57 80
80
29 61
50
32 55 32 38
17 30 19
0 2 5 14
-50 -81 -82 -96 -101 -106
-7 -11
-100 -12 -4
-24 -6 -9
-45 -32 -34
-34 -27
-150 -31 -30 -25
-200
2H2011 1H2012 2H2012 1H2013 2H2013
Corporate Cost Treasury Finance Costs Property Income
Management Fee Business Residential Profits Others (Including Foreign Exchange)
Country Finance Cost, Tax and NCI Property Income from China
Note: Operating PATMI: PATMI excluding revaluation gain, portfolio gain and impairment loss.
23 CapitaMalls Asia Limited * March 2014Operating PATMI (by Country)
45.5% 39.8%
S$ mil 121 176 246
w 52 74 102 120 126
200
150
120
94 126
100
91
82
50 42 33
27
26
11 16 23 15
19 18 16 12 12
0 1-4 1-4 -3 -4 -2
-12
-24 -32 -27
-34
-45 -25
-50 -34
-31 -30
-100
2H2011 1H2012 2H2012 1H2013 2H2013
HQ Cost Treasury Finance Costs Singapore China Malaysia Japan India
Operating PATMI: PATMI excluding revaluation gain, portfolio gain and impairment loss.
24 CapitaMalls Asia Limited * March 2014Valuation of
Properties
25 Westgate, Singapore CapitaMalls Asia Limited * March 2014CMA’s Valuation Gain (as at 31 Dec 2013)
Supported by NPI improvements in key markets
Retail growth in China remains strong
2H 2013 S$ mil Key highlights
Operating Malls
Singapore 73.3 Mainly due to CMT portfolio and ION Orchard arising from improvements in NPI
and retail growth and opening of Bedok Mall in December 2013.
China 94.8 Mainly due to overall improvement of NPI and opening of CapitaMall Jinniu
(Phase II) in September 2013, with cap rates remaining stable.
Malaysia 12.2 Improvement in NPI mainly from Queensbay Mall.
Japan (17.7) Largely due to increase in cap rate at Vivit, partially offset by Olinas mall’s gain
due to improved NPI.
India (1.1) Mainly from Forum Value Mall.
Total – Operating Malls 161.5
PUD
China 5.2 Mainly from Luwan and CapitaMall Tianfu as project milestones were achieved
and in comparison with pricing of surrounding projects.
India (13.3) Mainly from Nagpur, Jalandhar and Graphite malls.
Total – PUD (8.1)
Total 153.4
26 CapitaMalls Asia Limited * March 2014CMA’s Valuation Gain (FY 2013)
Supported by NPI improvements in key markets
Retail growth in China remains strong
FY 2013 S$ mil Key highlights
Operating Malls
Singapore 158.9 Mainly due to CMT portfolio and ION Orchard arising from improvements in NPI
with cap rates compression of 0.2% to 0.3% for Singapore malls; opening of
Bedok Mall in December 2013.
China 170.9 Mainly due to overall improvement of NPI, mall opening and cap rate
compression in certain properties.
Malaysia 27.8 Improvement in NPI mainly due to Gurney Plaza, The Mines and Queensbay
Mall.
Japan (17.9) Largely due to increase in cap rate at Vivit, partially offset by Olinas mall’s gain
due to improved NPI.
India (1.6) Mainly from Forum Value Mall.
Total – Operating Malls 338.1
PUD
China 6.1 Mainly from Luwan and CapitaMall Tianfu as project milestones were achieved
and in comparison with pricing of surrounding projects.
India (12.8) Mainly from Nagpur, Jalandhar and Graphite malls.
Total – PUD (6.7)
Total 331.4
27 CapitaMalls Asia Limited * March 2014Valuation Summary (as at 31 Dec 2013)
1
As at 31 December 2013 Singapore China Malaysia Japan India Total
Valuation methods* CAP/DCF/ CAP/DCF/ CAP/DCM CAP/ CAP/DCF/ NA
DCM RLV DCF DCM
2
Capitalisation rate (%) Retail: Key cities : 7.0 to 7.3 5.5 to 8.0 10.0 to 11.5 NA
5.0 to 6.5 9.0 to 9.5 (Gross)
5.8 to 7.0 (Net)
Office:
4.0 to 6.3 Non-key cities:
9.0 to 10.5 (Gross)
5.8 to 7.0 (Net)
Note * : Valuation methods include
(a) CAP: Capitalisation Method (c) DCM : Direct Comparison Method
(b) DCF: Discounted Cashflow Method (d) RLV: Residual Land Value Method
Note 1: This excludes the Raffles City portfolio of assets and malls under master lease, such as CapitaMall Shuangjing, CapitaMall Anzhen and CapitaMall
Erqi.
2: Key cities comprise Beijing, Shanghai, Chengdu, Chongqing and Wuhan.
28 CapitaMalls Asia Limited * March 2014Capital
Management
29 CapitaMalls Asia Limited * March 2014
Hongkou Plaza, Shanghai, ChinaHealthy Balance Sheet & Liquidity Position
31 Dec 2013 30 Sep 2013
Equity (S$ mil) 7,269 7,082
Cash (S$ mil) 1,004 1,155
Net Debt/Equity 22% 21%
% Fixed Rate Debt 89% 89%
Ave Debt Maturity (Yr) 4.3 4.5
Interest Service Ratio 6.7x 6.0x
Net Debt/Total Assets
36% 36%
(Effective)1
(1) On effective stake basis. Basis of calculation: (Total Gross Debt – Total Cash) / (Total Assets – Total Cash)
30 CapitaMalls Asia Limited * March 2014Group Debt Maturity Profile as at 31 Dec 2013
- on Consolidated Basis
Liquidity Summary S$ mil
Total Committed Financing Facilities 2,949
Amounts Drawn (2,599)
Undrawn Committed Facilities 350
Cash 1,004
Total Liquidity 1,354
10% NAV
700
600
S$ mil
MTN
500
400
300 MTN
B
200 MTN B RB
B
100 RB UF
B UF
B UF
0
2014 2015 2016 2017 2018 2019 2020 2021 2022 >2023
Bank (B) Retail Bond (RB) Medium Term Notes (MTN) Undrawn Facilities (UF)
31 CapitaMalls Asia Limited * March 2014Sources of Funding
Diversified funding base made up of medium term notes (MTN),
retail bond, bank facilities and project financing
Bank Facilities
(Undrawn), 10.5%
Bank Facilities
Uncommitted (Drawn), 31.1%
Facilities, 11.3%
Total
Facilities
S$3.3 bil
Medium Term
Notes (MTN),
20.4%
Project Financing,
10.9%
Retail Bond, 15.8%
32 CapitaMalls Asia Limited * March 2014Funding vs Commitments
1,600
~S$1,350 mil
1,400
Transfer of Asset
Transfer of Asset ~S$1,190 mil
Committed
(Luwan): S$190
(Luwan): ~S$200 mil
1,200 mil
Facilities:
Singapore:
S$350 mil
1,000 ~S$260 mil
S$ mil
800
600 Cash
@ Dec 13: China:
400 ~S$1,000 mil ~ S$920 mil
200
0
Others: ~S$10 mil
Funding Commitments
33 CapitaMalls Asia Limited * March 2014Our Strategic Thrusts 34 CapitaMall Taiyanggong, Beijing, China CapitaMalls Asia Limited * March 2014
Singapore - Building Dominance
     Through Scale
         20 retail properties in both downtown and suburbs
       Total GFA of 14.6 mil sq ft and asset value of S$15.4 bil

35                         CapitaMalls Asia Limited * March 2014
China – Building Relevant Scale in Key
Regions…
Key clusters of Beijing, Shanghai, Chengdu, Chongqing, Wuhan &
Guangzhou
10
malls
in 1
3 2
Beijing Core Area Airport
Express
4 10
1
3 2 56
7
4 10
56 9
7
9
8
1. CapitaMall Wangjing 6. CapitaMall Cuiwei
2. CapitaMall Taiyanggong 7. CapitaMall Shuangjing
3. CapitaMall Anzhen 8. CapitaMall Tiangongyuan
8 4. CapitaMall Xizhimen 9. CapitaMall Grand Canyon
36 5.CapitaMalls
CapitaMall Asia Crystal 10. Raffles City Beijing
Limited * March 2014China – Building Relevant Scale in Key
Regions…
Key clusters of Beijing, Shanghai, Chengdu, Chongqing, Wuhan &
Guangzhou
6
malls 1
in
Shanghai 4
Core Area
2
5
3
3
S20 Outer Expy
1
2 6
4 3
5
6 1. Hongkou Plaza 4. Raffles City Changning
2. Raffles City Shanghai 5. CapitaMall Qibao
3. Luwan Integrated Development 6. Minhang Plaza
37 CapitaMalls Asia Limited * March 2014China – Building Relevant Scale in Key
Regions…
Key clusters of Beijing, Shanghai, Chengdu, Chongqing, Wuhan &
Guangzhou
5 Subway Line
1
Shengxian Lake
malls 2
Chadianzi Bus Station North Railway Station
in Yangxi Overflys
Yishitianxia Food Street Renming North Road
Chengdu Core Area
Shuhan Road East
Baiguolin Wenshu Monastery
Hospital of
University of Tonghui Men Luoma Market
traditional Chinese Chunxi Road
Tianfu Square Dongmen Bridge
Renming Park
Jingjiang Hotel Niuwang Temple
Niushikou
Huaxi Ba
1 3State Stadium Dongdalu
5Chengdu East Interchange
2 Nijia Qiao
Tazishan Park
Chengyu Flyovers
Tongzi Lin
4 Chengdu South Railway Station
Huiwang Tomb
Honghe
Chengdu
Gaoxing Administration
School
Finance District Subway Line
3 5 Innovation Park
Century City
4
1. CapitaMall Jinniu 4. CapitaMall Tianfu
2. CapitaMall Shawan 5. CapitaMall Meilicheng
3. Raffles City Chengdu
38 CapitaMalls Asia Limited * March 2014China – Building Relevant Scale in Key
Regions…
Key clusters of Beijing, Shanghai, Chengdu, Chongqing, Wuhan &
Guangzhou
3
Dazhulin
Photoelectric Park
North Railway
Shuangbei
Station
malls Zhengjiayuanzi Shiziba
Ranjiaba
Core Area Tangjiayuanzi
in
Jiazhoulu
Dalongshan Hongqihegou
Wulidian
Chongqing Ciqikou Flower Park Huangnibang Hongtudi
Guanyinqiao
Grave of Martyrs
3
Zengjiayan Daxigou
Niujia
Huanghuayuan
Yanggong Bridge Huaxinjie otuo
1 Shapingba Liziba Niujiaotuo
Linjiangmen
Xiaoshizi
Foquanguan Qixinggang
Xiaolong Yin Jiaochangkou
Eling
Daping Lianglukou
Daping
Jiaochangkou
Subway Majiayan Shiyoulu
Gaomiao Village
Line 1
Xietaizi Subway
Shiqiaopu Gnagyuanju Line 3
3 Nongjiagang Chongqing Industry &
1 Trade School
Nanping
Xiejiawan
Subway Sigongli
Line 2
2
Yangjiaping
Wugongli
Mawangchang
Liugongli
Dayan Zoo
Village
Pingan Ertang
2 Dadukou
Bagongli
Xinshan Village
1. CapitaMall Shapingba 2. CapitaMall Jiulongpo
3. Raffles City Chongqing
39 CapitaMalls Asia Limited * March 2014China – Building Relevant Scale in Key
Regions…
Key clusters of Beijing, Shanghai, Chengdu, Chongqing, Wuhan &
Guangzhou
4
malls
in
Wuhan 4
Core Area
3 2
1 Link Subway
Line 4 (To be
finished in
3 2014
4
Province
Government
2
1
3
1. CapitaMall Wusheng 3. CapitaMall 1818
2. CapitaMall Minzhongleyuan 4. Mall in Gutian
40 CapitaMalls Asia Limited * March 2014China – Building Relevant Scale in Key
Regions…
Key clusters of Beijing, Shanghai, Chengdu, Chongqing, Wuhan &
Guangzhou
4
malls
around Guangzhou
Guangzhou
Core Area
1
4
2 3
Zhaoqing
Foshan Dongguan
1
4 2 3
1. CapitaMall SKY+, Guangzhou 3. CapitaMall Dongguan, Dongguan
2. CapitaMall Nanhai, Foshan 4. CapitaMall Zhaoqing, Zhaoqing
41 CapitaMalls Asia Limited * March 2014Outlook 42 CapitaMall Meilicheng, Chengdu, China CapitaMalls Asia Limited * March 2014
Financial Performance By Country:
           Healthy ROE from Core Markets
     S$ mil                             Singapore               China          Malaysia Japan                India     HQ       Total
     FY 2013 PATMI                            405                 262                67                 5     (23)    (116)2    600
     NAV as at 31 Dec
                                             3,300               4,700              500                300    100     (1,600)   7,300
     2013
     - Completed
                                             3,100               2,800              500                300    20         -      6,720
       Properties

     - Properties under
                                              200                1,900                -                 -     80         -      2,180
       Development

     ROE1
                                              12%                  6%              13%                 2%    (23%)       -       8%
     based on Total NAV
     ROE1
     based on                                                                                                            -
                                              13%                  9%              13%                 2%    (115%)              9%
     Completed
     Properties NAV

     Notes : Figures are rounded for presentational purposes.
     (1) ROE is defined as PATMI divided by CMA’s NAV.
     (2) Includes corporate cost, treasury finance cost & corporate tax.

43                                                             CapitaMalls Asia Limited * March 2014
CMA:
Operational Malls Make Up 75% of NAV
2015
onwards
Operational
21%
75%
2014
4%
105 Malls
NAV: S$7.3 bil
Projects under development Operational Malls
44 CapitaMalls Asia Limited * March 2014China:
Operational Malls Make Up > 75% of Effective NAV1
2005 & earlier2
5%
20063
2014
9%
onwards
23% 2007
3%
2008
4%
2009
2013
3% 62 Malls 5%
2010
4%
2012
12%
2011
32%
Projects under development Operational Malls
(1) Effective NAV is based on CMA’s proportionate share of property book value plus cash and less debt as at 31 Dec 2013.
(2) Includes Raffles City Shanghai and CapitaMall Minzhongleyuan.
(3) Includes malls under or previously under master lease namely CapitaMall Shuangjing, CapitaMall Anzhen, CapitaMall Erqi and
CapitaMall Saihan.
45 CapitaMalls Asia Limited * March 2014Pipeline of Malls Opening
No. of Properties as of 31 Dec 2013
Country
Operational Target to be Target to be opened in Total
opened in 2014 2015 & beyond
Singapore 19 - 1 20
China 51 21 9 62
Malaysia 5 - 1 6
Japan 8 - - 8
India 2 2 5 9
Total 85 4 16 105
(1) Not including CapitaMall Fucheng (Phase II), Mianyang.
46 CapitaMalls Asia Limited * March 2014Outlook
Singapore
The Ministry of Trade and Industry expects a 2%-4% GDP growth for 2014 but cautious
optimism with persisting headwinds from major global economies
Westgate and Bedok Mall to contribute fully in 2014 and onwards
Profit recognition from sales of Bedok Residences and Westgate Tower
Project Jewel to secure future growth and strengthen CMA’s market leadership
Resilient and stable underlying income from quality portfolio of malls
China
China registered 7.7% GDP growth in 2013, higher than official growth target of 7.5%
Short term volatilities expected as China continues to make adjustments to pursue
sustainable and quality growth
Our strengthening portfolio of malls is well-positioned to ride on China’s long-term
economic growth, rising income and consumption
Sharper execution to deliver financial returns; deepen presence in key gateway cities and
to grow scale
47 CapitaMalls Asia Limited * March 2014Thank You
Thank You
For enquiries from analysts & investors, For enquiries from Hong Kong/China analysts,
please contact please contact:
Teng Li Yeng Maggie Huang
Investor Relations Investor Relations
Tel: (65) 6826 5357 Tel: (86) 10-5879 9018
Email: teng.liyeng@capitaland.com Email: maggie.huang@capitaland.com
48Appendix
49 CapitaMalls Asia Limited * March 2014
Bedok Mall, SingaporeCMA’s Business Structure
65.36%
Singapore China Malaysia Japan India
Directly Held Directly Held Directly Held CapitaMalls
Directly Held
India
45.45%
Joint Ventures Joint Ventures Joint CapitaMalls Development
Venture 26.29% Japan Fund Fund
REIT Funds1
REIT
27.62%
REIT 36.10%
21.33%
15.28%
Note: Effective interests in CMT, CRCT & CMMT by CapitaMalls Asia are as at 31 Dec 2013.
(1) Refers to the 5 China funds, namely, CapitaMalls China Income Fund, CapitaMalls China Income Fund II, CapitaMalls China Income
Fund III, CapitaMalls China Development Fund III and Raffles City China Fund.
50 CapitaMalls Asia Limited * March 2014Same-Mall NPI Growth (100% basis)
Local
Change
Country Currency 4Q 2013 4Q 2012
(%)
(mil)
Singapore1 SGD 1724 160 +6.9%
China2 RMB 543 465 +16.8%
Malaysia MYR 67 61 +10.9%
Japan3 JPY 423 444 -4.7%
India INR 41 47 -13.6%
Note: The above figures are on a 100% basis, with the NPI of each mall taken in its entirety regardless of CMA’s interest. This analysis
compares the performance of the same set of property components opened prior to 1 Jan 2012.
(1) Excludes JCube, which opened in Apr 2012, The Star Vista, which opened in Sep 2012, Bugis+, which underwent AEI until Jul
2012, The Atrium@Orchard, which underwent AEI until Oct 2012, and Hougang Plaza, which was divested by CMT in Jun 2012.
(2) Excludes CapitaMall Minzhongleyuan, which is undergoing AEI. Excluding CRCT, NPI grew by 14.8%.
(3) Excludes Olinas Mall, the acquisition of which by CMA was completed in Jul 2012.
(4) Includes one-off write-back of S$1.8 million provision of property tax that was no longer required.
51 CapitaMalls Asia Limited * March 20144Q 2013 Financial Results
PATMI Up 17.1% To S$216.4 million
4Q 2013 4Q 2012 Change
(S$ mil)
%
Rev under mgt 558.5 501.0 11.5
Revenue 103.7 113.6 (8.7)
PATMI 216.4 184.8 17.1
EPS 5.6cts 4.8cts 16.7
NTA per share S$1.84 S$1.67 10.2
52 CapitaMalls Asia Limited * March 20144Q 2013 vs 4Q 2012 Financial Results
● Revenue Under Management was 11.5% higher in 4Q 2013 mainly due to:
(i) Plaza Singapura and IMM which resumed full quarter contributions; and
(ii) opening of 7 malls in China in 2H 2012 (CapitaMall Taiyanggong, CapitaMall
Wusheng, CapitaMall Xuefu, CapitaMall Rizhao, CapitaMall Xindicheng,
Raffles City Chengdu, Raffles City Ningbo).
● Revenue decreased by 8.7% to S$103.7 million in 4Q 2013 mainly due to:
(i) lower leasing commission and project management fee from China as there
were fewer malls opened in 2013 as compared to 2012;
(ii) reclassification of mall related reimbursable staff cost from revenue to cost of
sales for Singapore.
● The Group’s 4Q 2013 PATMI was S$216.4 million, a 17.1% increase as
compared to 4Q 2012. This was largely contributed by:
(i) profit recognition for units sold in Bedok Residences;
(ii) improved management business in Singapore;
(iii) higher contribution from CapitaMall Trust (CMT) due to Plaza Singapura and
IMM resuming full quarter contributions;
(iv) better performance from China funds; partially offset by
(v) lower contribution from management fee business in China.
53 CapitaMalls Asia Limited * March 20144Q 2013 Financial Results
Operating PATMI Up 54.9% To S$60.9 million
4Q 2013 4Q 2012 Change
(S$ mil) %
Operating PATMI 60.9 39.3 54.9
Portfolio Gains 5.1* 11.9# (57.5)
Revaluation 150.4 133.6 12.6
Total PATMI 216.4 184.8 17.1
Note:
* Included portfolio gain on post completion of transfer of an asset to CapitaMalls China Development Fund III (S$5.4mil) partially offset
by portfolio loss arising from divestment of an asset in India by the Horizon Fund (S$0.3 mil).
# Gainfrom dilution of Group’s stakes in CapitaMall Trust (S$7.6 mil) and CapitaRetail China Trust (S$4.4 mil) following their equity
placements in 4Q 2012.
54 CapitaMalls Asia Limited * March 2014FY 2013 vs FY 2012 Financial Results
● Revenue Under Management was 17.0% higher in FY 2013 mainly due to:
(i) higher contribution from CMT arising from JCube, Bugis+ and Plaza Singapura
which resumed full year contributions after major asset enhancements; and
(ii) opening of 7 malls in China in 2H 2012 (CapitaMall Taiyanggong, CapitaMall
Wusheng, CapitaMall Xuefu, CapitaMall Rizhao, CapitaMall Xindicheng,
Raffles City Chengdu, Raffles City Ningbo).
● Revenue increased by 5.3% to S$380.4 million in FY 2013 mainly due to:
(i) full year contributions from The Star Vista and Olinas Mall.
● The Group’s FY 2013 PATMI was S$600.0 million, a 9.9% increase as
compared to FY 2012. This was largely contributed by:
(i) profit recognition for units sold in Bedok Residences;
(ii) higher contribution from CMT arising from three malls which resumed full year
contributions after major asset enhancements;
(iii) higher contributions from the four malls in Japan and the China funds;
(iv) opening of The Star Vista; partially offset by
(v) lower management fee business in China.
55 CapitaMalls Asia Limited * March 20144Q 2013 PATMI Contribution
4Q 2013 Contribution by Country
(S$ mil)
S’pore China M’sia Japan India Total
Property Income – Opg/Newly Opened Malls 4 4 5 7 0 20
1
Portfolio Gain 0 6 0 0 (1) 5
1
Revaluation 0 6 12 12 0 30
Subs Management Fee Business 19 3 0 (1) 1 22
Others 1 3 (1) 0 (1) 2
Country Finance Cost, Tax and NCI (5) (5) (2) (1) 0 (13)
Subsidiaries’ Contribution 19 17 14 17 (1) 66
Property Income – Opg/Newly Opened Malls 51 36 8 1 (1) 95
1
Residential Profits 13 0 0 0 0 13
1
Assoc Revaluation/Impairment excluding REITs 46 87 0 (30) (14) 89
& 1
Revaluation REITs 27 7 0 0 (3) 31
JCE
Others (1) (6) (1) (1) (1) (10)
Country Finance Cost, Tax and NCI (17) (24) (2) 0 0 (43)
Assoc & JCE’s Contribution 119 100 5 (30) (19) 175
PATMI by country 138 117 19 (13) (20) 241
Operating PATMI by Country 65 11 7 5 (2) 86
Total before Corporate & Treasury related Costs/Tax 138 117 19 (13) (20) 241
2
Corporate & Treasury related Costs/Tax (25)
PATMI 216
Operating PATMI 61
(1) Net of taxes and NCI.
(2) Includes corporate cost, treasury finance cost & corporate tax of S$9 mil, S$14 mil and S$2 mil respectively.
56 CapitaMalls Asia Limited * March 2014FY 2013 PATMI Contribution
FY 2013 Contribution by Country
(S$ mil)
S’pore China M’sia Japan India Total
Property Income – Opg/Newly Opened Malls 19 19 22 31 0 91
1
Portfolio Gain 0 26 0 0 (1) 25
1
Revaluation 1 10 16 12 0 39
Subs Management Fee Business 57 15 0 (3) 1 70
Others 5 16 (3) (2) (2) 14
Country Finance Cost, Tax and NCI (18) (25) (1) (4) 0 (48)
Subsidiaries’ Contribution 64 61 34 34 (2) 191
Property Income – Opg/Newly Opened Malls 216 141 30 3 0 390
1
Residential Profits 33 0 0 0 0 33
Assoc Revaluation/Impairment excluding REITs 1
102 148 0 (30) (14) 206
& 1
JCE Revaluation REITs 56 19 12 0 (3) 84
Others (5) (16) (3) (1) (4) (29)
Country Finance Cost, Tax and NCI (61) (91) (6) (1) 0 (159)
Assoc & JCE’s Contribution 341 201 33 (29) (21) 525
PATMI by country 405 262 67 5 (23) 716
Operating PATMI by Country 246 59 39 23 (5) 362
Total before Corporate & Treasury related Costs/Tax 405 262 67 5 (23) 716
2
Corporate & Treasury related Costs/Tax (116)
PATMI 600
Operating PATMI 246
(1) Net of taxes and NCI.
(2) Includes corporate cost, treasury finance cost & corporate tax of S$51 mil, S$61mil and S$4mil respectively.
57 CapitaMalls Asia Limited * March 2014Statement of Financial Position
31 Dec 31 Dec
Subsidiaries (S$ mil)
2013 2012
Five China malls, Queensbay Mall
Investment Properties 1,547 1,566
Four Japan malls, The Star Vista
Gutian (2013)/Luwan Integrated
Properties Under Development1 147 548
Development (2012)
JCEs & Associates
ION Orchard, Minhang, Hongkou,
Raffles City Chongqing, Bedok, Jointly-Controlled Entities2 2,446 2,335
Westgate and others
CMT 1,639 1,593
CRCT 306 211
Associates3
CMMT 309 305
Six private funds & Others 1,941 1,563
Cash & Cash Equivalents4 1,004 675
Other Assets Other Investments 498 441
Other Assets 524 694
Total Assets 10,361 9,931
Other Liabilities 506 479
Liabilities Debt5 2,586 2,714
Non-Controlling Interests 105 248
Equity attributable to owners 7,164 6,490
58 CapitaMalls Asia Limited * March 2014Notes to Statement of Financial Position
1. The decrease was mainly due to the transfer of an asset to CMCDF III, partially
offset by a new development project in China.
2. The increase was mainly due to capital call made to Raffles City Chongqing
and the share of profits for FY 2013, partially offset by partial repayment of
long-term loans by the jointly-controlled entities and dividends received from
a jointly-controlled entity.
3. The increase was mainly due to capital call made to CMCDF III and the share
of profits for FY 2013.
4. The increase was mainly due to the partial repayment of loans by the jointly-
controlled entities and the China funds, as well as sales consideration received
for the transfer of an asset to CMCDF III.
5. The decrease was mainly due to the repayment of bank loans.
59 CapitaMalls Asia Limited * March 2014NPI Growth Supported by Strong Tenants’ Sales
(100% basis)
10.0% 1,400
9.0%
8.0% 1,200
7.0%
6.0% 5.1% +8% 5.5%
5.0%
4.7% 1,000 14.9%
20051 5.0%
4.0% 3.1% 3.5% +9% +9.4%
+35%
3.0% 1.9% +12% 800
2.0% 0.9% +66%
1.0% (1.4%) (0.8%)
+100% 600
0.0%
(1.0%) 2005 2006 2007 2008 2009 2010 2011 2012 2013
(2.0%) 400
11.0%
9.6% 4,700
10.0% 8.8%
9.0% 4,300
8.0%
7.8% +10% 3,900
7.0% 6.1% 6.4% +13% 6.3% 3,500
5.1% +21%
2006 2 6.0% 3,100 +4.0%
5.0% +6% 2,700
3.6%
4.0% +19% 2,300
3.0% +41% 1,900
2.0%
1.0% 1,500
(1.9%)
0.0% 1,100
(1.0%) 2005 2006 2007 2008 2009 2010 2011 2012 2013 700
(2.0%) 300
Year of Opening Valuation Trend (100% basis, RMB mil)
Tenants’ Sales Growth (FY13 vs. FY 12). Tenants’ sales are
NPI Yield on Cost
based on a same-mall basis (100%) and excludes sales
from supermarkets and department stores. NPI Yield on Valuation
Note: Please refer to our ‘Property Details Spreadsheet’ for the details of our China malls. http://www.capitamallsasia.com/en/corporate/investor-
relations/property-details.
(1)Excludes Raffles City Shanghai.
60 (2)Excludes malls under or previously under master lease namelyCapitaMalls
CapitaMall Shuangjing, CapitaMall
Asia Limited * MarchAnzhen,
2014 CapitaMall Erqi and CapitaMall Saihan.NPI Growth Supported by Strong Tenants’ Sales
(100% basis)
12.0% 3000
11.0% 9.4% 9.9% 2800
10.0% +4%
8.1% 2600
9.0% +17%
6.5% 2400
8.0%
2007 7.0% 5.7% +24% 6.2% 2200 +11.0%
6.0% 4.7% +15% 2000
5.0% 1800
+19%
4.0% 1600
3.0%
1400
2.0%
1.0% (0.0%) 1200
0.0% 1000
(1.0%) 2005 2006 2007 2008 2009 2010 2011 2012 2013 800
11.0% 4000
10.0%
3800
9.0%
+15% 7.8% 3600
8.0%
6.7% 6.5%
7.0% 3400
+42%
2008 6.0%
4.7%
5.0% 3200
4.0% 3.1%
+51%
3000
+16.6%
2.7%
3.0%
2.0% +16% 2800
(0.6%)
1.0% 2600
0.0%
2400
-1.0% 2005 2006 2007 2008 2009 2010 2011 2012 2013
-2.0% 2200
Year of Opening Valuation Trend (100% basis, RMB mil)
NPI Yield on Cost
Tenants’ Sales Growth (FY 13 vs. FY 12). Tenants’ sales
are based on a same-mall basis (100%) and excludes
sales from supermarkets and department stores. NPI Yield on Valuation
Note: Please refer to our ‘Property Details Spreadsheet’ for the details of our China malls. http://www.capitamallsasia.com/en/corporate/investor-
61 relations/property-details. CapitaMalls Asia Limited * March 2014NPI Growth Supported by Strong Tenants’ Sales
(100% basis)
10.0% 6000
9.0% 8.0% 5750
8.0% 5500
6.8%
7.0% +17% 5250
5.8% 5.4%
6.0%
2009 5000
5.0%
3.7%
+19%
4750
+9.5%
4.0%
+57% 4500
3.0%
2.0% 4250
1.0% 4000
(0.7%)
0.0% 3750
-1.0% 2005 2006 2007 2008 2009 2010 2011 2012 2013 3500
10.0% 3000
9.0% 2950
8.0% 2900
7.0% 2850
6.0%
2800
5.0% 4.0% 2750
2010 4.0% 3.4%
+18%
3.4% +9.2%
2700
3.0%
1.9% +80% 2650
2.0%
1.0% 2600
0.0% 2550
-1.0% 2005 2006 2007 2008 2009 2010 2011 2012 2013 2500
Year of Opening Valuation Trend (100% basis, RMB mil)
Tenants’ Sales Growth (FY 13 vs. FY 12). Tenants’ sales are NPI Yield on Cost
based on a same-mall basis (100%) and excludes sales
from supermarkets and department stores. NPI Yield on Valuation
Note: Please refer to our ‘Property Details Spreadsheet’ for the details of our China malls. http://www.capitamallsasia.com/en/corporate/investor-
62 relations/property-details. CapitaMalls Asia Limited * March 2014NPI Growth Supported by Strong Tenants’ Sales
(100% basis)
11.0% 10,000
10.0%
9.0% 9,800
8.0%
7.0% 9,600
2011 6.0%
4.5% 9,400 +18.5%
5.0% 3.9% 4.2%
4.0% +16%
9,200
3.0%
2.0% 9,000
1.0%
0.0% 8,800
(0.1%)
-1.0% 2005 2006 2007 2008 2009 2010 2011 2012 2013
-2.0% 8,600
Year of Opening Valuation Trend (100% basis, RMB mil)
Tenants’ Sales Growth (FY 13 vs. FY 12). Tenants’ sales are NPI Yield on Cost
based on a same-mall basis (100%) and excludes sales
from supermarkets and department stores. NPI Yield on Valuation
Note: Please refer to our ‘Property Details Spreadsheet’ for the details of our China malls. http://www.capitamallsasia.com/en/corporate/investor-
relations/property-details.
63 CapitaMalls Asia Limited * March 2014FY 2013 Earnings by Country and Business
PATMI by Country Main Contributors to PATMI
Portfolio
Residential Gain
Malaysia Profit S$25 mil,
S$67 mil, 9% China S$33 mil, Property
Japan 3%
S$262 mil, 35% Management 4% Income
S$5 mil, 1% Fee Business S$481 mil, 51%
S$70 mil, 7%
Revaluation
Singapore S$329 mil, 35%
S$405 mil, 55%
Total: S$600.0 mil Total: S$600.0 mil
Note: Includes India (-S$23 mil), Corporate & Treasury related Costs/Tax Note: Includes Others and Foreign Exchange(-S$15 mil),
(-S$116 mil). Corporate & Treasury related Costs/Tax (-S$116 mil).
64 CapitaMalls Asia Limited * March 2014Total Assets by Country (excl Cash holding)*
86% of Group’s Assets in Singapore & China
India
Japan S$81 mil, 1%
S$542 mil, 6%
Malaysia
S$640 mil, 7%
China
S$4,869 mil, 52%
By
Geography
Singapore
S$3,224 mil, 34%
Total: S$9,356 mil
* The above does not include cash holding of S$1,004.3 mil.
65 CapitaMalls Asia Limited * March 2014Geographical Segments (100% Basis)
As at 31 Dec 2013 Singapore China Malaysia Japan India Total
GFA (mil sq ft)1 14.6 69.4 5.5 2.4 6.6 98.5
Property Value (S$ bil)2 15.4 16.2 1.5 0.7 0.4 34.3
No. of Malls 20 62 6 8 9 105
7% 15% 5% 2% 1% 45%
2% 8%
47%
6% 19%
8%
70%
6%
59%
Property No. of
GFA
Value Malls
Singapore China Malaysia Japan India
(1) For projects under development, GFA is estimated.
(2) For committed projects the acquisitions of which have not been completed, property value is based on deposits paid.
66 CapitaMalls Asia Limited * March 20144Q 2013 Pro-rata Income Statement
Subsidiaries Share of Associates Total
(S$ mil) / JCE1,2
Revenue 104 233 337
Cost of Sales (35) (120) (155)
Gross Profit 69 113 182
Other Operating Income 59 191 250
Administrative Expenses (42) (18)
(14.2) (60)
Other Operating Expenses (1) (33) (34)
Profit from Operations 85 253 338
Finance Costs (17) (31) (48)
Profit before Tax 68 222 290
Taxation (21) (47) (68)
Profit after Tax 47 175 222
Non-Controlling Interests (“NCI”) (6) - (6)
Profit after Tax and NCI 41 175 216
(1) The presentation in pro-rata format is for illustration purposes. The pro-rata format presents the net income from associates and
jointly-controlled entities whereby the underlying components of net income are disclosed separately as revenues and expenses.
The inter-company transactions between subsidiaries and associates/JCEs have not been eliminated.
(2) Included as share of results (net of tax) of associates of S$95 mil and JCE of S$80mil, totalling S$175 mil.
67 CapitaMalls Asia Limited * March 2014FY 2013 Pro-rata Income Statement
Subsidiaries Share of Associates Total
(S$ mil) / JCE1,2
Revenue 380 818 1,198
Cost of Sales (140) (372) (512)
Gross Profit 240 446 686
Other Operating Income 140 401 541
Administrative Expenses (147) (62)
(14.2) (209)
Other Operating Expenses (4) (34) (38)
Profit from Operations 229 751 980
Finance Costs (74) (122) (196)
Profit before Tax 155 629 784
Taxation (66) (104) (170)
Profit after Tax 89 525 614
Non-Controlling Interests (“NCI”) (14) - (14)
Profit after Tax and NCI 75 525 600
(1) The presentation in pro-rata format is for illustration purposes. The pro-rata format presents the net income from associates and
jointly-controlled entities whereby the underlying components of net income are disclosed separately as revenues and expenses.
The inter-company transactions between subsidiaries and associates/JCEs have not been eliminated.
(2) Included as share of results (net of tax) of associates of S$295 mil and JCE of S$230 mil, totalling S$525 mil.
68 CapitaMalls Asia Limited * March 2014Pro-rata Statement of Financial Position
as at 31 December 2013
31 December 2013
S$ mil
Subsidiaries Share of Associates/JCE1,2 Total
Investment Properties 1,547 9,288 10,835
Properties Under Development 147 920 1,067
Other Assets 1,022 889 1,911
Cash & Cash Equivalents 1,004 545 1,549
Total Assets 3,720 11,642 15,362
Debts 2,586 3,928 6,514
Other Liabilities 506 1,073 1,579
Total Liabilities 3,092 5,001 8,093
Net Assets 628 6,641 7,269
Non-Controlling Interests (105) - (105)
Equity Attributable to Owners of the Co 523 6,641 7,164
(1) The presentation in pro-rata format is for illustration purposes. The pro-rata format presents the net assets from associates and jointly-controlled
entities whereby the underlying components of net assets are disclosed separately as assets and liabilities. The inter-company balances between
subsidiaries and associates/JCEs have not been eliminated.
(2) Included as interest in associates and JCE of S$4,195 mil and S$2,446 mill respectively, totalling S$6,641mil.
69 CapitaMalls Asia Limited * March 2014Upcoming Implementation Of Financial Reporting
Standard 110 (“FRS110”) - Consolidated Financial Statement
Background
• Changes to the definition of an investor’s control over an investee such that the
consolidation of investee’s financial statements is required
• Affects consolidation of REITs/funds as Sponsors deemed to have control over REITs/funds
based on its significant stake and involvement as REIT/fund manager
• Most countries have adopted FRS 110 in 2013, except for Singapore and Europe
• Singapore has deferred implementation by 1 year to 1st January 2014
How Is “Control” Established
• Investor is exposed, or has rights, to variable returns from its involvement with the investee;
and
• Investor has the ability to affect returns through its power with the investee.
• Based on joint assessment by management and auditor, CapitaMalls Malaysia Trust
(“CMMT”) will be consolidated with effect from 1 January 2014.
70 CapitaMalls Asia Limited * March 2014Illustrative: Impact of FRS 110 on CMA Group
Year ended 31 December 2013
Impact on Balance Sheet – Group
As at As at
31 Dec 2013 FRS 110 31 Dec 2013
S$ million (unaudited) Adjustments (restated)
Total Assets 10,361 949 11,310
Total Liabilities 3,092 403 3,495
Non-Controlling Interests 105 546 651
Total Equity 7,269 546 7,815
Net Debt to Equity Ratio (%) 22% N.A. 24%
Impact on Income Statement – Group
FY 2013 FRS 110 FY 2013
S$ million (unaudited) Adjustments (restated)
Revenue 380 113 493
Profit After Tax 614 58 672
Non-Controlling Interests (14) (58) (72)
PATMI 600 - 600
71 CapitaMalls Asia Limited * March 2014Thank You
For enquiries from analysts & investors, For enquiries from Hong Kong/China analysts,
please contact please contact:
Teng Li Yeng Maggie Huang
Investors Relations Investor Relations
Tel: (65) 6826 5357 Tel: (86) 10-5879 9018
Email: teng.liyeng@capitaland.com Email: maggie.huang@capitaland.com
72 CapitaMalls Asia Limited * March 2014You can also read