Ascendas India Trust
1Q FY2021 Business Updates
21 April 2021
←
→
Page content transcription
If your browser does not render page correctly, please read the page content below
Ascendas India Trust 1Q FY2021 Business Updates 21 April 2021
Disclaimer
This presentation may contain forward-looking statements. Actual future performance, outcomes and results may differ materially from those
expressed in forward-looking statements as a result of a number of risks, uncertainties and assumptions. Representative examples of these
factors include (without limitation) general industry and economic conditions, interest rate trends, cost of capital and capital availability,
availability of real estate properties, competition from other developments or companies, shifts in customer demands, shifts in expected
levels of occupancy rate, property rental income, charge out collections, changes in operating expenses (including employee wages,
benefits and training, property operating expenses), governmental and public policy changes and the continued availability of financing in
the amounts and the terms necessary to support future business.
You are cautioned not to place undue reliance on these forward-looking statements, which are based on the current view of management
regarding future events. No representation or warranty express or implied is made as to, and no reliance should be placed on, the fairness,
accuracy, completeness or correctness of the information or opinions contained in this presentation. Neither Ascendas Property Fund Trustee
Pte. Ltd. (“Trustee-Manager”) nor any of its affiliates, advisers or representatives shall have any liability whatsoever (in negligence or
otherwise) for any loss howsoever arising, whether directly or indirectly, from any use of, reliance on or distribution of this presentation or its
contents or otherwise arising in connection with this presentation.
The past performance of Ascendas India Trust (“a-iTrust”) is not indicative of future performance. The listing of the units in a-iTrust (“Units”) on
the Singapore Exchange Securities Trading Limited (SGX-ST) does not guarantee a liquid market for the Units. The value of the Units and the
income derived from them may fall as well as rise. Units are not obligations of, deposits in, or guaranteed by, the Trustee-Manager. An
investment in the Units is subject to investment risks, including the possible loss of the principal amount invested. Investors have no right to
request that the Trustee-Manager redeem or purchase their Units while the Units are listed on the SGX-ST. It is intended that holders of Units
may only deal in their Units through trading on the SGX-ST.
This presentation for information only and does not constitute an invitation or offer to acquire, purchase or subscribe for the Units.

All measurements of floor area are defined herein as “Super Built-up Area” or “SBA”, which is the sum of the floor area enclosed within the
walls, the area occupied by the walls, and the common areas such as the lobbies, lift shafts, toilets and staircases of that property, and in
respect of which rent is payable.
The Indian Rupee and Singapore Dollar are defined herein as “INR/₹” and “SGD/S$” respectively.
Any discrepancy between individual amounts and total shown in this presentation is due to rounding.                                                    2
1Q FY2021
Business Updates
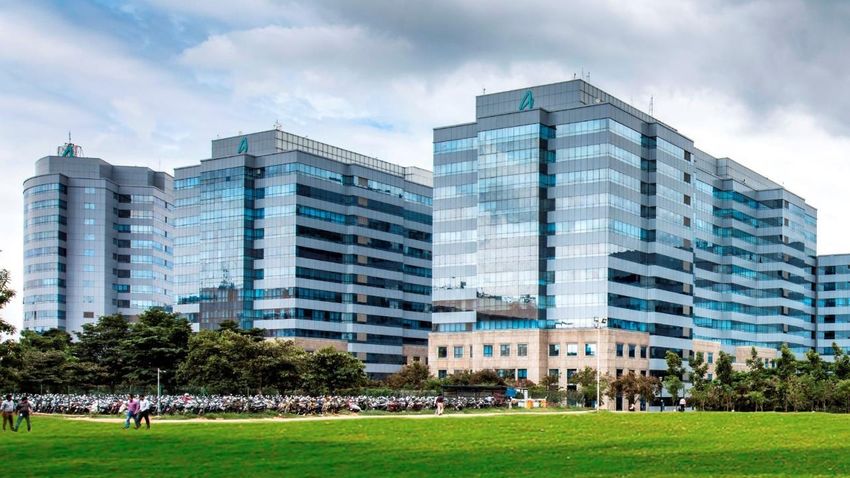
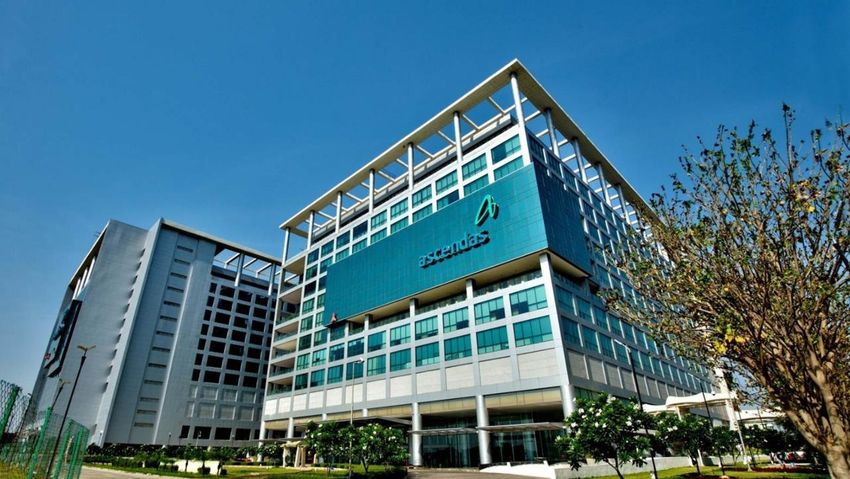
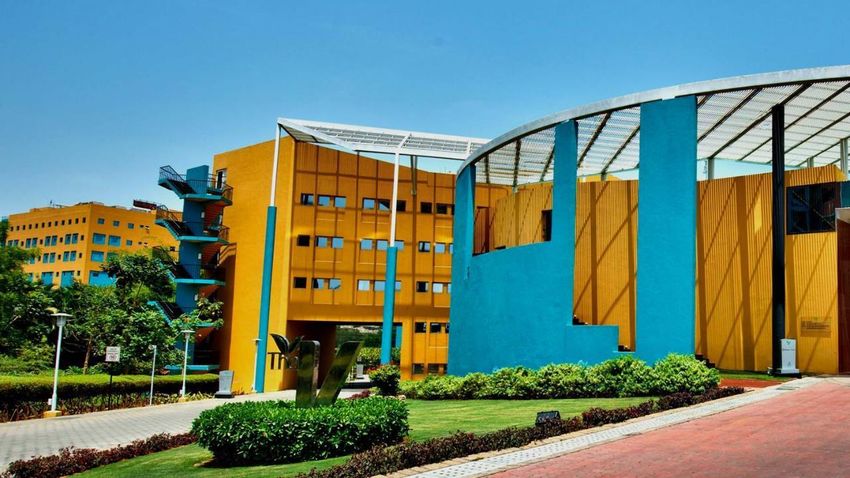
International Tech Park Bangalore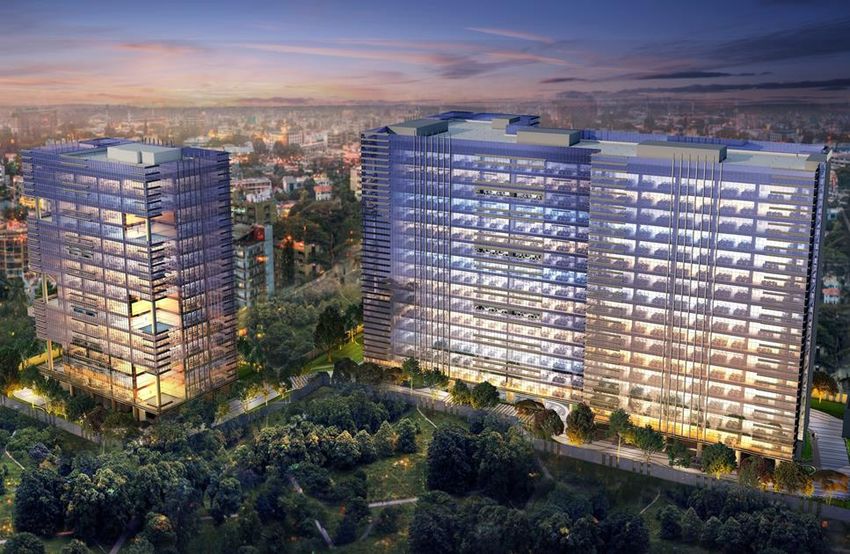
Operational & financial highlights
          REVENUE & NPI^

                                                  1Q FY2021                    1Q FY2020                  Variance
                                                                                                                     •   Decreased slightly due to
SGD/INR FX rate1                                       55.0                         52.1                    5.6%
                                                                                                                         ➢ lower occupancy;
                                                                                                                         ➢ lower utilities income and carpark
                                                    ₹2,590m                      ₹2,642m                    (2%)           income due to COVID-19
Total property income                                                                                                      pandemic;
                                                    S$47.1m                      S$50.7m                    (7%)
                                                                                                                         ➢ partially offset by income from
                                                                                                                           Endeavour building at ITPB

                                                    ₹2,114m                      ₹2,021m                     5%      •   Increased due to lower property
Net property income
                                                    S$38.4m                      S$38.8m                    (1%)         expenses; partially offset by lower total
                                                                                                                         property income.

                    GEARING                                         OFFICE RENT COLLECTION^                                        COMMITTED
                34% as at Mar 2021                                      98% of Jan to Mar billings                                 OCCUPANCY
                                                                               collected2                                                 91%

^    Information has been provided as reference for this quarterly business update in view of COVID-19.
1.   Average exchange rate for the period.
2.   Collection status as at 16 April 2021.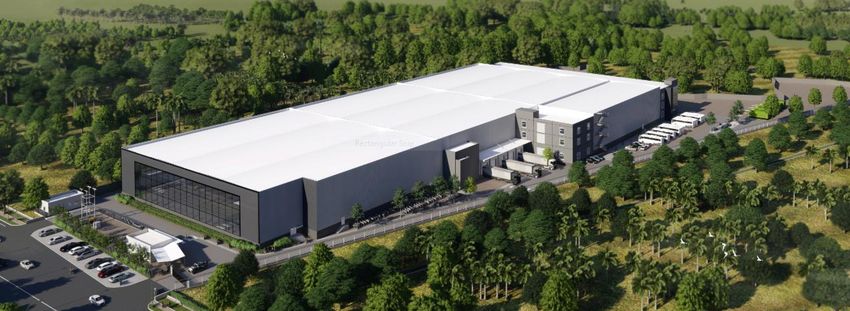
1Q FY2021 key updates
                                         Second wave1
                                         •   India is currently experiencing a resurgence in infections, with 15.1 million tested COVID-19 cases. Despite this,
                                             fatality rate remains low at less than 1.2%.

     COVID-19 in India                   •   Lockdown imposed in Maharashtra, while many other states have re-imposed stricter local restrictions such as
                                             Karnataka imposing night curfews.
                                         •   India has vaccinated more than 100 million people – the fastest country to achieve this (85 days since it began).
                                             India targets to vaccinate more than 300 million people by August.

                                         Operations
                                         •   All parks remain open for essential services to support our tenants’ critical IT & ITES operations. Park Square Mall
                                             (PSQ) has opened from 22 July 2020 onwards.
                                         •   Park population is at approximately 7% and a further decline is expected due to the second wave of COVID-19.
                                             Prior to the second wave, park population was at approximately 9%.
                                         •   Construction works at all on-going projects have resumed. Availability of labour supply and supply chain improved
     Business updates                        considerably; working to catch-up on progress. Expected delays in construction timeline in some projects.
       and impact
                                         Impact on business
                                         •   No office rental rebates given. Rent reliefs provided primarily to retail tenants since April 2020 on a case-by-case
                                             basis.
                                         •   We remain optimistic of the relative resilience of India IT Parks/logistics asset class.
                                         •   a-iTrust continues to diversify into quality micro-markets and new economy asset classes to further enhance the
                                             resilience of the portfolio.
                                                                                                                                                        5
1.    Information as at 19 April 2021.
Investment updates
                                              Construction Funding/Forward Purchase of an Industrial
                                              Facility at Mahindra World City, Chennai
                                              •   Property marks a-iTrust’s foray into the industrial sector
                                                  – a key new economy asset class.
                                              •   Diversification into a new asset class                  further
                                                  strengthens the resilience of our portfolio.
                                              •   Fully pre-leased to Pegatron, a leading Taiwanese
                             aVance 6             electronics contract manufacturer.                                           Artist’s impression of the IT park

Acquisition of aVance 6 & Update                                                                                     Construction Funding/Forward
on aVance 5                                                                                                          Purchase of IT park at Hebbal,
                                                                                                                     Bangalore
•   Completed the acquisition of
    aVance 6 – primarily leased to                                                                                   •   Establishes our presence in Hebbal,
    Amazon, adding another high-                                                                                         an emerging IT/ITES micro-market.
    quality tenant to our portfolio.                                                                                 •   Hebbal enjoys good road and
•   aVance    5   is  100% pre-                                                                                          future Metro rail connectivity which
    committed to a leading US-                                                                                           are key factors that drive the
    based healthcare MNC.                                           Artist’s impression of the industrial facility       development of IT parks.

Diversification into Data Centres
•   a-iTrust is at an advanced stage of acquiring a land parcel in the IT corridor of Navi Mumbai for a greenfield data centre development.
•   This is in line with a-iTrust’s strategy to further diversify our portfolio with the addition of a new asset class, which is experiencing strong demand
    due to the push for digitalisation.

                                                                                                                                                             6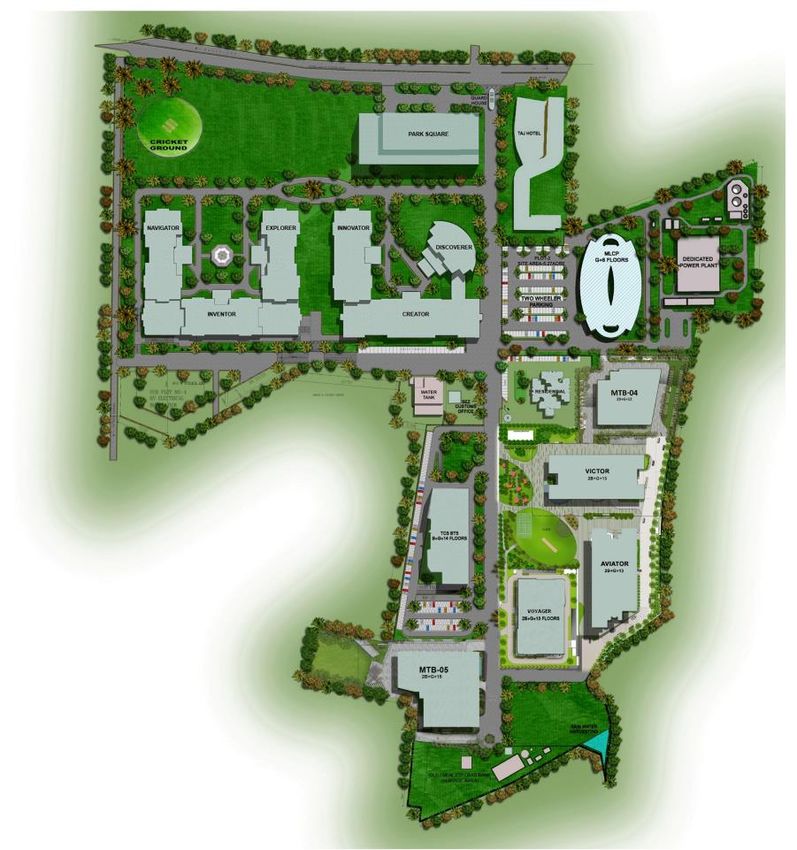
Capital
management

             International Tech Park, Chennai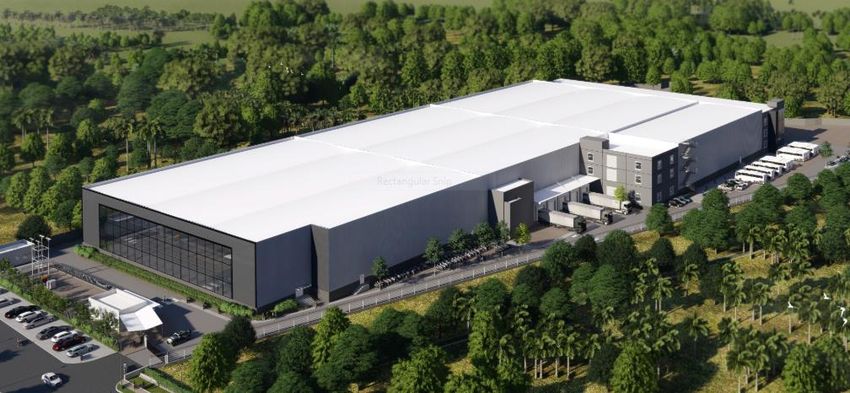
Capital management
Currency hedging strategy                            Funding strategy
    Balance sheet                                    •   The Trustee-Manager’s approach to equity
                                                         raising is predicated on maintaining a strong
•   Trustee-Manager does not hedge equity.
                                                         balance sheet by keeping the Trust’s gearing
•   At least 50% of debt must be denominated in          ratio at an appropriate level.
    INR.                                             •   Trustee-Manager does not borrow INR loans
                                                         onshore in India as it costs less to hedge SGD
                                                         borrowings to INR-denominated borrowings
    Income                                               using cross-currency swaps and derivatives.

•   Income is repatriated semi-annually from India
    to Singapore.                                    Income distribution policy
•   Trustee-Manager locks in the income to be        •   To distribute at least 90% of its income available
    repatriated by buying forward contracts on a         for distribution.
    monthly basis.
                                                     •   a-iTrust retains 10% of its income available for
                                                         distribution to provide greater flexibility in
                                                         growing the Trust.

                                                                                                              8
Debt maturity profile
                                                                   Hedging ratio
  Effective borrowings: S$955 million                              INR: 62% SGD: 38%

S$ Million

               242.6                             236.0
                                                                                   213.8
                47.3

                                                                                                                     162.6

                                                 189.0
                                                                                   170.3                              82.9                              99.8
               195.3

                                                                                                                                                        99.8
                                                                                                                      79.7
                                                  47.0                              43.5

                       1
              FY2021                            FY2022                            FY2023                            FY2024                            FY2025

         SGD Denominated debt                       INR Denominated debt

All information as at 31 March 2021
1. A 5-year S$100 million committed unsecured sustainability-linked loan facility has been obtained in April 2021 and will be used to partially refinance the loans maturing
                                                                                                                                                                               9
   within one year.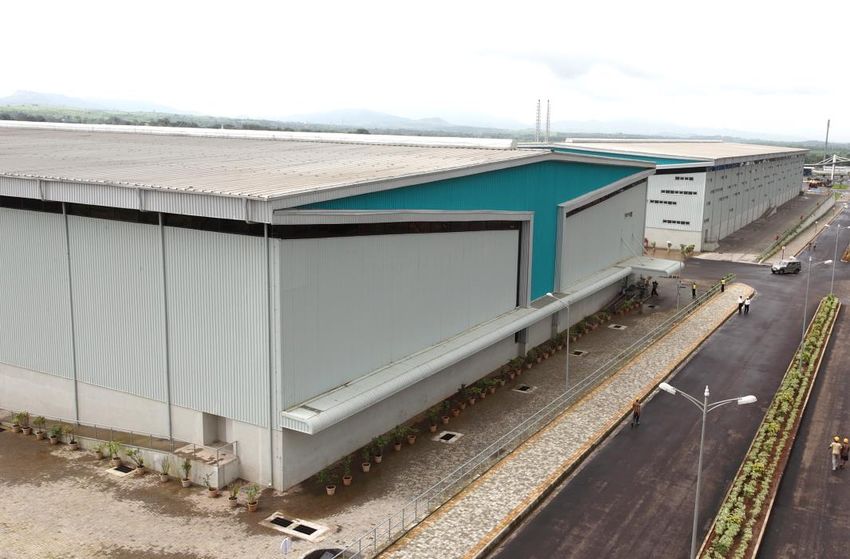
Capital structure
 Indicator                                                              As at 31 March 2021

 Interest service coverage                                                      4.1 times
 (EBITDA/Interest expenses)                                                   (1Q FY2021)

 Percentage of fixed rate debt                                                      76%

 Percentage of unsecured borrowings                                                100%
                                                                                                                                        Gearing: 34%2
 Effective weighted average cost of debt1                                           5.2%

 Gearing limit                                                                      50%

 Available debt headroom                                                      S$933 million

 Cash and cash equivalent                                                     S$160 million

1. Based on borrowing ratio of 62% in INR and 38% in SGD as at 31 March 2021.
2. As at 31 March 2021, the effective borrowings to net asset ratio and total borrowings less cash and cash equivalent to net asset ratio is 72.3% and 61.4% respectively.   10
Operational review
International Tech Park HyderabadOffice markets update
Bangalore (Whitefield) Hyderabad (IT Corridor I1)
5.0 3.0
14.5%
13.9%
4.0
8.9% 9.7% 2.0
3.0
7.2% 5.8%
2.0 6.2% 5.7%
5.1%
1.0
1.0 2.6%
0.0 0.0
CY 2017 CY 2018 CY 2019 CY 2020 1Q 2021 CY 2017 CY 2018 CY 2019 CY 2020 1Q 2021
Chennai (OMR) Pune (Hinjawadi) 17.6% 17.5%
3.0 15.3% 2.0
12.0%
2.0
1.0 8.6%
5.8% 6.0% 6.3%
1.0 3.3%
3.3%
0.0 0.0
CY 2017 CY 2018 CY 2019 CY 2020 1Q 2021 CY 2017 CY 2018 CY 2019 CY 2020 1Q 2021
Supply (million sqft) Gross Absorption (million sqft) Vacancy (%)
Source: CBRE Research
1. Includes HITEC City and Madhapur. 12Diversified portfolio
Portfolio breakdown by base rental
Customer Base
Mumbai
7%
Total number of tenants 287
Pune
9% Average space per tenant 44,903 sqft
Bangalore
36%
Largest tenant accounts for
14% of the portfolio base rent
Chennai
19%
Hyderabad
29%
All information as at 31 March 2021
13Portfolio occupancy
Committed portfolio occupancy: 91%
100%
95% 94% 94% 94% 96%
92% 94%
91% 91%
85% 87%
85%
83%
76%
1 3
ITPB ITPC CyberVale aVance CyberPearl ITPH aVance Arshiya
Arshiya
2 4
Hyderabad Pune Panvel
Panvel
a-iTrust occupancy Market occupancy of peripheral area5
All information as at 31 March 2021
1. Tenant in the newly completed Endeavour building in ITPB has physically occupied the premise.
2. Includes the newly acquired aVance 6.
3. Excludes Mariner building in ITPH which is being vacated for redevelopment.
4. There are no comparable warehouses in the micro-market that the Arshiya Panvel warehouses are located in.
5. CBRE market report as at 31 March 2021.
14Rental reversion1
Bangalore Chennai Hyderabad Pune
25%
21%
20% 19%
20% 19%
16%
15%
10%
8%
7%
5%
0%
ITPB ITPC CyberVale aVance Hyderabad CyberPearl ITPH aVance Pune
All information as at 31 March 2021
1. Rental reversion for a lease is defined as the percentage change of the new effective gross rent over the preceding effective gross rent. Only new and renewed
long-term leases transacted within the last 12 months are included. 15Spread-out lease expiry profile
Weighted average lease term: Weighted average lease expiry:
6.7 years 3.7 years
Monthly base rent expiring
(INR mil)
300
Millions
250 35%
200
23%
150
15% 16%
100
11%
50
-
FY2021 FY2022 FY2023 FY2024 FY2025 & beyond
All information as at 31 March 2021
Note: Retention rate from 1 April 2020 to 31 March 2021 was 46%. 16Quality tenants
% of base % of base
Top 10 tenants rents Top 5 sub-tenants of Arshiya Panvel rents
1 Tata Consultancy Services 14% 1 Huawei Telecommunications 12%
2 Arshiya Panvel 7% 2 DHL Logistics 9%
3 Amazon 5% 3 Shashwat Group 8%
4 Renault & Nissan 4% 4 ZTE Corporation 5%
5 Applied Materials 3%
5 Rolex Logistics (CISCO) 4%
6 Bank of America 3%
7 Societe Generale 3%
8 Technicolor 2%
Top 10 tenants
9 United Health Group 2%
accounted for 44% of
10 Mu Sigma 2%
portfolio base rent
All information as at 31 March 2021
17Diversified tenant base
Tenant core business & country of origin by base rental
Retail
Telecommunication & Network 1%
2% Oil & Argentina
Gas F&B 1 1% Others
Others 1% UK 3%
1% Singapore
Healthcare & Pharmaceutical 2% 1%
2%
3%
Automobile
France
4%
10%
Design, Gaming
IT, Software &
and Media
Application
6%
Development and
Service Support
58%
Electronics, USA
Semiconductor &
Engineering
Tenant core Country of 51%
7% business origin
Logistics
7%
India 2
32%
Banking &
Financial Services
8%
All information as at 31 March 2021
1. Food & Beverage. 18
2. Comprises Indian companies with local and overseas operations.Growth strategy
International Tech Park ChennaiGood growth track record
Total developments: Total acquisitions:
5.6 million sqft 5.4 million sqft
11%
Floor area (million sqft) CAGR
14.4
13.8
0.6
13.1
12.6 1 0.7
11.9 0.5
0.8
1.9
9.7
0.4
8.8 0.3
0.6
7.5 1.3
6.9 6.9
6.5 0.6
6.0 0.4 13.8
0.5 12.6 13.1
11.9
4.7 4.8 4.8 1.2
0.1 9.7
3.6 1.1 8.8
6.9 6.9 7.5
6.0 6.5
4.7 4.8 4.8
3.6 3.6
IPO Dec-07 Dec-08 Dec-09 Dec-10 Dec-11 Dec-12 Dec-13 Dec-14 Dec-15 Dec-16 Dec-17 Dec-18 Dec-19 Dec-20 Mar-21
Portfolio Development Acquisition
1. Includes reduction in floor area due to the demolition of Auriga building (0.2m sqft) in ITPH as part of the redevelopment. 20Clear growth strategy
• 3.1m sqft in Bangalore
Development
• 4.2m sqft1 in Hyderabad
pipeline
• 0.4m sqft in Chennai
• 2.3m sqft from CapitaLand
Sponsor assets
• Ascendas India Growth Programme
Growth • 1.2m sqft aVance Hyderabad
strategy 3rd
party
• 2.1m sqft aVance Business Hub 2
• 1.4m sqft AURUM IT SEZ
acquisitions
• 1.8m sqft BlueRidge 3
• 1.7m sqft IT park at Hebbal
• 2.8m sqft2 Arshiya Panvel warehouses
Logistics / • 3.9m sqft Arshiya Khurja warehouses
Industrial • Ascendas-Firstspace platform
• 0.4m sqft Industrial facility at Mahindra World City
1. Includes additional development potential of 0.7m sqft due to revised building height approvals.
2. Includes a 7th warehouse under construction (0.3m sqft).
21Outlook
International Tech Park BangaloreGrowth based on committed pipeline
Floor area
(million sqft) 24.9
1.7
73% 0.4
0.2
1.8 0.3
2.1
1.2
1.4
14.4 1.4
14.4
Mar-21 Growth pipeline
Portfolio ITPH redevelopment - Phase I
AURUM IT SEZ aVance 5
aVance A1 & A2 BlueRidge 3 - Phase 1 & 2
Arshiya Panvel Arshiya Khurja 23
Industrial facility at Mahindra World City (MHC) IT park at HebbalGrowth Pipeline
Industrial
aVance Arshiya Arshiya
aVance Business Hub 2 AURUM IT SEZ BlueRidge 3 IT park at Hebbal Facility at
Hyderabad Panvel Khurja
MHC TOTAL
7th
aVance 5 aVance A1 aVance A2 Building 1 Building 2 Phase 1 Phase 2 Project I Project II 1 warehouse Phase 1
warehouse
Floor area 1.16 1.05 1.05 0.60 0.80 1.41 0.43 1.26 0.39 0.33 0.19 0.42 9.09
(mil sqft)
Time of 2H Development timelines OC4 1H 2H 2H 2H 2024 2H 2024 1H Upon 2H 2021 N.A.
completion1 2021 to be finalised received 2021 2021 2023 2021 completion
of CP4
Expected total ₹8.4b ₹14.0b ₹9.3b ₹9.8b ₹11.2b ₹3.2b ₹2.1b5 ₹1.0b5 ₹2.1b ₹61.1b
consideration2 (S$168m) (S$278m) (S$186m) (S$194m) (S$209m) (S$59m) (S$42m) (S$19m) (S$38m) (S$1,193m)
Amount ₹4.0b ₹0.5b3 ₹4.6b ₹3.9b - - ₹0.7b - ₹1.0b ₹14.7b
disbursed2 (S$80m) (S$10m) (S$91m) (S$77m) (S$14m) (S$19m) (S$291m)
Remaining ₹4.4b ₹13.5b ₹4.7b ₹5.9b ₹11.2b ₹3.2b ₹1.4b ₹1.0b ₹1.1b6 ₹46.4b
commitment2 (S$88m) (S$268m) (S$95m) (S$117m) (S$209m) (S$59m) (S$28m) (S$19m) (S$19m) (S$902m)
All information as at 31 March 2021
1. Refers to building completion. For Arshiya Khurja, completion refers to the acquisition of 1 Grade-A warehouse.
2. Based on exchange rate at the time of investment/announcement.
3. Excludes disbursement of ₹2.0 billion (S$39 million2) towards refinancing of loan taken by PVPL towards acquisition of additional land in aVance Business Hub 2.
4. OC refers to occupancy certificate; CP refers to Conditions Precedent.
5. Net consideration after deduction of security deposit.
6. Funding for 0.02 mil sqft in phase 2 (where a letter of intent has been signed with a tenant) will commence once certain conditions precedent have been met. 24Appendix
Glossary
Trust properties : Total assets.
Derivative financial : Includes cross currency swaps (entered to hedge SGD borrowings into INR), interest rate swaps, options and
instruments forward foreign exchange contracts.
DPU : Distribution per unit.
EBITDA : Earnings before interest expense, tax, depreciation & amortisation (excluding gains/losses from foreign
exchange translation and mark-to-market revaluation from settlement of loans).
Effective borrowings : Calculated by adding/(deducting) derivative financial instruments liabilities/(assets) to/from gross borrowings,
including deferred consideration.
Gearing : Ratio of effective borrowings to the value of Trust properties.
ITES : Information Technology Enabled Services.
INR or ₹ : Indian rupees.
SEZ : Special Economic Zone.
SGD or S$ : Singapore dollars.
Super Built-up Area or SBA : Sum of the floor area enclosed within the walls, the area occupied by the walls, and the common areas such
as the lobbies, lift shafts, toilets and staircases of that property, and in respect of which rent is payable.
25Half-yearly DPU since listing
INR/SGD exchange rate2
DPU1 (S¢) (Indexed)
Change since listing
10.00 INR depreciation against SGD: -52% 130
SGD DPU3: +61%
9.00 120
8.00 110
7.00
100
6.00
90
5.00
80
4.00
70
3.00
60
2.00
1.00 50
0.00 40
CY2007 CY2008 CY2009 CY2010 CY2011 CY2012 CY2013 CY2014 CY2015 CY2016 CY2017 CY2018 CY2019 CY2020
1H 2H INR/SGD exchange rate
1. DPU (income available for distribution) refers to 100% of distributable income. 10% of distributable income was retained starting from 2Q CY2012.
2. Average daily spot INR/SGD exchange rate for the period, pegged to 1 August 2007 using data sourced from Bloomberg. 26
3. Last 12 months DPU compared against first 12 months DPU.Growth strategy
Development: ITPB pipeline
Remaining development potential of 3.1 million sqft.
Anchor
Park Square (Multi-tenanted
(Mall) building)
Taj Vivanta
(Hotel)
Victor
(Multi-tenanted
Special Economic Zone1 building)
Aviator
(Multi-tenanted building)
Voyager Endeavour
(Multi-tenanted building) (Multi-tenanted building)
1. Red line marks border of SEZ area.
27Growth strategy
Development: ITPH redevelopment
Existing Master Plan (1.5m sqft) Proposed Master Plan (5.7m sqft)
MLCP
BLOCK E
Capella
Vega BLOCK D
Atria Atria
Phase I Phase I
BLOCK C
BLOCK B
Orion BLOCK A
Auditorium Auriga Mariner
Key Highlights
Redevelopment to increase the development potential, rejuvenate the existing park, and leverage strong demand
in Hyderabad:
• Net increase of 4.2m sqft of leasable area
• Development planned in multiple phases over the next 7 to 10 years
• Construction for Phase I has commenced and superstructure work is in progress
28Growth strategy
Development: ITPH redevelopment – Phase I
Artist’s impression
Name International Tech Park Hyderabad (ITPH) redevelopment – Phase I
Floor area 1.36m sqft
• Superstructure work has commenced.
Development status
• Completion expected by 2H 2022.
29Growth strategy
Sponsor: Assets in India
Sponsor presence1 International Tech Park, Pune
• All 4 phases of construction comprising 2.3
million sqft is completed and fully leased.
Gurgaon
Pune
Chennai
Private funds managed by sponsor
• Ascendas India Growth Programme
• Ascendas India Logistics Programme
1. Excludes a-iTrust properties.
30Growth strategy
3rd party: Acquisition criteria for commercial space
• Target cities:
• Bangalore
• Chennai
• Hyderabad
• Pune
• Mumbai
• Delhi
• Gurgaon
• Investment criteria:
• Location
• Tenancy profile
• Design
• Clean land title and land tenure
• Rental and capital growth prospects
• Opportunity to add value
31Growth strategy
3rd party: aVance Hyderabad
(5)
(3)
(6)
(8) (4) (7)
(2)
(5) (1)
(9)
Artist’s impression
(10)
(6)
Site area 25.7 acres / 10.4 ha
a-iTrust assets – marked in blue; Vendor assets – marked in black; Land owner assets –
Asset ownership
marked in white; a-iTrust has ROFR to (7), (8), (9) & (10)
Proposed acquisition of (5)1 – 1.16m sqft
• 100% pre-committed to a leading US-based healthcare MNC
aVance 5
• Completion expected by 2H 2021
• Construction of office floors completed, façade works/finishes in progress
1. Share Purchase Agreement executed for proposed acquisition of aVance 5. 32Growth strategy
3rd party: aVance Business Hub 2, Hyderabad
aVance
(6)
Hyderabad (7) (A1)
Artist’s impression
(A2) (A3) (A4) (A5)
Indicative plan Artist’s impression
Park Statistics
Proposed acquisition of
Site area: 14.4 acres / 5.8 ha
(A1) to (A5)1: 4.53m sqft
Construction status: Excavation work commenced
Vendor assets: marked in black
for the project
Land owner assets: marked in white
1. Master Agreement executed for proposed acquisition of Vendor assets. The total leasable area has been reduced from 5.20m sqft to 4.53m sqft due to changes in 33
the Master Plan.Growth strategy
3rd party: AURUM IT SEZ, Navi Mumbai
(3) (2)
(1)
Artist’s impression
Location Ghansoli, Navi Mumbai
• Building 1: 0.6m sqft; Building 2: 0.8m sqft
Floor area
• Right of First Refusal on Building 3: up to 1.1m sqft
Expected completion • Building 1 - Occupancy Certificate received; Building 2 - 1H 2021
Leasing status • Building 1: 56% pre-committed
Acquisition of
Upon completion of each building, and within a period of up to 2 years post completion.
Building 1 & 2
34Growth strategy
3rd party: BlueRidge 3, Pune
Artist’s impression
Location Hinjawadi Phase 1, Pune
Floor area Phase 1: 1.4m sqft; Phase 2: 0.4m sqft
Expected completion Phase 1: 2H 2021; Phase 2: 2H 2023
Leasing Status Phase 1: 14% pre-committed for long-term space
Construction of office floors 9 to 11 in IT Building 1 is in progress.
Construction status
Construction of cafeteria block is in progress.
35Growth strategy
3rd party: IT Park at Hebbal, Bangalore
Artist’s impression
Location Hebbal, Bangalore
Floor area Project I: 1.3m sqft; Project II: 0.4m sqft
Expected completion Project I & II: 2H 2024
Construction status Ground clearing and excavation works initiated.
36Growth strategy
Logistics: Arshiya Panvel warehouses, Mumbai
Location Panvel, near Mumbai
Site area 24.5 acres / 9.9 ha
Floor area 0.8m sqft
Forward purchase At least 2.8m sqft (includes 0.3m sqft warehouse under construction)
37Growth strategy
Logistics: Arshiya Khurja warehouse, NCR
Location Khurja, NCR
Site area 4.5 acres / 1.8 ha
Floor area 0.19m sqft1
Proposed acquisition 3.85m sqft
1. Acquisition of the warehouse subject to completion of certain Conditions Precedent as specified in the Share Purchase Agreement. 38Growth strategy
Industrial: Facility at Mahindra World City,
Chennai – Phase 1
Artist’s impression
Location Mahindra World City, Chennai
Floor area 0.42m sqft1
Expected completion 2H 2021
Construction of the facility is in progress.
Construction status
Tenant fit-out works have commenced.
Leasing status Fully pre-leased to Pegatron, a leading Taiwanese contract electronics manufacturer.
1. Excludes 0.02 mil sqft in phase 2 where a letter of intent has been signed with a tenant. 39World-class IT and logistics parks
City Bangalore Chennai Hyderabad Pune Mumbai
• Intl Tech Park • Intl Tech Park • Intl Tech Park • aVance Pune • Arshiya Panvel
Property Bangalore Chennai Hyderabad warehouses
• CyberVale • CyberPearl
• aVance Hyderabad
Type IT Park IT Park IT Park IT Park Warehouse
68.3 acres 33.2 acres 51.2 acres1 5.4 acres 24.5 acres
Site area
27.6 ha 13.5 ha 20.5 ha1 2.2 ha 9.9 ha
Completed floor
5.2m sqft2 2.8m sqft 4.0m sqft2 1.5m sqft 0.8m sqft
area
Number of
12 6 12 3 6
buildings
Park population 48,700 30,600 30,4003 13,100 -
Land bank
(development 3.1m sqft 0.4m sqft 4.2m sqft4 - -
potential)
1. Includes land not held by a-iTrust.
2. Only includes floor area owned by a-iTrust.
3. Excludes aVance 6.
4. Includes buildings under construction and additional development potential due to revised building height approvals. 40Lease expiry profile by base rental
FY2025
City FY2021 FY2022 FY2023 FY2024 Total
& beyond
Bangalore 5.8% 5.6% 1.5% 5.3% 17.2% 35.4%
Hyderabad 3.5% 10.8% 5.2% 2.3% 7.2% 29.0%
Chennai 5.8% 6.0% 3.9% 1.3% 2.1% 19.1%
Pune 0.0% 0.4% 0.4% 0.2% 8.3% 9.3%
Mumbai 0.0% 0.0% 0.0% 7.1% 0.0% 7.1%
Total 15.2% 22.9% 11.0% 16.2% 34.7% 100.0%
41Revenue growth trends
Total Property Income (INR) Total Property Income (SGD)
10% 5%
INR million
CAGR S$ million CAGR
10,250
10,188
9,336 197.6
191.7
8,626 183.0 184.0
7,220
141.1 148.4
6,579 129.9
6,124 127.3
5,550 121.3 124.4 119.8
5,584
4,658
4,078
42Income growth trends
Net Property Income (INR) Net Property Income (SGD)
13% 8%
INR million
CAGR S$ million CAGR
7,910 148.6 147.9
7,668
133.8
6,791
123.6
5,827
98.4
4,790 91.1
4,249
74.9 75.9
3,654 71.1 70.1 69.8
3,197 3,260
2,628
2,391
43a-iTrust unit price versus major indices
(Indexed) Indicator
175 Trading yield
a-iTrust 6.0%1
(as at 31 March 2021)
FTSE STI Index
150 Average daily trading
FTSE ST REIT Index 2,669,300 units
volume (YTD FY2021)
Bombay SE Realty Index a-iTrust
125
INR/SGD FX rate
100
FTSE STI Index
FTSE ST REIT Index
75
50 INRSGD FX Rate
Bombay
25 SE Realty
Index
0
Dec 12
Dec 18
Dec 07
Dec 08
Dec 09
Dec 10
Dec 11
Dec 13
Dec 14
Dec 15
Dec 16
Dec 17
Dec 19
Dec 20
Jun 13
Jun 19
Jun 08
Jun 09
Jun 10
Jun 11
Jun 12
Jun 14
Jun 15
Jun 16
Jun 17
Jun 18
Jun 20
IPO
Mar 21
Source: Bloomberg
1. Trading yield based on FY2020 DPU of 8.83 cents at closing price of S$1.48 per unit as at 31 March 2021. 44Structure of Ascendas India Trust
Unitholders
Holding of units Distributions
Trustee’s fee & management fees
Ascendas Property Fund Trustee Pte. Ltd.
a-iTrust (the Trustee-Manager), a wholly owned subsidiary of
Acts on behalf of unitholders/ CapitaLand
Dividends, principal management services
100% ownership &
shareholder’s loan repayment
of shareholder’s loan
Singapore SPVs
1. Ascendas Property Fund (India) Pte. Ltd.
2. Ascendas Property Fund (FDI) Pte. Ltd.
Ownership of ordinary shares; Subscription to Fully &
Compulsory Convertible Debentures (“FCCD”) and Dividends on ordinary shares, proceeds from share buyback
Non-Convertible Debentures (“NCD”) & interest on FCCD and NCD Singapore
The VCUs India
• Ascendas Panvel FTWZ • Information Technology Park Limited (92.8% ownership)2
Limited1 • Ascendas Information Technology Park Chennai Ltd. (89.0% ownership)2
(100.0% ownership) • Cyber Pearl Information Technology Park Private Limited (100.0% ownership)
• VITP Private Limited (100.0% ownership)
• Hyderabad Infratech Private Limited (100.0% ownership)
• Avance-Atlas Infratech Private Limited (100.0% ownership)
• Deccan Real Ventures Private Limited (100.0% ownership)
• Phoenix IT Infrastructure India Private Limited (95.0% ownership)3
Ownership Master rental income Ownership Net property income
The Properties Provides property
• Arshiya Panvel warehouses • ITPB • ITPH management services Ascendas Services
• ITPC • aVance Hyderabad (India) Private Limited
• CV • aVance Pune (the property manager)
• CP Property management fees
1. Entered into a master lease agreement with Arshiya Limited (“AL”) to lease back the warehouses to AL for a period of six years. AL will operate and manage the warehouses and pay pre-
agreed rentals.
2. Karnataka State Government owns 7.2% of ITPB & Tamil Nadu State Government owns 11.0% of ITPC. 45
3. Remaining 5.0% in PIIIPL is owned by the Phoenix Group currently and will be acquired by a-iTrust at a later date.Investor contact Tan Choon Siang Chief Financial Officer Ascendas Property Fund Trustee Pte Ltd (Trustee-Manager of a-iTrust) Office: +65 6713 2888 Email: choonsiang.tan@a-iTrust.com Website: www.a-iTrust.com
You can also read