Ascendas India Trust
1Q FY2020 Business Updates
27 April 2020
←
→
Page content transcription
If your browser does not render page correctly, please read the page content below
Ascendas India Trust 1Q FY2020 Business Updates 27 April 2020
Disclaimer
This presentation may contain forward-looking statements. Actual future performance, outcomes and results may differ materially from those
expressed in forward-looking statements as a result of a number of risks, uncertainties and assumptions. Representative examples of these
factors include (without limitation) general industry and economic conditions, interest rate trends, cost of capital and capital availability,
availability of real estate properties, competition from other developments or companies, shifts in customer demands, shifts in expected
levels of occupancy rate, property rental income, charge out collections, changes in operating expenses (including employee wages,
benefits and training, property operating expenses), governmental and public policy changes and the continued availability of financing in
the amounts and the terms necessary to support future business.
You are cautioned not to place undue reliance on these forward-looking statements, which are based on the current view of management
regarding future events. No representation or warranty expressed or implied is made as to, and no reliance should be placed on, the
fairness, accuracy, completeness or correctness of the information or opinions contained in this presentation. Neither Ascendas Property
Fund Trustee Pte. Ltd. (“Trustee-Manager”) nor any of its affiliates, advisers or representatives shall have any liability whatsoever (in
negligence or otherwise) for any loss howsoever arising, whether directly or indirectly, from any use, reliance or distribution of this
presentation or its contents or otherwise arising in connection with this presentation.
The past performance of Ascendas India Trust (“a-iTrust”) is not indicative of future performance. The listing of the units in a-iTrust (“Units”) on
the Singapore Exchange Securities Trading Limited (the “SGX-ST”) does not guarantee a liquid market for the Units. The value of the Units and
the income derived from them may fall as well as rise. Units are not obligations of, deposits in, or guaranteed by, the Trustee-Manager. An
investment in the Units is subject to investment risks, including the possible loss of the principal amount invested. Investors have no right to
request that the Trustee-Manager redeem or purchase their Units while the Units are listed on the SGX-ST. It is intended that holders of Units
may only deal in their Units through trading on the SGX-ST.
This presentation for information only and does not constitute an invitation or offer to acquire, purchase or subscribe for the Units.

All measurements of floor area are defined herein as “Super Built-up Area” or “SBA”, which is the sum of the floor area enclosed within the
walls, the area occupied by the walls, and the common areas such as the lobbies, lift shafts, toilets and staircases of that property, and in
respect of which rent is payable.
The Indian Rupee and Singapore Dollar are defined herein as “INR/₹” and “SGD/S$” respectively.
Any discrepancy between individual amounts and total shown in this presentation is due to rounding.                                                    2
Notice: Change to Half-yearly Reporting

Ascendas Property Fund Trustee Pte. Ltd. (the “Trustee-Manager”), as trustee-manager of a-
iTrust, refers to the recent amendments to Rule 705(2) of the Listing Manual of the Singapore
Exchange Securities Trading Limited which were effective from 7 February 2020.
The Trustee-Manager announced on 26 February 2020 that a-iTrust will adopt the
announcement of half-yearly financial statements with effect from the financial year ending
31 December 2020 (“FY2020”). For FY2020, the next financial results announcement will be for
the half-year period ending 30 June 2020.
The Trustee-Manager will continue its proactive engagement with stakeholders through its
various communication channels, including providing relevant business updates between
the announcements of half-yearly financial statements.

                                                                                                3
1Q FY2020
Business Updates

                   International Tech Park Bangalore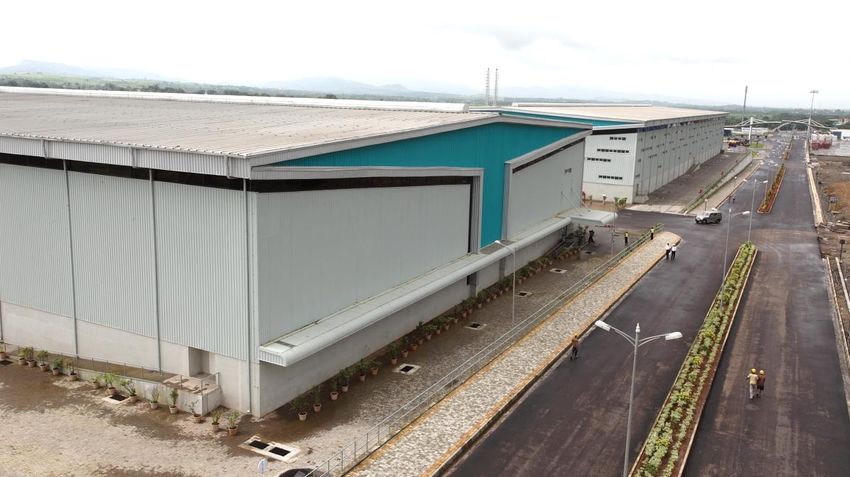
COVID-19 in India
                                                                      Geographical spread of COVID-19 cases in India
• First COVID-19 case reported in end January.

• Entire country was put under a 21-day lockdown
  from 25 March to avert massive outbreak. The
  nationwide lockdown, which was due to end on 14
  April, was subsequently extended to 3 May.

• Only essential services in operation.

• All public transport shut down, movement of private
  vehicles banned and all domestic and international
  flights grounded.
                                                            Mumbai
• Modest relaxation of restrictions on agricultural,        (Panvel)                                                      Pune
  banking, courier services and public works from 20
  April onwards to ease supply chain and alleviate
  economic impact, except in virus hotspots.                                                                Hyderabad
                                                               Bangalore
• The lockdown appears to have reduced the rate of
                                                                                                                          Chennai
  increase of the virus infection in many parts of the
  country.
                                                                                                                                           5
                                                         Source: Ministry of Health and Family Welfare India; India Today. Data as of 26 April 2020.
                                                         Circles represent COVID-19 death tolls.
Impact of COVID-19
Safeguarding the health and safety of all staff, tenants and parkites in our properties remains our
highest priority. We are closely monitoring the evolving situation and will take appropriate actions
to protect our tenants’ premises and their employees.
     Current Assessment of
                                                            Preparedness                                Current Operations
      Impact on Business
With the extension of the lockdown in India     Since February, all our parks had in place      •   With India’s country-wide lockdown, all
till 3 May 2020, we expect adverse impact       precautionary measures:                             staff and tenants are working from
on our business. The situation continues to                                                         home except for operation-critical roles
                                                •   intensifying cleaning and disinfecting of
evolve and due to the lockdown, there is            common areas                                •   Our parks remain open for essential
insufficient information available at this                                                          services to support a few tenants’
juncture to allow for the assessment (and       •   ensuring logistics readiness
                                                                                                    critical IT & ITES operations
disclosure) of the financial impact of Covid-       (temperature screening / masks /
19 with certainty.                                  sanitisers / travel declarations)           •   Closure of Park Square Mall and F&B
                                                                                                    outlets
                                                •   designated isolation rooms
The weak economic conditions brought
about by COVID-19 could reduce demand           •   raising staffs’ / tenants’ awareness
for office space, resulting in lower            •   activating regional and global response
occupancies, softening of rents and                 teams to provide around-the-clock               Power                    Food courts
potentially higher bad debt provisions. A           assistance                                      Airconditioning          Amenities
drop in interest income from forward                                                                Water
                                                Preparations for re-opening are underway            Housekeeping
purchases may be possible.
                                                and we plan to take necessary precautious           Security
                                                to ensure the safety of our parks and               Specialised sanitation team
The impact on our retail tenants at Park
                                                tenants. These measures can extend
Square Mall will be high due to the mall
                                                beyond the end of the lockdown period
closure since14 March 2020. Retail
                                                and will lead to higher operating expenses.
comprised 1.4% of net property income in
FY2019.
Logistics: Arshiya Khurja, NCR
Acquisition details
Property details                                                                                   Investment details

                                                                                                   Share Purchase Agreement1
                                                                                                   •   Acquisition of 1 Grade-A warehouse (0.19m sq ft)
                                                                                                   •   Upfront payment of ₹0.2 bn (S$5m2) and deferred
                                                                                                       consideration of up to ₹0.7 bn (S$14m2) to be paid
                                                                                                       over the next 4 years.

                                                                                                   Lease Arrangement
                                                                                                   •   Operating lease arrangement with an affiliate of the
                                                                                                       vendor to lease-back the warehouse for 6 years.

                                                                                                   Framework Agreement
 Location                                   Khurja, NCR
                                                                                                   •   Right to finance construction of future warehouses.
 Site area                                  4.5 acres/1.8 ha
                                                                                                   •   Right to acquire another 2 existing warehouses (0.30m
 Floor area                                 0.19m sq ft                                                sq ft) and future warehouses (approx. 3.55m sq ft).

 Right to acquire                           3.85m sq ft                                            Growing warehouse footprint in North India
                                                                                                   •   Transaction provides opportunity to expand our
                                                                                                       warehousing presence to North India and further
1.   Entered into with Arshiya Limited, the same vendor as Arshiya Panvel forward purchase deal.
     Acquisition is subject to fulfilment of certain Conditions Precedent.                             diversify business parks portfolio.
2.   Net of security deposit. Based on an exchange rate of S$1 to INR 51.3.                                                                                 7
Capital
management
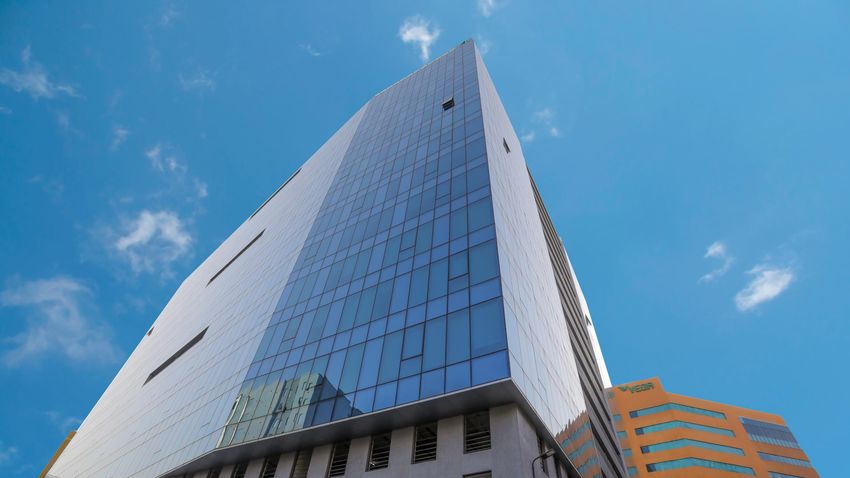
International Tech Park Hyderabad
Capital management
Currency hedging strategy                            Funding strategy
    Balance sheet                                    •   The Trustee-Manager’s approach to equity
                                                         raising is predicated on maintaining a strong
•   Trustee-Manager does not hedge equity.
                                                         balance sheet by keeping the Trust’s gearing
•   At least 50% of debt must be denominated in          ratio at an appropriate level.
    INR.                                             •   Trustee-Manager does not borrow INR loans
                                                         onshore in India as it costs less to hedge SGD
                                                         borrowings to INR-denominated borrowings
    Income                                               using cross-currency swaps and derivatives.

•   Income is repatriated semi-annually from India
    to Singapore.                                    Income distribution policy
•   Trustee-Manager locks in the income to be        •   To distribute at least 90% of its income available
    repatriated by buying forward contracts on a         for distribution.
    monthly basis.
                                                     •   a-iTrust retains 10% of its income available for
                                                         distribution to provide greater flexibility in
                                                         growing the Trust.

                                                                                                              9
Debt maturity profile
                                                           Hedging ratio
  Effective borrowings: S$751 million                      INR: 65% SGD: 35%

S$ Million
                                                                     236.3
             211.0 1                                                                              209.9

              60.2
                                                                     158.3

                                                                                                  165.9

             150.8
                                         45.5                                                                                  48.2
                                                                      78.0
                                         45.5                                                      43.9                        48.2

             FY2020                     FY2021                       FY2022                      FY2023                       FY2024

        SGD Denominated debt                    INR Denominated debt

Information as at 31 March 2020.
1. Secured a new and undrawn committed 5-year S$100mil Term Loan facility in April 2020 and in the process of closing a 4-year S$50 million Term Loan   10
   facility, which may be used for the refinancing of some loans maturing in FY2020.
Capital structure
Indicator As at 31 March 2020
Interest service coverage 4.0 times
(EBITDA/Interest expenses) (YTD FY2020)
Percentage of fixed rate debt 81%
Percentage of unsecured borrowings 100%
Gearing: 28%3
Effective weighted average cost of debt1 5.9%
Gearing limit 50%2
Available debt headroom S$1,214 million
Cash and cash equivalent S$121 million
1. Based on borrowing ratio of 65% in INR and 35% in SGD as at 31 March 2020.
2. As announced by MAS on 16 April 2020, the gearing limit was increased from 45% to 50% with immediate effect.
3. As at 31 March 2020, the effective borrowings to net asset ratio and total borrowings less cash and cash equivalent to net asset ratio is 53.0% and 46.6% respectively. 11Operational review
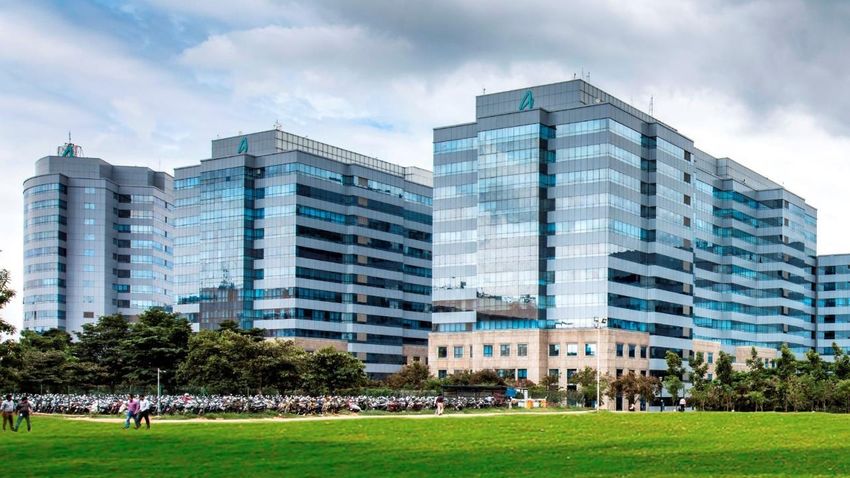
International Tech Park HyderabadOffice markets healthy
Bangalore (Whitefield) Hyderabad (IT Corridor I2)
5.0 4.0
12.0%
4.0 9.7% 8.8%
8.9% 3.0
7.2%
3.0
2.0
2.0 6.2%
5.7% 1
4.7%
1.0 3.0% 2.6%
1.0
0.0 0.0
CY 2016 CY 2017 CY 2018 CY 2019 CY2020 CY 2016 CY 2017 CY 2018 CY 2019 CY2020
Chennai (OMR) Pune (Hinjawadi)
3.0 2.0
9.0%
2.0 15.2%
5.9%
5.8%
1.0 9.9%
3.3% 8.6%
3.3% 6.0% 6.3%
1.0
0.0 0.0
CY 2016 CY 2017 CY 2018 CY 2019 CY2020 CY 2016 CY 2017 CY 2018 CY 2019 CY2020
Supply (in million sq ft) Gross Absorption (in million sq ft) Vacancy (%)
Source: CBRE Research
1. Higher vacancy is due to supply of 0.3m sq ft into the micro-market in 2020. 13
2. Includes HITEC City and Madhapur.Diversified portfolio
Portfolio breakdown by area Customer Base
Mumbai
6% Total number of tenants 340
Pune Average space per tenant 37,800 sq ft
12%
Bangalore
34%
Largest tenant accounts for
Chennai 9% of the portfolio base rent
22%
Hyderabad
26%
Floor area 13.1 million sq ft
All information as at 31 March 2020. 14Healthy portfolio occupancy
Committed portfolio occupancy: 99%
99% 100% 98% 100% 100% 100%
98% 98%
96% 95% 95% 95%
94%
91% 90%
1
ITPB ITPC CyberVale aVance CyberPearl ITPH aVance Arshiya
Hyderabad Pune Panvel
a-iTrust occupancy Market occupancy of peripheral area2
All information as at 31 March 2020.
1. There are no comparable warehouses in the micro-market that the Arshiya Panvel warehouses are located in.
2. CBRE market report as at 31 March 2020. 15Transacted vs effective rents1
Bangalore Chennai Hyderabad
40%
36%
35%
30% 28%
25% 23%
20% 18%
15%
15%
11%
10%
5%
0%
0%
ITPB ITPC CyberVale aVance ITPH CyberPearl aVance P
Hyderabad
All information as at 31 March 2020.
1. Difference in average transacted rents by a-iTrust over the past 12 months against effective rents at the respective properties.
2. Effective rent refers to the weighted average amortised rent for the respective properties for the last month of the reporting period.
3. Average transacted rent refers to the weighted average signing rents for the respective properties for the past 12 months. 16Spread-out lease expiry profile
Weighted average lease term: Weighted average lease expiry:
6.6 years 3.6 years
Sq ft expiring
5,500,000 41%
5,000,000
4,500,000
4,000,000
3,500,000
3,000,000 23%
2,500,000 17%
2,000,000 12%
1,500,000
7%
1,000,000
500,000
-
FY2020 FY2021 FY2022 FY2023 FY2024 & beyond
All information as at 31 March 2020.
Note: Retention rate for the period 1 April 2019 to 31 March 2020 was 65%. This excludes leases in ITPH which are affected by the redevelopment of Auriga building. 17Diversified tenant base
Tenant core business & activity by base rental
1
Telco Oil & Gas F&B
Retail 1% 1% 1
Others
Others 2% R&D
2% Retail & F&B 1%
3% 1 1%
ITES 3%
Healthcare & IT, Software & Application
Development and Service Support 5%
Pharma
3% 51%
Logistics &
warehousing
Automobile 7%
5%
Electronics,
1
Semiconductor & IT
Engineering 48%
7%
Tenant core Tenant core
Logistics
business activity
7%
Design, Gaming
and Media
7%
1
IT/ITES
Banking & Financial Services 35%
11%
All information as at 31 March 2020.
18
1. IT - Information Technology; ITES - Information Technology Enabled Services; R&D - Research & Development; F&B - Food & Beverage.Diversified tenant base
Tenant country of origin & company structure by base rental
Singapore UK Others
2% 1% 4%
Japan
2% India Co 2
14%
USA
France
56%
7%
Country of Company
origin structure
India 1
28%
3
MNC
86%
All information as at 31 March 2020.
1. Comprises Indian companies with local and overseas operations.
2. Comprises Indian companies with local operations only. 19
3. Multinational corporations, including Indian companies with local and overseas operations.Growth strategy
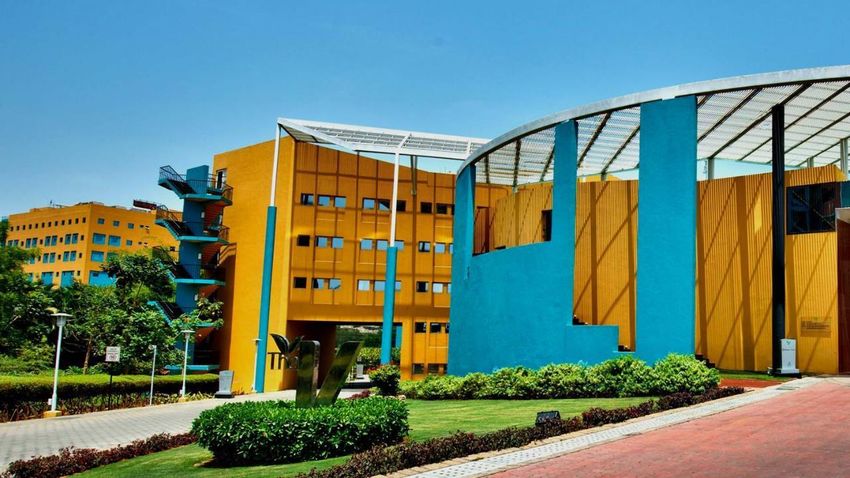
International Tech Park ChennaiGood growth track record
Total developments: Total acquisitions:
5.0 million sq ft 4.8 million sq ft
11%
Floor area CAGR
(million square feet)
13.1
12.6 1
11.9 0.5
0.8
1.9
9.7
0.4
8.8 0.3
0.6
7.5 1.3
6.9 6.9
6.5 0.6
6.0 0.4
0.5 12.6
11.9
4.7 4.8 4.8 1.2
0.1 9.7
3.6 1.1 8.8
6.9 6.9 7.5
6.0 6.5
4.7 4.8 4.8
3.6 3.6
IPO Dec-07 Dec-08 Dec-09 Dec-10 Dec-11 Dec-12 Dec-13 Dec-14 Dec-15 Dec-16 Dec-17 Dec-18 Dec-19
Portfolio Development Acquisition
1. Reduction in floor area due to the demolition of Auriga building (0.2m sq ft) in ITPH as part of the redevelopment. 21Clear growth strategy
• 3.8m sq ft1 in Bangalore
Development
pipeline • 3.5m sq ft in Hyderabad
• 0.4m sq ft in Chennai
• 2.3m sq ft from CapitaLand
Sponsor
• Ascendas India Growth Programme
assets
Growth
strategy
• 1.8m sq ft aVance Hyderabad
3rd party • 2.1m sq ft aVance Business Hub 2
acquisitions
• 1.4m sq ft AURUM IT SEZ
• 1.8m sq ft BlueRidge 3
• 2.8m sq ft2 Arshiya Panvel warehouses
Logistics • 3.9m sq ft3 Arshiya Khurja warehouses
• Ascendas-Firstspace platform
1. Includes buildings under construction and additional development potential of 1.0m sq ft due to the widening of the road in front of International Tech Park
Bangalore and 1.1m sq ft due to revised government regulation.
2. Includes a 7th warehouse under construction (0.3 million sq ft). 22
3. Includes a warehouse to be acquired upon completion of Conditions Precedent (0.2m sq ft).Outlook
International Tech Park BangaloreGrowth based on committed pipeline
Floor area
(million square feet)
22.8
0.2
74% 0.3
1.8
2.1
1.8
1.4
13.1 1.4
0.7
13.1
Mar-20 Growth pipeline
Portfolio MTB 5 ITPH redevelopment - Phase I
AURUM IT SEZ aVance 5 & 6 aVance A1 & A2
24
BlueRidge 3 - Phase 1 & 2 Arshiya Panvel Arshiya KhurjaGrowth Pipeline
aVance Hyderabad aVance Business Hub 2 AURUM IT SEZ BlueRidge 3 Arshiya Panvel Arshiya Khurja
TOTAL
aVance 5 aVance 6 aVance A1 aVance A2 Building 1 Building 2 Phase 1 Phase 2 7th warehouse 1 warehouse
Floor area 1.16 0.64 1.05 1.05 0.60 0.80 1.41 0.43 0.33 0.19 7.66
(mil sq ft)
Time of 1H Dec 2H 2H OC5 2H 1H 2H 2H Upon N.A.
Completion1 2021 20173 2023 2023 received 2020 2021 2023 2020 completion of
CP5
Expected total ₹13.5b ₹14.0b ₹9.3b ₹9.8b ₹2.1b6 ₹1.0b6 ₹49.7b
consideration2 (S$270m) (S$278m) (S$186m) (S$194m) (S$42m) (S19m) (S$987m)
Amount disbursed2 ₹8.4b ₹0.5b4 ₹4.0b ₹1.8b ₹0.2b - ₹14.8b
(S$168m) (S$10m) (S$79m) (S$36m) (S$3m) (S$295m)
Remaining ₹5.1b ₹13.5b ₹5.3b ₹8.0b ₹1.9b ₹1.0b ₹34.9b
commitment2 (S$102m) (S$268m) (S$107m) (S$159m) (S$38m) (S19m) (S$692m)
1. Refers to building completion. For Arshiya Khurja, completion refers to the acquisition of 1 Grade-A warehouse.
2. Based on exchange rate at the time of investment/announcement.
3. Based on existing investment structure, aVance 6 will be acquired together with aVance 5.
4. Excludes disbursement of ₹2.0 billion (S$39 million2) towards refinancing of loan taken by PVPL towards acquisition of additional land in aVance Business Hub 2.
25
5. OC refers to occupancy certificate; CP refers to Conditions Precedent.
6. Net consideration after deduction of security deposit.Appendix
Glossary
Trust properties : Total assets.
Derivative financial : Includes cross currency swaps (entered to hedge SGD borrowings into INR), interest rate swaps, options and
instruments forward foreign exchange contracts.
DPU : Distribution per unit.
EBITDA : Earnings before interest expense, tax, depreciation & amortisation (excluding gains/losses from foreign
exchange translation and mark-to-market revaluation from settlement of loans).
Effective borrowings : Calculated by adding/(deducting) derivative financial instruments liabilities/(assets) to/from gross borrowings,
including deferred consideration.
Gearing : Ratio of effective borrowings to the value of Trust properties.
ITES : Information Technology Enabled Services.
INR or ₹ : Indian rupees.
MAS : Monetary Authority of Singapore.
SEZ : Special Economic Zone.
SGD or S$ : Singapore dollars.
Super Built-up Area or SBA : Sum of the floor area enclosed within the walls, the area occupied by the walls, and the common areas such
as the lobbies, lift shafts, toilets and staircases of that property, and in respect of which rent is payable.
26Average currency exchange rate
Average exchange rates used to translate a-iTrust’s INR income statement to SGD
1 Singapore Dollar buys 1Q 2Q 3Q YTD
Indian Rupee
FY2019 51.2 51.5 51.5 51.4
FY18/19 50.2 51.3 52.5 51.3
SGD appreciation/
2.0% 0.4% (1.9%) 0.2%
(depreciation)
Note: These rates represent the average exchange rates between Indian Rupee & Singapore Dollar for the respective periods.
27Recap: FY2019 vs YTD FY18/19 results
FY20191 YTD FY18/191 Variance
SGD/INR FX rate2 51.4 51.3 0.2% • Income from Anchor building at ITPB;
• higher income from aVance Pune; and
₹7,728m ₹6,930m 12% • positive rental reversions.
Total property income
S$150.3m S$134.7m 12%
• Increase due to higher total property
income;
₹5,827m ₹5,159m 13% • one-off provision for water supply and
Net property income
S$113.4m S$100.4m 13%4 sanitary connection charges in ITPB in
YTD FY18/19; and
• partially offset gains from one-off scrap
₹3,881m ₹3,334m 16%
Income available for distribution sale of Dedicated Power Plant in ITPB in
S$75.5m S$64.9m 16% YTD FY18/194.
₹3,493m ₹3,001m 16% • Mainly due to net property income
Income to be distributed growth and interest income from
S$67.9m S$58.4m 16%
investments in Arshiya Panvel, AURUM IT
SEZ, aVance 5 & 6, aVance A1 & A2 and
₹3.32 ₹2.89 15% BlueRidge 3.
Income to be distributed (DPU3)
6.45¢ 5.63¢ 15%
• After retaining 10% of income available
for distribution.
Weighted average number of units
1,054,828 1,036,361 2%
(‘000)
1. FY2019 refers to the 9-month period ended 31 December 2019. YTD FY18/19 refers to the 9-month period ended 31 December 2018.
2. Average exchange rate for the period.
3. Distribution per unit. 28
4. Excluding the one-off items, FY2019 net property income in SGD would have increased by 11%.Quarterly DPU since listing
INR/SGD exchange rate2
DPU1 (S¢)
Change since listing (Indexed)
10.00 INR depreciation against SGD: -50% 130
SGD DPU3: +49%
9.00 120
8.00 110
7.00
100
6.00
90
5.00
80
4.00
70
3.00
60
2.00
1.00 50
0.00 40
CY2007 CY2008 CY2009 CY2010 CY2011 CY2012 CY2013 CY2014 CY2015 CY2016 CY2017 CY2018 CY2019
1Q 2Q 3Q 4Q INR/SGD exchange rate
1. DPU (income available for distribution) refers to 100% of distributable income. 10% of distributable income was retained starting from 2Q CY2012.
2. Average daily spot INR/SGD exchange rate for the period, pegged to 1 August 2007 using data sourced from Bloomberg. 29
3. Last 12 months DPU compared against first 12 months DPU.Growth strategy
Development: ITPB pipeline
Future development potential International Tech Park Bangalore
• Increase in development potential from 2.7
million sq ft to 3.8 million sq ft1.
• Construction of MTB 5 (0.7 million sq ft) is in
progress.
Anchor
Park Square (Multi-tenanted
(Mall) building)
Taj Vivanta
(Hotel)
Victor
(Multi-tenanted
Special Economic Zone2 building)
Aviator
(Multi-tenanted building)
MTB 5
Voyager
(Multi-tenanted building) (Under construction)
1. Includes buildings under construction and additional development potential due to the widening of the road in front of International Tech Park Bangalore
and revised government regulation. 30
2. Red line marks border of SEZ area.Growth strategy
Development: MTB 5, Bangalore
Artist’s impression
Property International Tech Park Bangalore
Floor area 0.68m sq ft
• Construction has commenced and structure works are ongoing
Construction status
• Completion expected by 2H 2020
Leasing status 100% pre-leased to a leading IT Services company 31Growth strategy
Development: ITPH redevelopment – Phase I
Artist’s impression
Name International Tech Park Hyderabad (ITPH) redevelopment – Phase I
Floor area 1.36m sq ft
• Excavation is in progress and foundation work has commenced
Development status
• Completion expected by 2H 2021 32Growth strategy
3rd party: Acquisition criteria for commercial space
• Target cities:
• Bangalore
• Chennai
• Hyderabad
• Pune
• Mumbai
• Delhi
• Gurgaon
• Investment criteria:
• Location
• Tenancy profile
• Design
• Clean land title and land tenure
• Rental and capital growth prospects
• Opportunity to add value
33Growth strategy
3rd party: aVance Hyderabad
(5)
(3)
(6)
(8) (4) (7)
(2)
(5) (1)
(9)
Artist’s impression
(10)
(6)
Park Statistics
Site area: 25.7 acres / 10.4 ha (1), (2), (3) & (4) owned by a-iTrust: 1.50m sq ft
Vendor assets: marked in black Proposed acquisitions of (5) & (6)1: 1.80m sq ft
Land owner assets: marked in white ROFR to (7), (8), (9) & (10): 1.16m sq ft
1. Share Purchase Agreement executed for proposed acquisition of aVance 5 & 6. 34Growth strategy
3rd party: aVance Business Hub 2, Hyderabad
aVance
(6)
Hyderabad (7) (A1)
Artist’s impression
(A2) (A3) (A4) (A5)
Artist’s impression
Park Statistics
Proposed acquisition of
Site area: 14.4 acres / 5.8 ha
(A1) to (A5)1: 4.53m sq ft
Construction status: Excavation work commenced
Vendor assets: marked in black
for the project
Land owner assets: marked in white
1. Master Agreement executed for proposed acquisition of Vendor assets. The total leasable area has been reduced from 5.20m sq ft to 4.53m sq ft due to changes in 35
the Master Plan.Growth strategy
3rd party: AURUM IT SEZ, Navi Mumbai
(3) (2)
(1)
Artist’s impression
Location Ghansoli, Navi Mumbai
• Building 1: 0.6m sq ft; Building 2: 0.8m sq ft
Floor area
• Right of First Refusal on Building 3: up to 1.1m sq ft
Expected completion • Building 1 - Occupancy Certificate received; Building 2 - 2H 2020
Leasing status • Building 1: 44% pre-committed
Acquisition of
Upon completion of each building, and within a period of up to 2 years post completion
Building 1 & 2
36Growth strategy
3rd party: BlueRidge 3, Pune
Location Hinjawadi Phase 1, Pune
Floor area Phase 1: 1.4m sq ft; Phase 2: 0.4m sq ft
Expected completion Phase 1: 1H 2021; Phase 2: 2H 2023
Incubation fit-out work in IT Building 1 is completed and Occupancy 37
Construction status
Certificate has been obtainedGrowth strategy
Logistics: Arshiya Panvel, Mumbai
Property Arshiya Panvel warehouses
Site area 24.5 acres / 9.9 ha
Floor area 0.8m sq ft
Forward purchase At least 2.8m sq ft (includes 0.3m sq ft warehouse under construction)
38World-class IT and logistics parks
City Bangalore Chennai Hyderabad Pune Mumbai
• Intl Tech Park • Intl Tech Park • Intl Tech Park • aVance Pune • Arshiya Panvel
Property Bangalore Chennai Hyderabad warehouses
• CyberVale • CyberPearl
• aVance Hyderabad
Type IT Park IT Park IT Park IT Park Warehouse
68.3 acres 33.2 acres 51.2 acres1 5.4 acres 24.5 acres
Site area
27.6 ha 13.5 ha 20.5 ha1 2.2 ha 9.9 ha
Completed floor
4.5m sq ft2 2.8m sq ft 3.4m sq ft2 1.5m sq ft 0.8m sq ft
area
Number of
11 6 11 3 6
buildings
Park population 49,600 35,400 31,600 13,800 -
Land bank
(development 3.8m sq ft3 0.4m sq ft 3.5m sq ft4 - -
potential)
1. Includes land not held by a-iTrust.
2. Only includes floor area owned by a-iTrust.
3. Includes buildings under construction and additional development potential due to the widening of the road in front of International Tech Park Bangalore and revised government
regulation. 39
4. Includes buildings under construction.Lease expiry profile
FY2024
City FY2020 FY2021 FY2022 FY2023 Total
& beyond
Bangalore 302,600 1,255,300 646,600 64,500 2,167,100 4,436,100
Chennai 655,400 884,900 678,300 259,500 315,200 2,793,300
Hyderabad 489,100 780,700 759,100 540,500 731,700 3,301,100
Pune 137,000 - 64,100 58,300 1,244,300 1,503,700
Mumbai - - - - 832,200 832,200
Total 1,584,100 2,920,900 2,148,100 922,800 5,290,500 12,866,400
40Quality tenants
Top 10 tenants (in alphabetical order) Top 5 sub-tenants of Arshiya Panvel
(in alphabetical order)
1 Applied Materials 1 DHL Logistics
2 Arshiya Panvel
2 Huawei Telecommunications
3 Bank of America
3 Labdhi Manufacturing
4 Cognizant
4 Rolex Logistics (CISCO)
5 Mu Sigma
5 ZTE Corporation
6 Renault Nissan
7 Societe Generale
8 Tata Consultancy Services
Top 10 tenants
9 The Bank of New York Mellon
accounted for 37% of
10 Technicolor
portfolio base rent
All information as at 31 March 2020.
41Revenue growth trends
Total Property Income (INR) Total Property Income (SGD)
10% 5%
INR million
CAGR S$ million CAGR
10,188
9,336 184.0 197.6
183.0
8,626
7,220 148.4
141.1
6,579 129.9
6,124 124.4 127.3
5,550 5,584 120.8 121.3 119.8
4,658
4,005 4,078
42Income growth trends
Net Property Income (INR) Net Property Income (SGD)
12% 7%
INR million
CAGR S$ million CAGR
148.6
7,668 133.8
6,791
123.6
5,827
98.4
4,790
91.1
4,249
74.3 74.9 75.9
3,654 71.1 70.1 69.8
3,197 3,260
2,628
2,460 2,391
43a-iTrust unit price versus major indices
(Indexed) Indicator
175 a-iTrust Trading yield
7.2%1
(as at 31 March 2020)
FTSE STI Index
150 FTSE ST REIT Index Average daily trading
2,110,100 units
volume (1Q FY2020)
Bombay SE Realty Index
125
INR/SGD FX rate
100
a-iTrust
75
FTSE ST REIT Index
FTSE STI Index
50 INRSGD FX Rate
25 Bombay
SE Realty
Index
0
IPO
Mar 20
Dec 07
Dec 08
Dec 09
Dec 10
Dec 11
Dec 12
Dec 13
Dec 14
Dec 15
Dec 16
Dec 17
Dec 18
Dec 19
Jun 08
Jun 09
Jun 10
Jun 11
Jun 12
Jun 13
Jun 14
Jun 15
Jun 16
Jun 17
Jun 18
Jun 19
Source: Bloomberg
1. Trading yield based on annualised 3Q FY2019 DPU of 8.60 cents at closing price of S$1.20 per unit as at 31 March 2020. 44Structure of Ascendas India Trust
Unitholders
Holding of units Distributions
Trustee’s fee & management fees
Ascendas Property Fund Trustee Pte. Ltd.
a-iTrust (the Trustee-Manager), a wholly owned subsidiary of
Acts on behalf of unitholders/ CapitaLand
Dividends, principal management services
100% ownership &
shareholder’s loan repayment
of shareholder’s loan
Singapore SPVs
1. Ascendas Property Fund (India) Pte. Ltd.
2. Ascendas Property Fund (FDI) Pte. Ltd.
Ownership of ordinary shares; Subscription to Fully &
Compulsory Convertible Debentures (“FCCD”) and Dividends on ordinary shares, proceeds from share buyback
Non-Convertible Debentures (“NCD”) & interest on FCCD and NCD Singapore
The VCUs India
• Ascendas Panvel FTWZ • Information Technology Park Limited (92.8% ownership)2
Limited1
(100.0% ownership) • Ascendas Information Technology Park Chennai Ltd. (89.0% ownership)2
• Cyber Pearl Information Technology Park Private Limited (100.0% ownership)
• VITP Private Limited (100.0% ownership)
• Hyderabad Infratech Private Limited (100.0% ownership)
• Avance-Atlas Infratech Private Limited (100.0% ownership)
• Deccan Real Ventures Private Limited (100.0% ownership)
Ownership Master rental income Ownership Net property income
The Properties Provides property
• Arshiya Panvel warehouses • ITPB • ITPH management services Ascendas Services
• ITPC • aVance Hyderabad (India) Private Limited
• CV • aVance Pune (the property manager)
• CP Property management fees
1. Entered into a master lease agreement with Arshiya Limited (“AL”) to lease back the warehouses to AL for a period of six years. AL will operate and manage the warehouses and pay pre-
agreed rentals.
2. Karnataka State Government owns 7.2% of ITPB & Tamil Nadu State Government owns 11.0% of ITPC. 45Investor contact Tan Choon Siang Chief Financial Officer Ascendas Property Fund Trustee Pte Ltd (Trustee-Manager of a-iTrust) Office: +65 6774 1033 Email: choonsiang.tan@a-iTrust.com Website: www.a-iTrust.com
You can also read