PALACE CAPITAL PLC INTERIM RESULTS - HALF YEAR ENDED 30 SEPTEMBER 2020
←
→
Page content transcription
If your browser does not render page correctly, please read the page content below

EXPERTS IN REGIONAL PROPERTY

PALACE CAPITAL PLC
INTERIM RESULTS
HALF YEAR ENDED 30 SEPTEMBER 2020

EXPERTS IN REGIONAL PROPERTY

Palace Capital are experts in
regional property investment.

Focused on unlocking value to
deliver attractive total returns.
 INTRODUCTION | FINANCIAL REVIEW | PROPERTY REVIEW | LOOKING FORWARD | CONCLUSION | APPENDICES

Page 1   | Palace Capital plc | Investor Presentation November 2020 | palacecapitalplc.com
INVESTMENT CASE

             Regional returns
             outperforming London
⚫ Palace portfolio established over the past 10 years focused in                                               London vs. regional UK office
                                                                                                               (% p.a. total property returns)
  growth regional towns and cities
⚫ Regional office returns have exceeded those generated by London                                       14.0

  every year since 2016 (43% of our portfolio)                                                          12.0

⚫ WFH has accelerated structural changes in the office market so                                        10.0

  our focus on quality over quantity expected to outperform                                              8.0

                                                                                                         6.0
⚫ Stock selection and tenant profile are crucial to weather the
  impact of Covid and retain strong occupancy and rent collection                                        4.0

                                                                                                         2.0
⚫ The growing importance of regions supported by Government
  levelling up and hub-and-spoke models, decentralising to reduce                                         -
                                                                                                                     2016      2017          2018   2019
  exposure to expensive London rents                                                                                          London   Regional
                                                                                                               Source: MSCI

             Page 2 | Palace Capital plc | Investor Presentation November 2020 | palacecapitalplc.com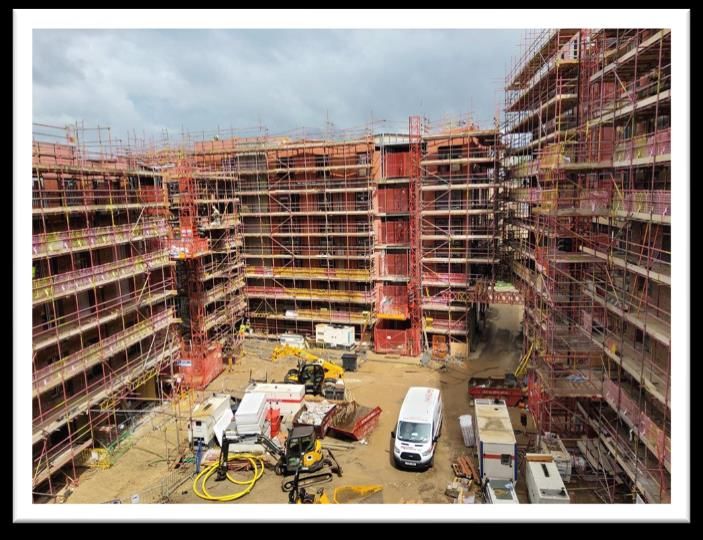
TENANT PROFILE

                                                                                                                                 96% rent collection
              Top 20 Tenant Rent Collection                                                                                      from Top 20 Tenants in
               Reliability of income: Top 20 Tenants - 44% of passing rents                                                      Q1 & Q2 and 100% in Q3*

                                    Contracted                                                                                   Contracted
                                                         Q1 rent           Q2 rent     Q3 rent                                                  Q1 rent      Q2 rent       Q3 rent
Tenant       Industry                  Rent pa                                                        Tenant   Industry             Rent pa
                                                       collection*        collection* collection*                                             collection*   collection*   collection*
                                       (£’000)                                                                                      (£’000)

             Leisure                           913         100%              100%              100%            Legal                    310     100%          100%          100%

             Auto                             544          100%              100%              100%            Retail                  294      0%**          0%**          100%

             Hotel                             510      Rent free          Rent free           100%            Retail                   291     100%          100%          100%

             Charity                          444          100%              100%              100%            Local Authority         283      100%          100%          100%

             Auto                             432          100%              100%              100%            Aviation                280      100%          100%          100%
                                                                                                               Health                  262      100%          100%          100%
             Insurance                        409          100%              100%              100%
                                                                                                               Retail                  246      100%          100%          100%
             Retail                            401         100%              100%              100%
                                                                                                               Public Services         246      100%          100%          100%
             Legal                            360          100%              100%              100%
                                                                                                               Construction            240      100%          100%          100%
             Technology                       355          100%              100%              100%
                                                                                                               Central Bank            232      100%          100%          100%
             Car Parking                      345          100%              100%              100%

*Rent collection is defined as rent collected in full, and/or rent being collected monthly as per the payment plan agreed with the tenant
**Non-collection to date as retail operations shut during lock-down

                          Page 3 | Palace Capital plc | November 2020 | palacecapitalplc.com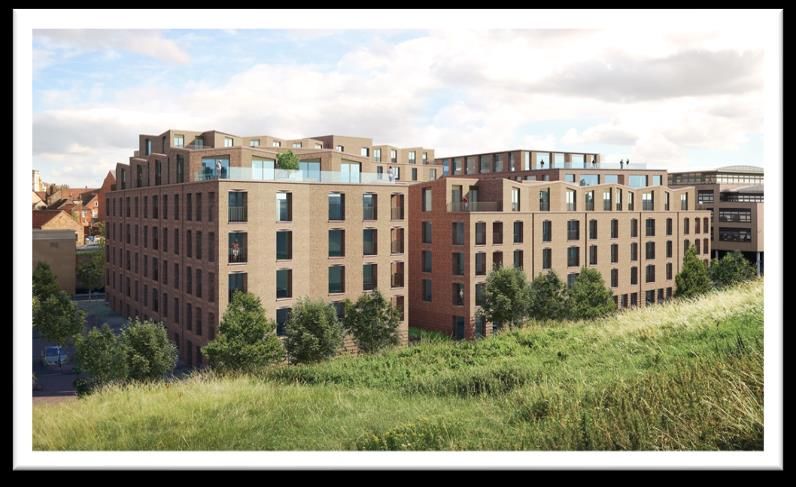
INTRODUCTION

   Highlights
   Strong rent collection despite Covid-19                                                                                  RETURNS FOR
                                                                                                                           SHAREHOLDERS

⚫ Rent collection has been strong - over 90% since lock-down
⚫ Dividends recommenced in August and Q2 dividend of 2.5p
  per share payable in December 2020
                                                                                              7 Year Total Accounting Return vs peers
                                                                                              (EPRA NTA growth + dividends) now at 115%
⚫ Hudson Quarter on track for completion in March 2021, over
  28% of 127 apartments already sold                                                          140%

⚫ 7 lease renewals and 3 rent reviews completed at an                                         120%

  average of 11% above ERV and a 9% uplift on previous                                        100%
                                                                                              80%
  passing rent
                                                                                              60%
⚫ All debt covenants compliant over past two quarters                                         40%
                                                                                              20%
                                                                                                0%

                                                                                                        Palace Capital         Peer Group
                                                                                              Source: Arden Partners plc
   Page 4 | Palace Capital plc | Investor Presentation November 2020 | palacecapitalplc.com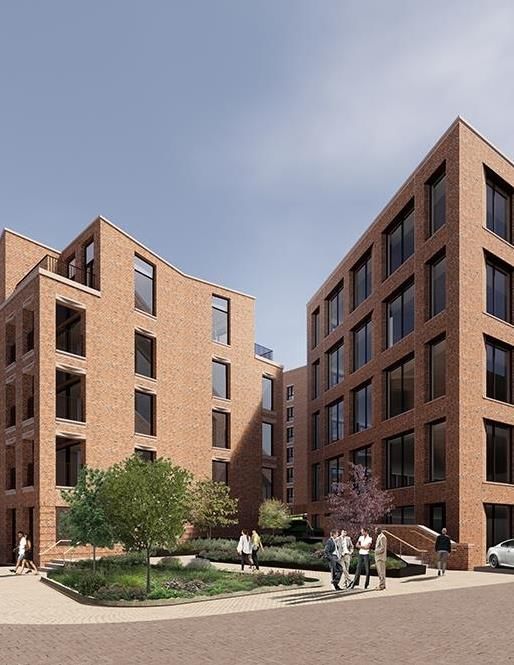
ECONOMY

Covid-19 Response
Priority focus on rent collection
⚫ Closer relationships with our tenants as we work with them to support their
  businesses through this crisis
⚫ Prudent liquidity management – sufficient cash and debt available during this time to
  manage through the pandemic
⚫ Working capital control – FY20 Q3 dividend due in April cancelled and all non-
  essential capex paused
⚫ Requests for rent deferrals, monthly payments and waivers reviewed on a case-by-
  case basis
⚫ Leisure sector hardest hit by non-payment albeit only £0.2m income lost to CVAs in
  this period and cash flow remains robust
⚫ Hudson Quarter York development site remained open throughout lock-down, albeit
  with reduced activity as supply chain restricted and safe social distances maintained

Page 5 | Palace Capital plc | Investor Presentation November 2020 | palacecapitalplc.com

RENT COLLECTION

                          Liquidity & Rent Collection
                          Positive performance

                                                                                 March Quarter*                       June Quarter*            September Quarter*

                                                                                            4%                             6%                         5%
LIQUIDITY AT 30 SEPTEMBER
                                                                                                                                                13%
2020
Cash & immediately available
                                                    £26.3m
facilities
Capital commitments                                 (£9.9m)
Net liquidity                                       £16.4m
Annualised interest & overheads                       £7.0m
Interest & overhead cash cover                        2.3 yrs                                                                                                  82%
                                                                                                 96%                             94%

                                                                                 Collected          Outstanding      Collected   Outstanding    Collected
                                                                                                                                                Being collected monthly
*Rent collection excludes concessions agreed with tenants                                                                                       Outstanding

                          Page 6 | Palace Capital plc | Investor Presentation November 2020 | palacecapitalplc.com
H1 21: FINANCIAL REVIEW

              Financial Performance
              Half year ended 30 September 2020

                                            H1 21              H1 20            Change                                          H1 21     FY20    H1 20
INCOME STATEMENT                                                                                         BALANCE SHEET
Rental income                              £8.2m                £8.8m                 -6.8%              Portfolio value       £281.6m   £277.8m £275.8m
IFRS (loss)/profit                        (£7.2m)               £2.6m                                    Cash                   £14.3m    £14.9m  £14.0m
EPRA earnings                               £3.2m               £6.7m                                    Drawn debt            £132.7m   £120.8m £108.1m
Adjusted profit before tax                  £3.4m               £3.9m               -12.8%               Net debt              £119.0m   £106.2m  £94.1m
Basic EPS                                  (15.5p)                5.6p                                   IFRS net assets       £158.4m   £166.3m £178.7m
EPRA EPS                                     7.0p                14.5p                                   Basic NAV per share      344p      361p    388p
Adjusted EPS                                  7.3p                8.5p               -14.1%              EPRA NTA per share       347p      364p    391p
Dividend per share                           5.0p                 9.5p                                   Loan to value             42%       38%     34%
Dividend cover                                1.5x                0.9x                                   NAV gearing               74%       63%     53%

              Page 7 | Palace Capital plc | Investor Presentation November 2020 | palacecapitalplc.com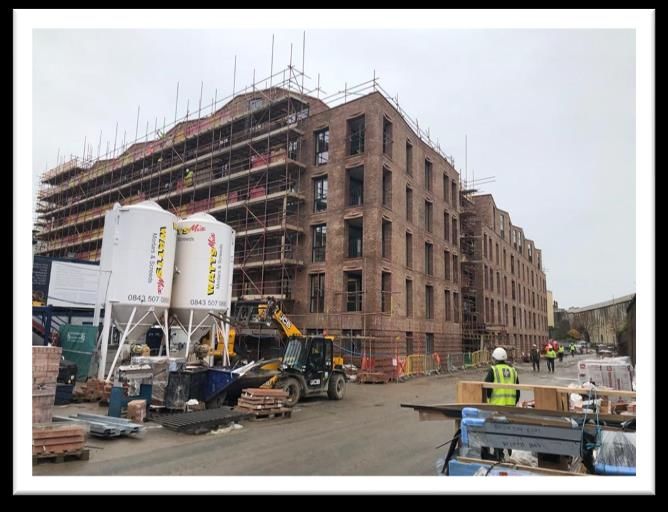
H1 21: FINANCIAL REVIEW

                  Profit reconciliation & Dividend track record
                  Half year ended 30 September 2020

                                                     H1 21                   H1 20
                                                     (£’m)                   (£’m)                                  H1 16    H1 17    H1 18    H1 19   H1 20   H1 21
INCOME STATEMENT                                                                               DIVIDENDS
Adjusted profit after tax                                 3.4                     3.9          Adjusted EPS         10.8p    10.8p    12.8p     8.0p    8.5p   7.3p
Surrender premium & fair                                                                       DPS                   9.0p     9.0p     9.5p     9.5p    9.5p   5.0p
                                                      (0.2)                       2.8
value of options
                                                                                               Dividend cover         1.2x     1.2x     1.3x    0.8x    0.9x    1.5x
EPRA earnings                                           3.2                      6.7
Revaluation losses                                  (10.0)                     (6.5)           Dividends paid       £1.4m    £2.3m    £2.4m    £4.4m   £4.4m £2.3m
Equity investment revaluation                        (0.2)                      (0.1)
Profit/(loss) on disposals                             0.2                     (0.3)
Hedging and derivative losses                        (0.4)                     (0.7)             Plan to pay quarterly dividends at a minimum level of 2.5p
Debt termination costs                                    -                    (0.5)
                                                                                                 This will increase with greater clarity on economic outlook
Deferred tax REIT adjustment                              -                      3.7
IFRS (loss)/profit for the year                       (7.2)                      2.3

                 Page 8 | Palace Capital plc | Investor Presentation November 2020 | palacecapitalplc.com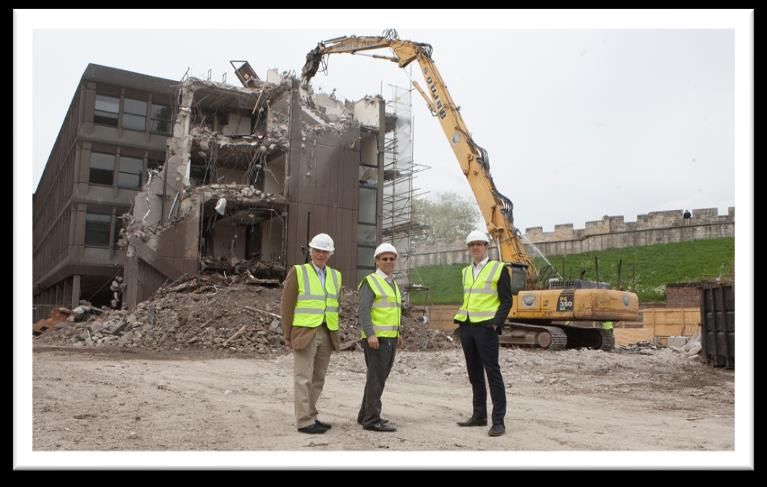
H1 21: FINANCIAL REVIEW

                 Property revaluation movement
                 Covid-19 negative impact on half year valuations                                                                    Like-for-like valuations: - 3.5%
                                                                                                                                     (vs. MSCI benchmark of -3.7%)

(£12.0m)
                                                                                                                £1.5m
                                                                             (£2.7m)
(£10.0m)                                                                                                                 £0.8m
                                                                                                                                             (£0.3m)
 (£8.0m)
                                           (£3.2m)

 (£6.0m)
                                                                                                                                                             (£10.0m)
 (£4.0m)
           (£6.1m)
 (£2.0m)

 (£0.0m)
            Office                          Leisure                       Retail/retail                   Development   Industrial            Other    Revaluation loss at 30
                                                                          warehouse                                                                      September 2020

                     Page 9 | Palace Capital plc | Investor Presentation November 2020 | palacecapitalplc.com
H1 21: FINANCIAL REVIEW
Net Tangible Asset bridging chart
EPRA NTA per share movements in the year
380p
375p 0.6
370p
7.3
365p
(21.8)
360p
355p
364.4
350p (2.5)
0.2
345p (0.9)
(0.4)
346.9
340p
EPRA NTA 31 Adjusted earnings Sale of non-core Property Cash dividends Derivative costs Equity investments Other movements* EPRA NTA 30
March 2020 assets revaluation paid fair value September 2020
movements movement
*Other movements includes movement in treasury shares
Page 10 | Palace Capital plc | Investor Presentation November 2020 | palacecapitalplc.comH1 21: FINANCIAL REVIEW
LTV: 42% (FY20: 38%)
£151.9m debt facilities Average Cost of Debt:
Interest Cover:
2.9% (FY20: 3.1%)
2.8x (FY20: 3.8x)
Strong relationship with lenders Hedging: 51% (FY20: 56%)
Debt Debt
Debt
Lender Facility Drawn Hedging Debt maturity (£m)
Maturity
(£m) (£m)
80.0
Barclays 40.5 40.5 Jun-2024 £34.6m fixed 70.0
NatWest (RCF) 40.0 28.6 Aug-2024 100% floating 60.0
Santander 25.5 25.5 Aug-2022 £19.2m fixed 50.0
Lloyds 6.8 6.8 Mar-2023 100% floating 40.0
30.0
Scottish Widows 13.5 13.5 Jul-2026 100% fixed
20.0
Barclays (development facility) 25.6 17.8 Jan-2022 100% floating
10.0
151.9 132.7 3.9 years 51% fixed
-
0-1 1-2 2-3 3-4 4-5 >5
Years
Page 11 | Palace Capital plc | Investor Presentation November 2020 | palacecapitalplc.comH1 21: FINANCIAL REVIEW Management of Financial Covenants Dealing with the Covid impact ⚫ Letting activity across the portfolio has slowed due to Covid coupled with some tenant breaks/expiries resulting in occupancy falling from 87.3% to 84.9% in the period. ⚫ Leisure values have been under pressure due to Covid down £5m (-12.4%) allowing for March and September valuation movements. ⚫ However, we think we’ve reached the bottom of the market for leisure and we have a £1m refurbishment programme planned at Sol for 2021 and lettings under offer at both schemes will improve rental income longer-term. ⚫ Group LTV has risen to 42% as a result of 3.5% like for like valuation fall and £12.8m further development debt drawn in the period re HQ York which is in construction phase ⚫ HQ residential sales somewhat slow currently but expected to generate +£50m cash proceeds once 100% sold, which will repay development facility of £26.5m ⚫ Group LTV expected to fall to 30% once all residential units have sold and surplus cash to be deployed in future opportunities Page 12 | Palace Capital plc | Investor Presentation November 2020 | palacecapitalplc.com
PROPERTY REVIEW

                    Property Portfolio - Overview
                    As at 30 September 2020

                                                   H1 21               FY20
                                                                                                                        Total Property Return performance against
                                                                                                                           MSCI benchmark by Sector for H1 21
Portfolio value (£m)                            £281.6m             £277.8m                          10.0%
Net initial yield (%)                              5.9%                6.0%                                                                             Palace Capital     MSCI Benchmark

Reversionary yield (%)                             7.3%                6.6%                            5.0%
Contractual rental income (£m)                   £16.9m              £17.6m
Estimated rental value (£m)                      £20.2m              £20.6m                            0.0%
WAULT to break (years)                         4.9 years            4.8 years
Void rate (%)                                      15.1%               12.7%                          -5.0%

Office weighting (%)                              43.4%               46.3%
Development weighting (%)                          18.7%               13.6%                        -10.0%

Industrial weighting (%)                           14.1%              14.0%
Core sector focus                                 76.2%               73.9%                         -15.0%
                                                                                                                 Industrial Industrial Office Rest Standard     Standard Office Rest  Retail
                                                                                                                South East Rest of UK     of UK   Retail South Retail Rest of South Warehouse
                                                                                                                                                     East        of UK       East

                    Page 13 | Palace Capital plc | Investor Presentation November 2020 | palacecapitalplc.com
PROPERTY REVIEW
Asset Management
Letting activity in the year
+12%
£800,000 ⚫ 13 lease events in the year providing Adding value
£700,000 additional income of £0.3m pa
£600,000 to our
⚫ 3 new leases: 5% ahead of ERV providing
£500,000
additional income of £0.2m pa
portfolio
+8%
£400,000
£300,000
through
⚫ 7 lease renewals: 12% ahead of ERV
£200,000 +5%
providing additional income of £0.03m pa active asset
£100,000
⚫ 3 rent reviews: 8% ahead of ERV providing
management
£0
New leases Lease renewals Rent reviews additional income of £0.1m pa
ERV pre-letting Rent post-letting
Page 14 | Palace Capital plc | Investor Presentation November 2020 | palacecapitalplc.comPROPERTY REVIEW
Sustainable rents across sectors
Rent vs ERV (psf)
£20.00
⚫ Rental levels are at low, £15.64 £16.22
£14.11
£16.26 £16.46
sustainable levels across the £15.00 £11.06
£10.14
portfolio £10.00 £8.73
£6.20 £6.85
⚫ Majority of reversion can be £5.00
captured through letting vacant £-
office space Office Leisure Industrial Retail Retail
Warehouses
⚫ Supply-demand dynamics
Currently let rent psf Currently let ERV psf
supports current regional rental
levels on a look-through Covid
basis Rental reversion
£25m £22m
⚫ Covid impact on office demand £20m £21m £20m
£20m £18m £18m £18m £17m
expected, but not reducing £16m
£14m £15m £13m
requirements, rather increasing £15m
specification and higher sq ft per £10m
employee £5m
£m
FY16 FY17 FY18 FY19 FY20 H1 21
Gross contracted rent Estimated Rental Value (ERV)
Page 15 | Palace Capital plc | Investor Presentation November 2020 | palacecapitalplc.comPROPERTY REVIEW
Current Rent Roll to ERV Bridge
+25% potential uplift
£21.0m
£0.9m
£0.3m (£0.5m)
£0.4m
£20.0m
£1.2m
£19.0m
£18.0m £21.1m
£1.9m
£20.2m
£17.0m
£16.0m £16.9m
£15.0m
Contracted Rent Vacant - can be let Vacant with Space let in Lease renewals Over rented ERV at 30 Under Total potential
30 September potential for current rent free September 2020 development ERV
2020 development and half rents
/refurbishment
Page 16 | Palace Capital plc | Investor Presentation November 2020 | palacecapitalplc.comPROPERTY REVIEW
How we deliver value:
Hudson Quarter Development
November 2020
⚫ 127 apartments, 39,500 sq ft of offices and car
parking
⚫ £69m GDV delivering a projected £20m cash on
cash return
⚫ Remaining construction fully funded by Barclays
⚫ 8 further apartments sold since 1st April so total of
36 (28%) residential units sold to date totaling
£9.6m
⚫ Show flat is now open within Victoria block and
scaffolding is coming down
⚫ Pre-let 4,500 sq ft offices on ground floor of one of the
residential blocks at a record rent in York of £25.00 psf
⚫ Considerable interest in the office block
⚫ Expected completion March 2021
www.hudsonquarteryork.com
Page 17 | Palace Capital plc | Investor Presentation November 2020 | palacecapitalplc.com Hudson Quarter, YorkPROPERTY REVIEW
Opportunistic Development
Pipeline to generate capital growth
Estimated
Description and Status build cost Timing
High Street, 7 Residential Units. Planning permission granted subject to S106 £2m Possible 2021 start or sell with planning
Uxbridge
Milbarn Medical, Mixed use development of c10,000 sq ft B1 and 10 flats being £3m Tenant break March 2022
Beaconsfield
considered
Midsummer Blvd, Potential for at least 100,000 sq. ft. office or residential. £30m Target VP by 2023
Milton Keynes
Holly Walk, Potential 70,000 sq ft residential and office development £20m Currently let to November 2022
Leamington Spa
Boulton House, Identified as potential future development 150,000 sq ft £45m Target VP by June 2024
Manchester
Page 18 | Palace Capital plc | Investor Presentation November 2020 | palacecapitalplc.comPROPERTY REVIEW
Cash on cash returns
How our regional portfolio is delivering total returns
Status Performance Total Return
Hudson ▪ Acquired in 2013 for £3.8m ▪ New development of 127 apartments ▪ Forecast cash on cash return: 47%*
Quarter, ▪ 103,000 sq ft office building adjoining York station ▪ 39,500 sq ft of offices and car parking ▪ Forecasted Ungeared IRR: 17%*
York ▪ Largely vacant initially, short term lets during planning process. ▪ Value uplift through planning consents: £10m
▪ Demolished in 2018 and construction commenced 2019 with ▪ Forecast GDV £69m to generate a further £10m
PC due March 2021 profit
High Street, ▪ Acquired in 2014 for £3.5m ▪ 5 years of income return ▪ Forecast cash on cash return: 34%
Weybridge ▪ Planning consent achieved for development of 28 residential ▪ Main office tenant vacated leaving a liability to ▪ Forecasted Ungeared IRR: 7%
units and 4,000 sq ft of retail space manage and currently being marketed to sell with (forecast once sale is completed)
▪ Building currently vacant prior to redevelopment planning
Boulton House, ▪ Acquired in 2016 for £10.6m with £0.6 million rent pa ▪ Average rents increased from £12 sq ft to £18.50 sq ft ▪ Total return to date: 45%
Manchester ▪ Centrally located office building of 75,000 sq ft ▪ Now 80% occupied ▪ Ungeared IRR to date: 11%
▪ Common area upgrade carried out and floor by floor ▪ +43% uplift in value to date
refurbishment & reletting programme ▪ Latest value in 2020: £15.23m
Kiln Farm, ▪ Acquired in October 2013 for £2.3m ▪ Capex of £3.3m on refurbishment ▪ Total return to date: 145%
Milton Keynes ▪ 38,300 sq ft let to Rockwell Automation which were ▪ Net income generated over the 7 years: £3.2m ▪ Ungeared IRR to date: 19%
refurbished for the tenant ▪ Latest value in 2020: £10.60m
▪ 14,500 sq ft fell vacant in 2016, refurbished & let in 2018 to
Monier Redland (BMI Group)
Aldi, ▪ Acquired in October 2017 for £4.7m ▪ Five yearly rent review based on RPI which ▪ Total return to date: 48%
Gosport ▪ Let to Aldi at a rent of £247,800 pa, expiring in August 2030 compounds annually (Collar: 1%, Cap: 2.75%) ▪ Ungeared IRR to date: 15%
▪ In 2018 regeared the lease for a further 20 years without a ▪ Latest value in 2020: £6.13m
break option at an increased rent of £291,000 pa (17.4% uplift)
*Cash on cash return and IRR forecasted once residential units sold and commercial space let 12 months post completion
Page 19 | Palace Capital plc | Investor Presentation November 2020 | palacecapitalplc.comPROPERTY REVIEW
Refurbishment &
Repositioning:
Sol Northampton
⚫ 90% let following letting to Gravity Fitness who opened
this year
⚫ Leisure sector hardest hit by Government lock-down so
critical to support our tenants.
⚫ Accor lease extended to 2032 post Covid-19 in return for
6 month rent free from March 2020
⚫ Gravity break taken out providing 14 years unexpired in
return for 9 months half rent
⚫ £1m mall refurbishment plans in progress due to
complete in 2021
⚫ A further 21,000 sq ft to let with current interest in some
of the space in order to complete turnaround of asset
Page 20 | Palace Capital plc | Investor Presentation November 2020 | palacecapitalplc.com Sol, Northampton
Image for illustrative purposes onlyLOOKING FORWARD
Looking to 2021
Recycling capital to take advantage of
market opportunities
⚫ Disposal strategy currently in progress – book value of
£8.3m currently marketed with further properties
earmarked in the next 6 months
Residential Unit – living room CGI, HQ York
⚫ Residential sales at HQ York will initially be used to repay
development facility and surplus cash beyond released
into working capital
⚫ Group LTV expected to reduce from 42% toward 30%
as continue to progress the residential sales programme
at Hudson Quarter York
⚫ Distressed opportunities expected in 2021
⚫ Equity partners identified in order to take advantage of
significant transactions pending a recovery in share price
Page 21 | Palace Capital plc | Investor Presentation November 2020 | palacecapitalplc.com
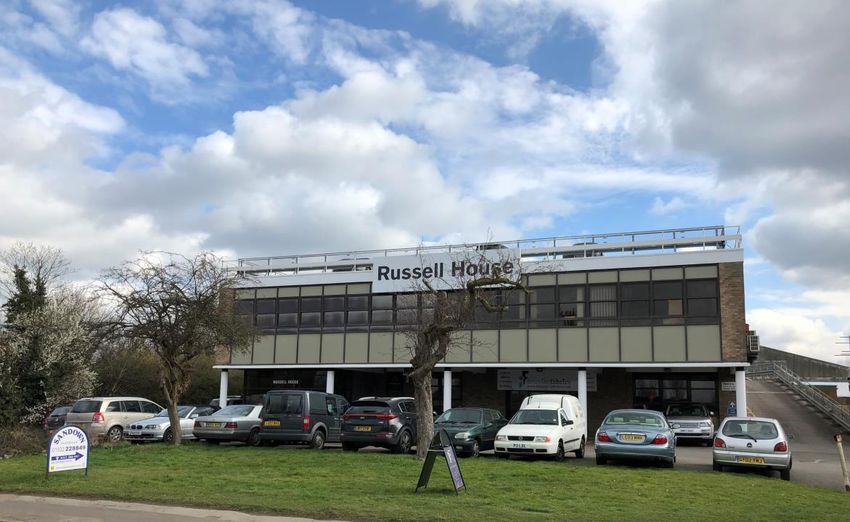
Russell House, Walton on ThamesCONCLUSION
Confident outlook for regional strategy
Income and capital growth
⚫ Rent collection has been strong - over 90% since Covid lock-down
⚫ We hold the right properties in the right locations focused in the right sectors with reliable
tenants
Regional
⚫ +25% income reversion within portfolio:
– Repositioning city centre office assets with short WAULT of 2.8yrs
expertise
– +£4.2m pa potential future income growth
continues to
⚫ Capital growth upside:
– £10m surplus forecast at Hudson Quarter, York, will increase NAV per share by 5%
deliver
– Value creation opportunities within the portfolio identified
– Medium term development pipeline
⚫ Residential sales at HQ York and other property disposals expected to release surplus cash
⚫ Palace regional expertise & REIT status provides investors with an efficient structure to access
the regional growth opportunity
⚫ Well established platform and portfolio positioned to capitalise on Government ‘levelling up’
investment in the regions and take advantage of distressed opportunities in 2021
Page 22 | Palace Capital plc | Investor Presentation November 2020 | palacecapitalplc.comEXPERTS IN REGIONAL PROPERTY APPENDICES
Our story so far
                                                                                                                                31-03-2013   30-09-2020
November 2010 Management taking Board control of the Company valued                   Net asset value                              £0.6m        £158.4m
              at £0.1m with a vision to invest in regional property
                                                                                      Property portfolio                            £2.0m       £281.6m
October 2011           Hockenhull Estates portfolio acquired for £1.8m consisting
                       of nine properties                                             Contractual rental income                     £0.2m        £16.9m
October 2013           Sequel portfolio consisting of 24 properties across office,    Total Accounting Return over 7 years                         115%
                       industrial and retail sectors acquired for £39.25m
August 2014            Property Investment Holdings portfolio acquired for £32m
                       consisting of 17 commercial properties across office,
                       industrial and retail sectors
2015-2017              Seven individual property acquisitions at values ranging
                       between £4m and £24m focused in the office and leisure
                       sectors.
October 2017           Acquisition of the R.T. Warren Portfolio for £68m consisting
                       of 21 commercial and 65 residential properties
March 2018             Completed move from AIM to a Premium Listing on the
                       Main Market of the London Stock Exchange
May 2018               Joined FTSE Small Cap and All Share indices
December 2018 One Derby Square, Liverpool acquired for £14.0m
August 2019            Converted to a UK REIT on 1st August 2019
December 2019 Commenced payment of Property Income Distributions
              (PID) under the REIT regime
September 2020 Major development in York progressing. 28% residential
              pre-sales agreed to date

                                                                                                   Source: Arden Partners plc

Page 24 | Palace Capital plc | November 2020 | palacecapitalplc.com
APPENDICES
Regional portfolio
Focused on office & industrial growth sectors
⚫ Balanced portfolio of 52 properties
⚫ Diversified granular income
191 tenants in the portfolio
Top 20 tenants represent 44% of portfolio
WAULT to break of 4.9 years
⚫ Low risk & defensive characteristics
⚫ Located close to transport hubs
18.7%
Core-Plus
48.2%
Value-Add
Development
33.0%
Page 25 | Palace Capital plc | November 2020 | palacecapitalplc.comHudson Quarter Timeline
2
0
2
1
C
o
m
p
l
e
t
i
o
Feb 2016 Aug 2017 n
2021 s
Sep 2013 Planning Planning Dec 2018 Feb 2019 2020
Acquired as part of permission permission for Demolition Funding secured Construction on-
Completion c
scheduled for h
Quintain portfolio granted for development completed from Barclays going
2021 e
conversion granted
d
u
l
e
d
f
o
r
Q
1
2
0
2
1
Page 26 | Palace Capital plc | November 2020 | palacecapitalplc.comAPPENDICES
Financial track record
BALANCE SHEET FY16 FY17 FY18 FY19 FY20 H1 21
Property portfolio £173.4m £183.2m £276.7m £286.3m £277.8m £281.6m
IFRS net assets £106.8m £109.6m £183.3m £180.3m £166.3m £158.4m
EPRA NTA per share 414p 443p 415p 407p 364p 347p
Group LTV 37% 37% 30% 34% 38% 42%
INCOME STATEMENT H1 16 H1 17 H1 18 H1 19 H1 20 H1 21
Adjusted profit before tax* £3.9m £3.2m £3.7m £4.3m £3.9m £3.4m
Adjusted EPS 10.8p 10.8p 12.8p 8.0p 8.5p 7.3p
Dividend per share 9.0p 9.0p 9.5p 9.5p 9.5p 5.0p
Dividend cover 1.2x 1.2x 1.3x 0.8x 0.9x 1.5x
* Excludes non-recurring income and expenditure, property revaluations, profit/losses on disposal and fair value movements
Page 27 | Palace Capital plc | November 2020 | palacecapitalplc.comAPPENDICES
Strong track record of Value Creation
Income and Capital Return
Total Property Return Vs MSCI Benchmark Dividend Pay-Out
£40m
12.0%
Continuing to
£35m
10.0%
outperform the
£30m
8.0%
MSCI benchmark
6.0% £25m
for the last 3.5
4.0% £20m years
2.0%
£15m
0.0%
£10m
-2.0%
£5m
£36m of dividends
-4.0%
FY18 FY19 FY20 H1 21
paid to date
£m
Palace Capital Property Return 2016 2017 2018 2019 2020 2021
MSCI UK Quarterly Index benchmark Cumulative dividends paid
Page 28 | Palace Capital plc | November 2020 | palacecapitalplc.comAPPENDICES
Covid-19 impact on TSR and share price
Total Shareholder Return Palace Capital discount to NAV vs REIT sector
Covid-19
average discount to NAV since 2015
impact
500p 10%
450p
0%
400p
350p -10%
300p -20%
250p
-30%
200p
150p -40%
100p
-50%
50p
0p -60%
Nov-15 Nov-16 Nov-17 Nov-18 Nov-19 Nov-20
2013 2014 2015 2016 2017 2018 2019 2020
Palace Capital REIT sector
Page 29 | Palace Capital plc | November 2020 | palacecapitalplc.comAPPENDIX ICR covenants range 225% -250%
Debt Covenants LTV covenants range 57.5% -62.0%
All covenants compliant
⚫ Investment portfolio is highly cash generative BANK COVENANT TARGET
and even assuming worst case on lease expiries Historical interest cover 250%
and breaks still show sufficient net rental income Projected interest cover 250%
on all the ICR covenants to remain compliant
Historical 12 months interest cover 250%
⚫ Values as at 30 September 2020 fell 3.5% like-
Projected interest cover 250%
for-like due to Covid. Scottish Widows facility
currently being revalued by the bank and any Historical interest cover 250%
curing will likely be satisfied from cash reserves. Projected interest cover 250%
The remaining facilities on average would need
to fall a further 15% to require curing. Historical debt service cover 130%
Projected debt service cover 130%
⚫ Compliant with all debt covenants at October
2020 test date Historical interest cover 225%
Debt to net rent 1000%
⚫ Hudson Quarter, York remaining expenditure is
fully funded by Barclays £26.5m development Historical interest cover 250%
facility Projected interest cover 250%
Historical debt yield 10%
Projected debt yield 10%
Page 30 | Palace Capital plc | Investor Presentation November 2020 | palacecapitalplc.comAPPENDICES
Sector splits
Regional Office and Industrial focus
Market value % of Portfolio WAULT
No. No. Contractual rental Total ERV
30 September by market Area (sq ft) ERV (£)* to break
properties leases income p.a. (£) of void (£)
2020 (£) value (yrs)
Offices 122,250,000 43.4% 27 117 698,946 8,459,462 11,281,563 2.8 2,350,712
Industrial 39,625,000 14.1% 10 38 409,593 2,436,617 2,839,840 3.7 118,300
Leisure 35,035,000 12.4% 2 20 306,970 3,198,541 3,201,601 11.3 366,230
Development 52,725,000 18.7% 2 - - - - - -
Retail 22,325,000 7.9% 8 49 128,171 1,945,531 2,184,561 7.7 213,140
Retail Warehouses 9,435,000 3.4% 2 2 53,870 759,964 595,700 6.2 -
Other 200,000 0.1% 1 1 8,660 115,132 132,000 2.8 -
Total 281,595,000 100% 52 227 1,606,210 16,915,247 20,235,265 4.9 3,048,382
* Based on Cushman & Wakefield estimated rental values
Page 31 | Palace Capital plc | November 2020 | palacecapitalplc.comAPPENDICES
Top 10 assets by value
60% of total portfolio
Area Gross rental Reversionary WAULT to
Property Name Sector (sq ft) income p.a. (£) yield* break (yrs)
Hudson Quarter, York development Development n/a n/a n/a n/a
2 & 3 St James Gate, Newcastle Offices 99,125 1,244,007 8.80% 3.8
Broad Street Plaza, Halifax Leisure 117,767 1,627,382 7.56% 11.5
Sol, Northampton Leisure 189,203 1,571,159 8.53% 11.2
Boulton House, 17-21 Chorlton Street, Manchester Offices 74,653 932,909 7.92% 2.2
One Derby Square, Liverpool Offices 70,161 1,056,735 7.94% 3.0
Bank House, 27 King Street, Leeds Offices 88,036 616,918 9.19% 2.7
Kiln Farm, 2-4 Pitfield, Milton Keynes Offices 52,818 663,617 7.37% 6.5
25 & 27 Black Moor Road, Verwood Industrial 65,765 352,300 5.87% 2.7
Point Four Industrial Estate, Avonmouth Industrial 84,748 434,206 7.13% 3.3
Total 842,276 8,499,233
* Based on Cushman & Wakefield estimated rental values
Page 32 | Palace Capital plc | November 2020 | palacecapitalplc.comAPPENDICES
Valuations
Covid impact –downward pressure BUT defensive characteristics of portfolio focused on regional
office and industrial sectors
EPRA
Market value Market value
Gain/(loss) Gain/(loss) topped-up
30 September 31 March
(£) % NIY ⚫ Industrial valuations held up
2020 (£) 2020 (£)
% well at 30 September 2020
Offices 122,250,000 127,535,000* (5,285,000) (4.1)% 5.7% and expected to remain
Development 52,725,000 37,830,000 14,895,000 39.4% N/A resilient
Industrial 39,625,000 38,805,000 820,000 2.1% 5.7%
⚫ Leisure, retail and retail
Leisure 35,035,000 37,850,000 (2,815,000) (7.4)% 7.5%
warehouse sectors all saw
Retail 22,325,000 23,885,000 (1,560,000) (6.5)% 7.7% significant downward
Retail Warehouses 9,435,000 10,545,000 (1,110,000) (10.5)% 7.6% movement in valuations
Other 200,000 360,000 (160,000) (44.4)% N/A from Covid-19
Total market value 281,595,000 276,810,000 4,785,000 1.7%
⚫ Assets under development
Capital expenditure in H1 21** (14,544,212) - (14,544,212) increased in value as a result
Total like for like 267,050,788 276,810,000 (9,759,212) (3.5)% of continued expenditure
*Excludes properties disposed in H1 21
**Includes all capital expenditure on developments, refurbishments, and capitalised legal and letting fees incurred in H1 21
Page 33 | Palace Capital plc | Investor Presentation November 2020 | palacecapitalplc.comAPPENDICES
EPRA Occupancy
Significant asset management in progress
95.0%
90.0%
85.0%
(12.0%) 6.2%
80.0% 0.6% 0.3% (6.2%)
1.7%
87.3% 2.0%
75.0% 84.9%
(0.8%) (0.4%)
70.0%
65.0%
EPRA At risk through Additional Changes in ERV Lease renewals Breaks not New leases Disposals Current on-going EPRA
Occupancy at 31 expiries/breaks tenants lost exercised asset Occupancy at 30
March 2020 (Covid-19) management September 2020
Page 34 | Palace Capital plc | Investor Presentation November 2020 | palacecapitalplc.comBiographies
NEIL SINCLAIR STEPHEN SILVESTER RICHARD STARR STANLEY DAVIS
Chief Executive Finance Director Executive Property Director Chairman
Chartered Surveyor FRICS Chartered Accountant FCA Chartered Surveyor MRICS Stanley is a successful
Neil co-founded Palace Stephen joined Palace Capital in Richard joined Palace Capital in entrepreneur who has been
Capital and has over 50 years’ 2015 and brings over 10 years’ 2013 on the back of the Sequel involved in financial services and
experience in the property experience as a finance acquisition and related equity property businesses since 1977.
sector. He was a founder of professional in real estate. He raise. He has extensive experience His founding Company was
Sinclair Goldsmith Chartered previously held the role of Group sourcing and managing company registration agents
Surveyors which was Financial Controller at NewRiver commercial investments from his Stanley Davis Company Services
admitted to the Official List in REIT for 3 years and prior to that previous role running his own which he sold in 1988. Until
1987 and subsequently was Head of Finance at St Hilliers, successful boutique property recently he was the Chairman of
merged with Conrad Ritblat. a construction, development and consultancy and before that, four Stanley Davis Group Limited
property fund management Central London property firms. specialising in Company
business in Australia. formations, property and Company
searches.
Page 35 | Palace Capital plc | November 2020 | palacecapitalplc.comDisclaimer The information in this presentation may include forward-looking statements, which are based on current expectations and projections about future events. These forward looking statements reflect the Directors’ beliefs and expectations and are subject to risks, uncertainties and assumptions about Palace Capital Plc (the ‘Group’) including amongst other things the development of its business, trends in its operating industry, returns on investment and future capital expenditure and acquisitions, that could cause actual results and performance to differ materially from any expected futures results or performance expressed or implied by the forward looking statements. None of the future projections, expectations, estimates or prospects in this document should be taken as forecasts or promises nor should they be taken as implying any indication, assurance or guarantee that the assumption on which such future projections, expectations, estimates or prospects have been prepared are correct or exhaustive or, in such case of the assumptions, fully stated in the document. As a result, you are cautioned not to place reliance on such forward looking statements as a prediction of actual results or otherwise. The information and opinions contained in this document are provided as at the date of this document and are subject to change without notice. No one undertakes to update publicly or revise any such forward looking statements. No statement in this document is or is intended to be a profit forecast or profit estimate or to imply that the earnings of the Group for the current or future financial years will necessarily match or exceed the historical or published earnings of the Group. Page 36 | Palace Capital plc | November 2020 | palacecapitalplc.com
You can also read