Corporate Presentation - Italian Lifestyle Day, Milan September 4th, 2018 - Elica

 
CONTINUE READING
Corporate Presentation - Italian Lifestyle Day, Milan September 4th, 2018 - Elica
Corporate Presentation
  Italian Lifestyle Day, Milan
       September 4th, 2018
Corporate Presentation - Italian Lifestyle Day, Milan September 4th, 2018 - Elica
VISIONAIR
            «CREATE OUTSTANDING VALUE FOR
            CONSUMERS AND PROFESSIONALS IN
            THE VENTILATION, FILTRATION AND
            PURIFICATION OF AIR AT HOME»

            ELICA: QUALITY WORK, ETHICAL
            EMPATHY FOR THE WELFARE OF
            PEOPLE AND THE ENVIRONMENT
Corporate Presentation - Italian Lifestyle Day, Milan September 4th, 2018 - Elica
Product Leadership: Focus on Design and Innovation

                                                     3
Corporate Presentation - Italian Lifestyle Day, Milan September 4th, 2018 - Elica
A Story of Innovation through Design
         LEGO              OM            STAR           SPACE            FEEL          ICO            35CC         SWEET             SNAP           NIKOLA TESLA

          First        Breakthrough     The hood     The most silent   E>>motion Low consumption     Unique      Experimental       The first IOT         Hob
 1970   Elica Hood        product     becomes lamp hood in the world    control      System        Cubic Design new materials Monitor & Air extractor   Extractor
                                                                                                                                                                    TODAY

    PROMISE           A unique and distinctive Brand with an emotional design and a technological imprinting that gives value to you and your home

   PURPOSE
    VALUES                          Design                                        Innovation                                     Expertise

                                                                                  PIONEERSHIP

  REASON TO          More than 65 Design Awards                           A number of world firsts               EPL Elica Propulsion Lab
    BELIEVE                                                                                                      World-class Innovation and
                     With over 130 Patents                                                                               testing Lab
                     (25 patents per year)                                                                            (€2.5m in 2017)

    PAY OFF
                                                                                  aria nuova
                                                                                                                                                                            4
Corporate Presentation - Italian Lifestyle Day, Milan September 4th, 2018 - Elica
Becoming the world leader in hoods production
 World market leader in the hoods segment with        2017A Revenues by Product
21m units sold and a 14% worldwide market share
                                                    Elica and
                                                      Other
                                                       Own
                                                     Brands                        OEMs
       €479m sales (+9.1% vs 2016) and                 40%                          47%
   €36.8m (+13.8% vs 2016) EBITDA in 2017A

                                                                        Electric
   Truly international Group with sales in >100                         Motors
                                                                         13%
                    countries
                                                    2017A Revenues by Geography

                                                                        Asia
                                                                        13%
 7 manufacturing plants located in Italy, Poland,
           Mexico, India and China
                                                    Americas
                                                      16%

                                                                                   EMEA
                                                                                    55%
                 c. 3,800 employees
                                                                Italy
                                                                16%

           •   Source: Company Documents.                                                 5
Corporate Presentation - Italian Lifestyle Day, Milan September 4th, 2018 - Elica
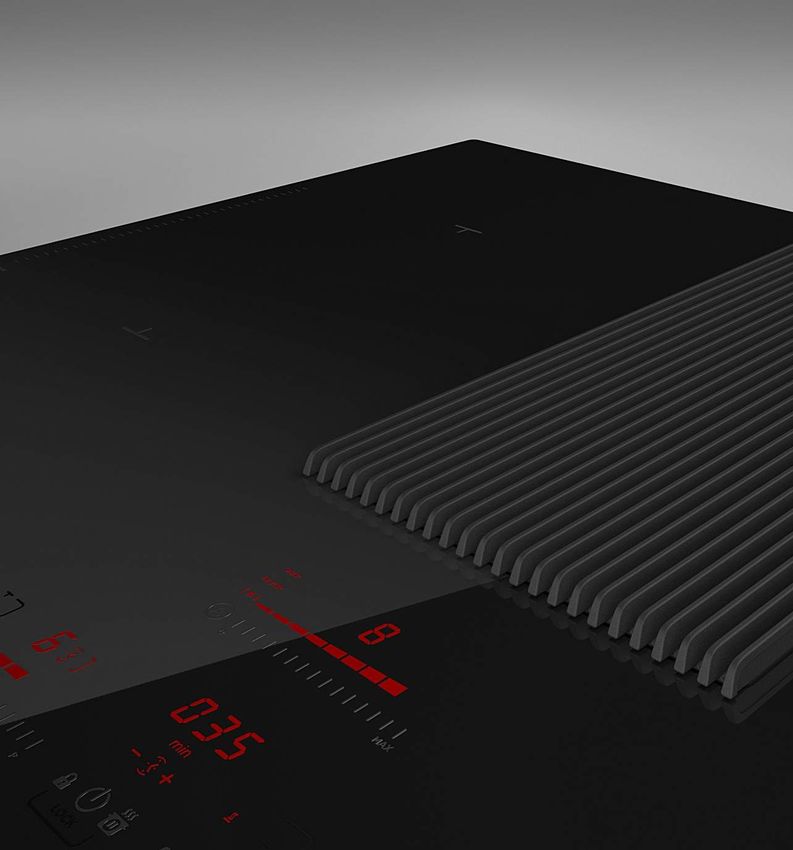
…with a strong and experienced management team
                                                                              Antonio Recinella
                                                                            Chief Executive Officer

                                                                                   ●     Appointed CEO of Elica in
                                                                                         October 2016
             Alessandro Carloni                                                    ●     Previously covered senior                                Piero Pracchi
            Chief Financial Officer                                                      management positions in                              Chief Marketing Officer
                                                                                         Honeywell International and
                                                                                         Magneti Marelli
                  ●   Appointed CFO of Elica in                                                                                                    ●   Appointed CMO of Elica in
                      June 2017                                                    ●     Holds an MBA from IMD                                         January 2018
                                                                                         International University of
                  ●   Previously covered senior                                                                                                    ●   Previously covered senior
                                                                                         Losanne
                      management positions in                                                                                                          management positions in
                      Whirlpool, Honeywell                                                                                                             Whirlpool and Indesit
                      International and Deloitte                                                                                                   ●   Holds a Master Degree from
                  ●   Holds a Master Degree from                                                                                                       Bocconi University
                      LUISS University

     Enrica Satta – VP Corporate &                                                                Luca Barboni – Motors Division                  Gianluca D’Arcangelo –
                                                   Marco Cimino – R&D Director
    Strategy and Group HR Director                                                                          Director                              Chief Information Officer

             ●   Appointed in September                    ●   Appointed in April 2013                       ●    Appointed in January                   ●   Appointed in January
                 2015                                                                                             2015                                       2017
                                                           ●   Previously covered senior
             ●   Previously covered senior                     management positions in                       ●    Previously covered senior              ●   Previously covered senior
                 management positions in                       Elica’s technical                                  management positions in                    management positions in
                 Techint Group, Fastweb                        departments                                        Elica and Fime                             Phillips and Honeywell
                 and Omnitel-Vodafone

    Mauro Fugnanesi – Category &
                                                                      Gianguido Cerullo – VP Go to Market                                      Marcello Malano – VP Operations
    Program Management Director

             ●   Appointed in May 2017                                              ●    Appointed in September                                          ●   Appointed in January
                                                                                         2015                                                                2017
             ●   Previously covered senior
                 management positions in                                            ●    Previously covered senior                                       ●   Previously covered senior
                 Elica                                                                   management positions in                                             management positions in
                                                                                         Indesit and Merloni                                                 Honeywell and Tecnogas
                                                                                                                                                                                         6
Corporate Presentation - Italian Lifestyle Day, Milan September 4th, 2018 - Elica
Truly International Group with Global Capabilities
                                                                  7 production plants in Italy, Poland,
                                                                       India, China and Mexico
                                Poland
                                                              ●   Italian sites (3) dedicated to high-end
                                                                  and low-end products
                                                              ●   The remaining European production is
                                                                  carried out in Poland
                                                              ●   America is entirely served by the
                                                                  Mexican plant
                                                              ●   Local-for-local approach in China, India
                                                                  and Japan (production controlled by the
                                                                  company’s partner, Fuji)
                                                      China

Mexico

               Italy                          India                     Sales in > 100 countries
                                                              ●   Qualified retail chains (especially in
                                                                  France and the UK)
                                                              ●   Distributors (serving furniture and
                                                                  household appliance shops, kitchen
                                                                  studios and contractors)
                       Production Network Country
                                                              ●   Kitchen manufacturers which serve
                                                                  kitchen and furniture shops

                                                                                                   7
Corporate Presentation - Italian Lifestyle Day, Milan September 4th, 2018 - Elica
Continuous Focus on Own Brands Expansion
    Elica Hoods Revenues
    Breakdown by Brand(1)                                                                  Flagship brand

                                                                    Elica Brand
                                                                                            High design
                                                                                           and technology

                                                                                             Worldwide
                                                                                             presence
   16%
                                  29%

                                                                    Other Own Brands
   20%
                                                                                             Brands for
                                  17%                                                      local markets

                                                                                           Value to high-
                                                                                           end products

   64%
                                  54%

                                                                                            Wide client
                                                                                             portfolio
                                                                    OEMs

                                                                                           Client branded
   2010A                        2017A
                                                                                               hoods

     •     Source: Company Documents.   (1) Excluding electric motors business         .                    8
Corporate Presentation - Italian Lifestyle Day, Milan September 4th, 2018 - Elica
Investment Highlights
1                    World Market Leader in Kitchen Hoods Manufacturing

2           Solid Long-Term Market Fundamentals with Attractive Growth Prospects

3                  Value-enhancing Focus on “Own Brand” Growth Strategy

4    Long-standing Relationships with a Well Diversified Base of Leading International OEMs

5               Continuous Focus on Consumer Focused Technology Roadmap

6                                    New Leadership Team

7      Considerable Value Creation Opportunities through Additional Product Development

                                                                                              9
Corporate Presentation - Italian Lifestyle Day, Milan September 4th, 2018 - Elica
6th QTR of solid performance growth
      20,0                                                                                           9,0%
                                                                                           8,3%
                                                                                 8,1%
                                                                        7,9%
      18,0             7,6%         7,6%               7,7%                                          8,0%

      16,0
                                                                                                     7,0%
             6,2%
      14,0
                                                                                                     6,0%

      12,0
                                                                                           10,4      5,0%
      10,0                           9,4                                 9,6      9,7
                        9,0                             8,8
                                                                                                     4,0%
       8,0    7,4
                                                                                                     3,0%
       6,0

                                                                                                     2,0%
       4,0

       2,0                                                                                           1,0%

       0,0                                                                                           0,0%
             4Q 2016   1Q 2017      2Q 2017           3Q 2017          4Q 2017   1Q 2018   2Q 2018

                                           EBITDA AdJ (€M)      % on Net Sales

                              10,4 M€ Highest EBITA Adj. since Q4 2015
                                                                                                            10
A Brand Portfolio to Cover all Consumer Segments

                              TRENDY/
                               ICONIC

                                                              BRAND
                                                                A

             Premium
                                                BRAND
                                                  B

              Core

                                                                       BRAND
                                                                         E
              Value

                                        BRAND
                                          C

                                                                      WILLINGNESS
                            CONSERVATIVE
                                                                         TO PAY

             Rightly positioned to win in the competitive arena
                                                                                    11
We Designed our Strategy to Expand our Home Presence
                FROM KITCHEN                                          TO HOME

                STRENGTHEN               COOKING                  AIR QUALITY
                 THE CORE               EXPERIENCE                   CARE
                    to be Consistent   to be Different creating   to be Meaningful and
                       and Salient        an Emotional Link         creating demand

   FROM APPLIANCE                                                                        TO SYSTEM

                                                                                                     12
Capturing Market Opportunities to Consolidate and
Expand into Valuable Segments
                           Target Market                             Elica Strategy

                           The most important category of the       ELICA leads the category with a complete range
              HEAD FREE                                             à Keeping the leadership
                           market in terms of value
                           (23% market share value)
 Core Range

                           High end box (RRP>€500) represents       ELICA is the second brand in volume
              BOX          almost 50% of category value             à Boosting the Premium segment penetration

                           AVG RRP of the category is 25% upper     ELICA is the category leader
              DECORATIVE
                           than total market RRP                    à Keeping its premium positioning
 Emerging

                           Double digit increase YoY both in unit   ELICA develops a complete range with a strong
              CEILING      and value, confirming a P.IDX higher     value proposition in order to differentiate from
                           than 300                                 competitors

                                                                                                                       13
Focusing on Technological Leadership to Anticipate New
Solutions and Drive Demand

       Powerful and effective fumes detection, through innovative and efficient   5 year roadmap
       system of air flow governance and design optimization
                                                                                  €50m+ Investments

                                                                                  over 100 people involved
       Always high standard of clean air, thanks to automatic filtering
       maintenance and customized filtering solutions
                                                                                  more than 25 patents per year

                                                                                  stream-lining global platforms
       Silence ever, through new generation of electronic control motors and
       calibrated fluid dynamic

                                                                                                             14
Cooking Provides Strong Brand Purpose through a
Significant New Experience
         End of 2016 – Elica entered the aspiration hob category
         Two models on high and middle market segment

         Value proposition focused on simplicity

         Generating circa €18m revenues until today
                                                                   15
Which Now Unfolds with 6 New Models in 2018-19
PRICE
POSITIONING                                                                                    CHEF

  4.000 €
                                                               SWITCH

                                        UPSIDE
                             current                                                          CURRENT

                   current
  2.000 €

                  PRIME                                                                               LIBRA

    FLAME

                                   with a world first                                                                     PRODUCT VALUES

                                                                                                                                           1.000 €
            Easy To Use                 Easy To Clean/ Added            Powerful and Silent                   Cooking Experience
                                           functionalities
                                                                                                                                                     16
NIKOLA TESLA PRIME
                                                        Phase in: July 2018
                                                        Priority Market: Italy, Germany, Iberian area, France

NIKOLA TESLA SWITCH
Phase in: July 2018
Priority Market: Italy, Germany, Iberian area, France
                                                                                                                17
Leveraging on our Brand Authority to Expand in the
Domestic Enviroment

 Indoors, the air can be two to five times more polluted than the air outside according to the U.S. Environmental
       Protection Agency. Studies show that breathing clean air can contribute to health and well-being.

                Public concerns on indoor air quality (IAQ) have drawn a great deal of attention
                Today we estimate an European market value of almost €1bn

                Leveraging dominant leading position and its significant know how
                Elica will launch a new complementary business of the air

                Connectivity as enabler, design as uniqueness

                                                                                                               18
ConnectAir is Elica’s First Connected System, which
        Guarantees Air Control in your Kitchen

                 IT WORKS AUTOMATICALLY
                 It guarantees best cooking and air purifying performance by simply activating
                 the hob

                 MONITORS, INFORMS, SIMPLIFIES
                 Offers the opportunity to control air quality in the domestic environment, even
                 while away from the home

                  ALWAYS CONNECTED
                  It helps to reduce the risk of meals burning and sends an
Indoors, the air can be two to five times more polluted than the air outside according to the U.S. Environmental
                  alert via the app to advise that the burners have been
      Protection Agency. Studies show that breathing clean air can contribute to health and well-being.
                  automatically turned off

                                                                                                                   19
Brand Leadership

Indoors, the air can be two to five times more polluted than the air outside according to the U.S. Environmental
      Protection Agency. Studies show that breathing clean air can contribute to health and well-being.

                                                                                                                   20
The journey to affirm our leadership is well underway…

        Brand leadership        Product leadership        Company leadership

          ELICA                    ELICA                         ELICA
   THE ACCENT TO MAKE         THE TOP OF MIND             A GLOBAL COMPANY,
   YOUR KITCHEN OUTFIT      SOLUTION TO DESIGN               THE NUMBER 1
   SPECIAL AND UNIQUE        A KITCHEN TO LOVE              IN THE INDUSTRY

  ELICA PILLARS:           DESIGN | INNOVATION | SMART TECHNOLOGY

                                                                              21
… selecting carefully our strategic target audience

    CONSUMERS            PURCHASE INFLUENCERS   CORPORATE STAKEHOLDER

                           DESIGNERS
     DESIGN PASSIONATE     ARCHITECTS             INVESTORS
          FOODIES           BLOGGERS            INSTITUTIONS
      SMART FAMILIES          MEDIA             ASSOCIATIONS
                         TRADE PARTNERS

                                                                        22
We reached breakthrough results in 2018
In H1 we focused on building ELICA brand equity through the activation of our NEW BRAND CAMPAIGN and the presence at
SALONE DEL MOBILE & DESIGN WEEK
                                                                         AND ELICA REACHED IMPORTANT GOALS

       +5 POINTS OF        EXCELLENT MEDIA PRESENCE   VISITORS @ MILAN         A TV SHOW @ EUROCUCINA        COMPASSO D’ORO
     BRAND PREFERENCE                                   FUORISALONE                    BOOTH
                                  72 NATIONAL                                                              12 ADDITIONAL DESIGN
    BRAND IMAGE PROFILE       115 INTERNATIONAL        220,000 PEOPLE           FIRST TIME EVER DURING   AWARDS ACROSS THE RANGE
        IMPROVED              25 TIER 1 MEDIA MET     750 JOURNALISTS             SALONE DEL MOBILE
                                                        700+ GUESTS

                BUT WE WANT TO SPEAK LOUDER TO GET MORE VISIBILITY
                                                                                                                      23
To continue in H2 2018 and in 2019 with international
         deployment

                                   Print

TV 30’
OnlineVideo 60’
                                   Digital
                                                             24
2017-2019 Strategic Plan
Highlights
Key Drivers to Create Long Term Sustainable Value

LEVERAGE ON OWN
                            BUSINESS MODEL
BRAND
                            ENANCHING

                                           QUALITY
                                              &
                                           SERVICE
        MARKET

                                   ICT
                                 SYSTEMS

                                               OPERATIONS’
                                               EFFICIENCY

                                                             26
Strategic Levers of Business Plan
 1

         Disposal of non-performing German operation (Gutmann)
                                                                        ü
 2

                     Increase the B2C portfolio share
                                                                         ü
 3
        Transforming Distribution Model and Enlarging Geographical
                                 Presence                                ü
 4

     Technology Improvement – Standardization – Cost Competitiveness   Ongoing

 5

            Digital Business Model: Smart Products & Services          Ongoing

                                                                                 27
Strategic Plan Key Financial Statements
     Strong organic growth while increasing profit margins

                                                                  CAGR
                                                  2016A   2017A
                                                                  17-19E

     Net Sales                                    439.3   479.3
                                                                  5.6%
     YoY %                                                 9.1%

     EBITDA Adj                                   36.8    34.9
                                                                  12.3%
     % on NS                                       7.4%    7.7%

     EBIT Adj                                     13.7    16.3
                                                                  13.7%
     % on NS                                       3.1%    3.4%

     NFP
     NFP                                          60.8    69.3     73.0

     RONA*
                                                  2.1%    8.1%    10.0%
     Return on Net Asset
    * Calculate as EBIT on Net Capital Employed

                                                                           28
2017FY Guidance exceeded

      OBJECTIVES                                                                     Guidance                                             2017FY

      Group Net Sales growth                                                             +9%                                              +9.1%

      EBITDA Adj* growth                                                                +13%                                              +13.8%

      EBIT Adj* growth                                                                  +10%                                              +19.2%

      Net Financial Position                                                         74.8 €M                                              69.3 €M

      RONA**                                                                             7.0%                                              8.1%
     * Data adjusted by non recurring items, restructuring costs and non-ordinary charges ** Calculated as EBIT on Net Capital Employed

                                                                                                                                                    29
M&A

Project Omega:
Value Enhancing Transaction
Transaction Overview
                                   Joint Venture Agreement
                Elica                                               Indian Partner
                                                                                                               Transaction Highlights

                                                                                                 ● On June 1, 2018, Elica and its Indian Partner
         58.5%                                                              41.5%(1)
                                                                                                   approved the sale of 49% stake of Elica PB
                                                                                                   India Private Ltd (“Elica India”) to Whirlpool of
                                         Elica India
                                                                                                   India Ltd
        33% Stake                                                           16% Stake
 Cash
        Elica India                                                         Elica India
                                                                                          Cash   ● The transaction includes an exclusive
                                                                                                   distribution agreement for Whirlpool built-in
                                                                                                   cooking products in India
                                   Whirlpool of India Ltd
                                                                                                 ● Elica will maintain BoD control :
                                                                                                      – Elica will appoint 3 out of 5 directors,
                                       Post-Transaction
                                                                                                         including the Chairman and CEO
                                                                                                 ● Elica India will remain consolidated in Elica
             Elica                         Indian Partner
                                                                                                   Group financial accounts
          50%                                             50%                                    ● Enterprise value c.$48m (c. $15.9m cash-in of
                         Inter-shareholders                                                        which net cash-in for Elica $10.7m)
                             Agreement                         Whirlpool of India Ltd
                        Elica – Indian Partner                                                   ● Put / call agreement for 51% stake exercisable
                             51%                                           49%                     in 2021

                                                 Elica India
                                                                                                                                                   31
Clear Strategy to Exploit India Full Potential
    The transaction allows to consolidate Elica’s market leadership in India and to
                 maximise financial return related to Elica’s business

                    2018 – 2020                                            From 2021 Onwards
  ● For a 3 years period starting from closing date,    ●   In case Whirlpool or Elica decides to sell their stake to
     new distribution agreement to remain in place,         a third party tag along rights may be exercised;

  ● Elica India will become the exclusive distributor   ●   Put / call agreement for 51% stake exercisable in 2021.
     of all Whirlpool-branded built-in cooking
     products in India,

  ● Elica India will be the sole manufacturer of
     built-in Whirlpool’s products in India,

  ● Full range of cooking products with two
     complementary brands targeting different
     customers segments,

  ● The agreement will allow to exploit the full
     potential of the two brands and to deploy
     leading manufacturing capabilities to increase
     market penetration and consolidate the market
     leadership position in India.
                                                                                                                        32
Elica India: Successful Track-record
Achieved leadership position in less than 10 years from operations inception
                    Revenues Evolution (€m)                                                          EBITDA (€m) and EBITDA Margin Evolution
 CAGR 2011-2017: 21.7%                                                                            EBITDA Margin           7.0%      6.9%    6.9%   7.9%   14.3%   ● Significant track record of
                                                                                                                                                          3,5
                                                                              4   .0 %
                                                                                         24,3
                                                                                                                                                                    consistent growth and
                                                                       7   :3
                                                               -2   01
                                                     20
                                                          14                                                                                                        improved profitability
                                                 R
                                          C   AG                             16,8
                                                                                                                                                   1,3            ● Significant growth expected
                                                      12,7                                                                                   0,9
                                                                                                                            0,6       0,7
                                 9,0
                                        10,1                                                                                                                        to continue in the coming
              7,5      8,5
                                                                                                                                                                    years
   3,5
                                                                                                                  (0,5)
                                                                                                 (0,8)   (0,9)                                                    ● Long term profitability of >
  2010A 2011A 2012A 2013A 2014A 2015A 2016A 2017A                                                2010A 2011A 2012A 2013A 2014A 2015A 2016A 2017A                    15% EBITDA margin
                                                                                                                                                                  ● Leadership position in cooker
         EBIT (€m) and EBIT Margin Evolution                                                             PBT (€m) and PBT Margin Evolution
                                                                                                                                                                    hoods market share
EBIT Margin                   3.6%     3.7%          4.0%                   5.7%         12.6%    PBT Margin                        3.0%    2.3%   4.8%   11.4%

                                                                                          3,1
                                                                                                                                                                  ● High potential market with 7-
                                                                                                                                                          2,8
                                                                                                                                                                    8% estimated growth over the

                                                      0,5
                                                                              1,0                                                                  0,8              medium term
                                 0,3     0,4                                                                                          0,3    0,3

                                                                                                                            (0,2)
   (0,9)      (1,1)   (0,8)                                                                      (1,0)
                                                                                                                  (1,4)
                                                                                                         (1,7)
  2010A 2011A 2012A 2013A 2014A 2015A 2016A 2017A                                                2010A 2011A 2012A 2013A 2014A 2015A 2016A 2017A

                                                                                                                                                                                                   33
Extracting Value from the Indian Business
                                                 1

                                                        Recognition of a
                                                     premium valuation to
                                                     Elica business in India

5                                                                                              2
       Evidence of Elica’s                                                                         Monetisation of a
         capabilities and                                                                      minority stake allowing
        credibility to be a                                                                    enhanced strategic and
    reliable partner for large                                                                  financial flexibility for
      international players                                                                          Elica Group

                          4                                             3
                                                                            Potential sizeable future
                                  Enhanced market
                                                                              monetisation whilst
                                 leadership in India
                                                                              maintaining strong
                                enabling significant
                                                                              focus on the Indian
                              growth and profitability
                                                                                     market
                                                                                                                            34
H1 2018 Results
H1 2018 Highlights
§ 6th QTR of EBITDA Adj. growth
§ Elica Reported Sales +0.2% vs H1 2017
        §   +3.1% vs 2017 Net FX
        §   +5.5% vs 2017 @ constant perimeter

§ EBITDA Adj. 20,1 M€ (+9,2% vs H1 2017) @ 8.2% on Net Sales (+70 b.p. vs H1 2017)
§ EBIT Adj. 10,2 M€ (+28,8% vs H1 2017) @ 4.2% on Net Sales (+90 b.p. vs H1 2017)
§ Raw Materials cost increase and FX fluctuations completely offset trough Price/Mix and
  operational efficiency
§ Extraordinary “non cash” provision due to the opening of a preliminary voluntary insolvency
  procedure by Exklusiv Hauben Gutmann GmbH, impacting EBITDA/EBIT figures
§ Operating CF 16,3 M€ (6,9 M€ in H1 2017) financing New Product launch and production capacity
  increase
§ “Own Brand” business boosting in key product categories after enthusiastic customer
  feedbacks and high visibility @ April Eurocucina fair

                                                                                           36
Cooker Hoods Industry Unit Shipments
Volume Data_ Change % vs. Y-1         Q2 ‘18   H1 ‘18                                   Key evidence

         Western Europe               (0.5%)   (0.4%)

         Eastern Europe (incl. CIS)    3.2%     4.2%                    EMEA
                                                                        European positive demand driven by Eastern Europe –
         Europe                        1.1%     1.6%                    mainly thanks to Russia.
                                                                        WE keeps showing a slight deceleration due to German
                                                                        market stagnation and UK Brexit uncertainty.
       EMEA                            0.9%     1.3%

        North America                  2.8%     2.9%                    AMERICAS
                                                                        NA slight positive demand.
        Latin America                  1.2%     1.3%                    LA continues its recovery.

       AMERICAS                        2.2%     2.3%                    ASIA
                                                                        Asia-Pacific region shows a slight growth.
                                                                        India continues to drive Asia demand.
       ASIA                            0.3%     0.9%

       WORLD                           0.8%    1.3%

                                                Source: Elica Group Estimates                                                  37
Sales Key drivers
                 H1 2018                                                           Q2 2018

Change vs. Y-1                                                    Change vs. Y-1
                   €M            %                                                    €M       %

(Divestiture)      (5.8)        (2.4)%                           (Divestiture)        (3.1)   (2.5)%

Vol/Price/Mix      13.3         5.5%                              Vol/Price/Mix       6.7     5.4%

Currency           (7.1)        (2.9)%                           Currency            (3.6)    (2.9)%

Total               0.4         0.2%                             Total                0.0     0.0%

                    Consolidated Net Sales growing @ +5,5% vs 2017 Net of FX (*)
                                         (*) constant consolidation perimeter
                                                                                                       38
Sales Distribution
                             H1 2018 (M€)                                                                                              Q2 2018 (M€)
§   REGIONAL SALES DISTRIBUTION                                                                        §    REGIONAL SALES DISTRIBUTION
                                         175,5                         +4.8% vs. LY (+5.2% Net FX)                       72%                      89,8                          +4.3% vs. LY (+4.7% Net FX)
EMEA           72%                      167,5                                                          EMEA                                      86,2

                      35,4       -11,6% vs. LY (-1.8% Net FX)                                                            15%    18,1       -9.1% vs. LY (+0.8% Net FX)
AMERICAS       15%    40,0                                                                             AMERICAS                 19,9

                      32,3     +9,7% vs. LY (+18.4% Net FX)                                                                     16,4     +8.0% vs. LY (+16.4% Net FX)
ASIA           13%                                                                                     ASIA              13%
                      29,4                                                                                                      15,2

GUTMANN         0%                                                                                     GUTMANN            0%
                                                                                                                                 3,0
                       5,8                                             +0.2% vs. LY (+3.1% Net FX)                                                                              +0.0% vs. LY (+2.9% Net FX)

               100%                               243,3                                                                  100%                              124,4
TOT REPORTED                                      242,8                                                TOT REPORTED                                        124,3
                                           H1 2018        H1 2017                                                                                H1 2018       H1 2017

§   BUSINESS & BRAND (*)                                                                               §    BUSINESS & BRAND (*)
                                                                      +2.4% vs. LY (+5.9% Net FX)                                                                               +2.8% vs. LY (+6.3% Net FX)
                                                    208,4                                                                                                    107,4
COOKING         86%                                203,6                                                COOKING           86%                               104,5

                       34,8      +4.2% vs. LY                                                                                    17,0     +0.9% vs. LY
MOTORS          14%
                       33,4
                                                                                                       MOTORS             14%
                                                                                                                                 16,8

OWN BRANDS      47%              97,2                     +8.3% vs. LY (+12.1% Net FX)                 OWN BRANDS         47%                50,7                +7.6% vs. LY (+11.2% Net FX)
                                89,8                                                                                                        47,1

OEM             53%                111,2                    -2.3% vs. LY (+1.0% Net FX)                OEM                53%                56,7                    -1.1% vs. LY (+2.2% Net FX)
                                   113,8                                                                                                     57,4
                                              H1 2018       H1 2017                                                                                  H1 2018      H1 2017

                                                                              (*) 2017 Figures excluding Gutmann sales                                                                       39
EBITDA Adj - Key drivers
                       H1 2018                                Q2 2018
Change vs. Y-1                         Change vs. Y-1

   Volume/Price/Mix              +++      Volume/Price/Mix              +++
   Operations efficiency          +       Operations efficiency          +
   Currency                       -       Currency
                                                                         -
   Cost efficiency               --       Cost efficiency               --
   EBITDA Adj                    1.7      EBITDA Adj                    1.0

                                                                              40
H1 2018 EBITDA Adj à EBITDA
                               H1 2018                                                               Q2 2018
                                                             M€                                                                           M€
     % NS          8,2%              +60 bps        7,6%                    % NS          8,3%              +70 bps        7,6%
     25,0

                   20.1              +9,2%          18.4                    12,0
     20,0                                                                                 10.4              +10.6%          9.4
                    4,0                             1,3                     10,0
                                                                                                                            1,0
     15,0                                                                    8,0           4,0

                                                                             6,0
     10,0
                   16,1                             17,1
                                                                             4,0                                            8,4
      5,0
                                                                                           6,4
                                                                             2,0

      0,0                                                                    0,0
                  H1 2018                          H1 2017                               H1 2018                           H1 2017

                            EBITDA    ADJUSTMENT                                                   EBITDA     ADJUSTMENT

§ 4.0 M€ of extraordinary costs in H1 2018, related to the opening of a preliminary voluntary insolvency procedure by Exklusiv
  Hauben Gutmann GmbH
§ 1.3 M€ of extraordinary costs in H1 2017 mainly related to reorganization costs

                                                                                                                                     41
H1 2018 Consolidated Net Profit
                              H1 2018                                                                              Q2 2018
                                                                        M€                                                                                  M€
      2,5           2.4                                                                                   0.6
                                                                                                   0,6

      2,0                                                                                          0,5

                    1,3                                                                            0,4
      1,5
                                                       1.2                                         0,3
                                                                                                                                                 0.2
                                                                                                          0,5
      1,0                                                  0,3
                                                                                                   0,2

      0,5           1.0                                                                                                                          0,3
                                                           0,9                                     0,1

      0,0                                                                                          0,0    0,0
                                                                                                         H1 2018
                                                                                                                                                 0,0
                                                                                                                                            H1 2017
                  H1 2018                            H1 2017
                                                                                                  -0,1
                    Net Profit (Att. Group)   Minorities                                                  Net Profit (Att. Group)   Minorities

§ Adjusted Net Profit attributable to the Group : 4.0 M€ vs. 1.9 M€ H1 2017 (+117.9%)
§ Q2 Net Profit impacted by 3.0 M€ of extraordinary costs related to Exklusiv Hauben Gutmann GmbH

                                                                 (*) Break-even expected for Q4 2018                                                   42
H1 2018 - Consolidated Income Statement

        €M
                                                     H1 ’18                    H1 ’17                         %

        Net Sales                                     243.3                    242.8                       0.2%
        EBITDA Adj                                      20.1                     18.4                      9.2%
        %                                                8.2%                      7.6%                   60 b.p.
        EBITDA                                         16.1                       17.1                    (6.2%)
        %                                               6.6%                       7.1%                 (50 b.p.)
        EBIT                                            6.2                        6.7                   (7.0%)
        %                                               2.6%                      2.8%                  (20 b.p.)
        Net Result                                       2.4                       1.2                    96.9%
        %                                                1.0%                     0.5%                    50 b.p.

        EPS* – Euro cents                              1.67                       1.47                    13.6%

        * EPS as at June 30 is calculated by dividing the Net Result pertaining to the Group by the number of ordinary
          shares outstanding, excluding treasury shares at the same data.

                                                                                                                         43
H1 2018 Net Financial Position
                         H1 2018                                                        H1 2017

 69,3       16,3      14,2      2,9         0,3        69,9                                     4,2         0,5        70,6
                                                                 60,8                 13,0
                                                                             6,9

OPENING   OPERATING   CAPEX    OTHER      FX EFFECT   CLOSING   OPENING   OPERATING   CAPEX    OTHER      FX EFFECT   CLOSING
  NFP     CASH FLOW           FINANCIAL                 NFP       NFP     CASH FLOW           FINANCIAL                 NFP
                                ITEMS                                                           ITEMS

          Operating CF 16,3 M€ financing New Product launch and production capacity increase

                                                                                                                          44
Elica H1 2018: Takeaways

§ WW positive Market demand environment

§ “Own Brand” business boosting in key product categories after enthusiastic
  customer feedbacks and high visibility @ April Eurocucina fair

§ 6th QTR in a row of solid performance growth (EBIT Adj. +28,8% vs H1 2017)

§ Strong improvement in Operating CF

                                                                               45
Elica Shareholders
     Ordinary Shares
                              F.A.N. S.r.l.              52.81 %
                              Whirlpool EMEA S.p.A.      12.57 %
                              Elica S.p.A.                2.01 %
                              Francesco Casoli            0.25 %
                              Others                     32.36 %

                       TOTAL NUMBER OF SHARES:        63.322.800

                                                               46
Disclaimer
This presentation contains forwards-looking information and statements about Elica S.p.A. and its Group.
Forward-looking statements are statements that are not historical facts. These statements include financial
projections and estimates and their underlying assumptions, statements regarding plans, objectives and
expectations with respect to future operations, products and services, and statements regarding future
performance.
Although the management of Elica S.p.A. believes that the expectations reflected in such forward-looking
statements are reasonable, investors and holders of Elica are cautioned that forward-looking information and
statements are subject to various risk and uncertainties, many of which are difficult to predict and generally beyond
the control of Elica S.p.A.; that could cause actual results and developments to differ materially from those
expressed in, or implied or projected by, the forward-looking statements.
These risks and uncertainties include, but are not limited to, those contained in this presentation. Except as
required by applicable law, Elica S.p.A. does not undertake any obligation to update any forward-looking
information or statements.

Elica Investor Relations
Giulio Cocci - Group Controlling & Investor Relations Director
Francesca Cocco – Lerxi Consulting – Investor Relations
Tel: +39 (0)732 6104205
E-mail: investor-relations@elica.com

                                                                                                                   47
You can also read