Investor Presentation - Q2FY17 - The Byke Hospitality LTD
←
→
Page content transcription
If your browser does not render page correctly, please read the page content below
Investor Presentation
       Q2FY17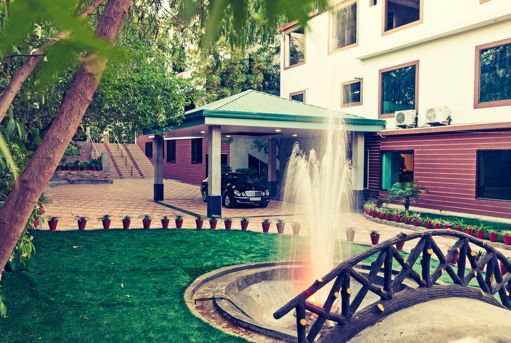
Agenda

         01   Byke Background and Overview

         02   Key Growth Drivers

         03   Hotel Segment (Owned + Leased)

         04   Room Chartering Segment

         05   Growth Strategy

         06   Q2FY17 Financial Highlights
Byke Background and Overview
Background and History

     History (Prior to 2010)         Acquisition (2010)              The Byke (Present)

                                 ! Current promoters acquired
   ! Formerly known as “Sauve      44.5% stake in the Company   ! Mr. Anil Patodia (Managing
     Hotels”                       in December 2010               Director and Promoter) had
                                                                  significant experience in the
   ! Started operations in the   ! 2 properties – Byke            hospitality industry – business
     year 2002                     Heritage Matheran and          of supplying recron pillows to
   ! Promoted by Mr.               Byke Suflower Goa (total       hotels
     Satyanarayan Sharma and       102 rooms)
                                                                ! Strong vision to be a leader
     family                      ! In August 2011 the Company     and preferred choice in the
                                   name was changed to “The       Hospitality Industry
                                   Byke Hospitality”

           No. of Hotels – 2                                            No. of Hotels – 11
          No. of Rooms – 102                                           No. of Rooms – 797
         Room Chartering - Nil                                  Room Chartering – ~5 lacs room nights

                                                                                   4                    4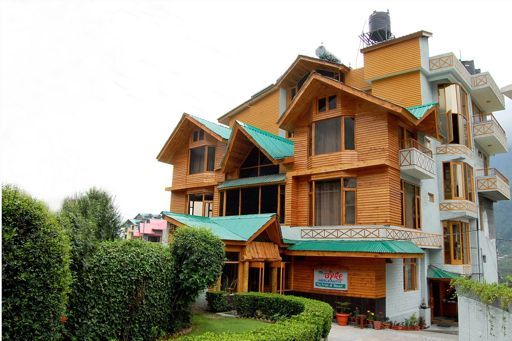
Evolved from Standalone Hotel Property …
2004-07 2010-12 2013-15 2016...
Acquired properties on More properties on Long Term Lease:
Hospitality services started Mr. Anil Patodia takes Long Term Lease:
with the acquisition of one operational charge & Thane (Mumbai)
hotel in Goa Rebranded as “The Byke” Goa (3rd property) Puri
(Byke Sunflower) Matheran
Acquired 2 more properties - Mumbai
Asset Light Model adopted Manali and Jaipur;
Acquisition of Byke through Long Term Lease & Jaipur To be operational in FY17
Heritage Matheran Room Chartering
Chartering business
Established Brand name in
achieved scale - More than
Acquired the largest Hospitality Sector
373,000 room nights in
property in the portfolio FY15 Strong marketing & distribution
The Byke Old Anchor, Goa network
on lease
Pan India Presence through Room
Chartering model
…to sizeable Hotel Portfolio & well known Brand in Industry
5 5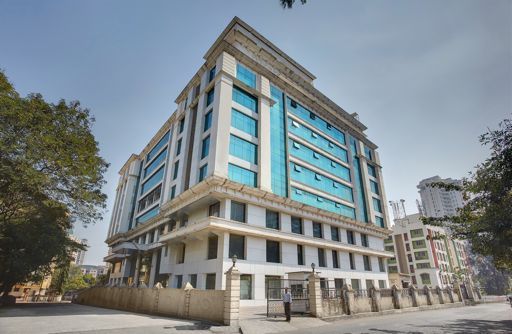
Experienced Management Team
                                                                Mr. Anil Patodia
                                                         Chairman and Managing Director

                                  • Provided strong and dynamic leadership to “The Byke” since 2011
                                  • A career Hotelier with an extensive experience in the Hospitality industry
                                  • His experience in operations and marketing is playing a key role in the global expansion and
                                    development of future hotels

               Mr. Suraj K Soni                                      Mr. Mihir Sarkar                              Mr. Ronald Masse

•   20 years of experience as a Hotel Executive      •   19 years of hands-on experience in the      •   Versatile hospitality professional and
                                                         hospitality industry                            dynamic manager with more than 20 yrs of
•   General Manager with proven brands such as                                                           experience
    Hilton, Wyndham Hotels, Sayaji Hotel and         •   Past management roles at Taj, Holiday Inn
    others                                               and ITDC                                    •   Worked with Group like Tunga &
                                                     •    Specialties:                                   Panaromic group of Hotels
•   Specialization in the management of large
    convention hotels, 4 & 5 Star Resorts & Hotels       "   Pre-opening Hotel Management            •   Specialties:

•   Proven track record of success in opening /          "   Vendor & Supplier Management                "   Hospitality Operations
    re-opening, major renovations and brand re-          "   MICE & Convention Management                "   Client Management & Relationship
    positioning                                                                                              Building
                                                                                                         "   Business Development

                                                                                                                                                    6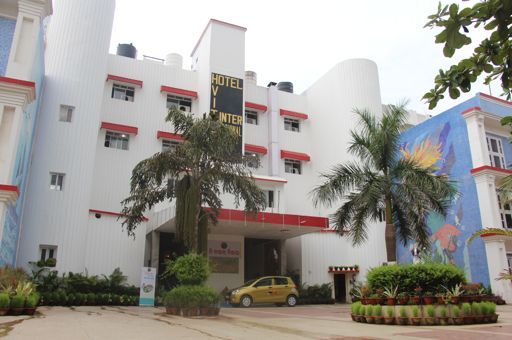
Supported by Independent Board of Directors

                             Mr. Sandeep Singh                                                                      Ms. Sudha Gupta
  •   A renowned media professional, author and management strategist                   •   A renowned Chartered Accountant & subject matter expert in
                                                                                            finance/ taxation
  •   Post-Graduation in Rural Development from Xaviers Institute of Social
      Science (XISS)                                                                    •   Wide experience in Corporate Taxtation, Tax Treaties & Companies
                                                                                            Act and vast knowledge in International transactions, FEMA & RBI
  •   Specialised in Media Planning from Mudra Insutitute of Communications
      & General Management from IIM, Bangalore                                          •   Previously worked in Deloitte and Rodl & Partner, been instrumental
                                                                                            in structuring and implementation of various cross border complex
  •   Author of various books. Some of his books are ‘Business of Freedom’,
      ‘Indian Ocean Strategy & ‘Simhavolokan’                                               transactions
                                                                                        •   Has authored book on Foreign Exchange Management Act, Due
  •   On the Advisory Board of The National Institute of Mass Communication
      & Journalism                                                                          Diligence under FEMA (CCH Publications) and Practical Aspects of FDI
                                                                                            in India (ICSI Publication)

         CA Ram Ratan Bajaj                                          Mr. Bharat Thakkar                                       Mr. Ramesh Vohra

  •   Fellow member of the Institute of                    •   Post graduate in Commerce and has               •   Successful businessman providing engineering
      Chartered Accountants of India                           cleared ICWA Intermediate                           solutions to the oil, gas, exploration, marine and
  •   Over 35 years of post- qualification                 •   He is an acknowledged expert in financial           construction companies
      experience                                               planning as well as insurance sector            •   Some of the major clients include ONGC and
  •   Expertise in handling finance, taxation,             •   Was earlier with New India Assurance and            the Indian Railways
      corporate law, accounts, project                         United India Insurance                          •   Member of the Lions Club for over a decade
      implementation

                                                                                                                                                                        7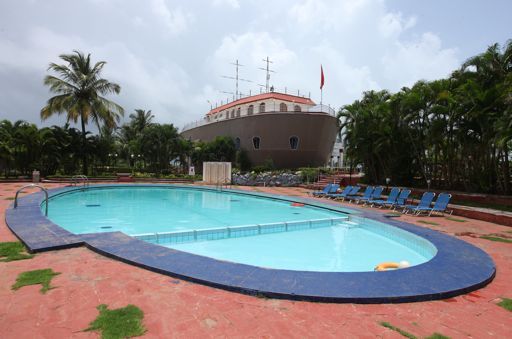
Awards and Accolades

                Featured in Forbes Asia’s “Best Under a Billion” for 2 consecutive years

   Achieved the distinction of being among the 11 companies from India that have made it to the top 200 Asia Pacific
                               corporations in Forbes Asia’s ‘Best Under a Billion’ list in 2015
   Featured again in ‘Best Under a Billion’ list in 2016; among the 7 companies from India that have made it to the list

                                 Award to promote vegetarian hotels in India

   Received an award for “BEST PURE VEGETARIAN HOTEL CHAIN IN INDIA” at 11th Hospitality India & Explore the
                            World Annual International Travel Awards, 2015, New Delhi

                                   CMD featured in Forbes June 2016 issue

   Forbes Asia June 2016 issue featured Chairman & Managing Director, Mr. Anil Patodia’s thoughts and future plans
                                                 for the Company

                                                                                                                           8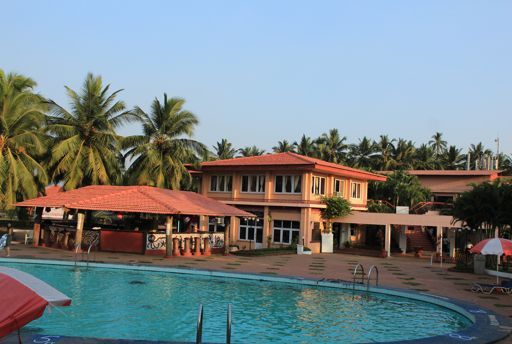
Business Overview
                  Hotel (Owned + Leased)                                         Room Chartering
   o Hotels under Brand name “The Byke”
                                                          o Third party hotel rooms chartered at strategically
   o Focus on domestic middle class leisure tourism         identified locations across India
   o Niche in Vegetarian segment                          o Capitalise on the diverse peak seasons across India
                                                               o Maximise occupancy (90%+)
   o Diversified revenue mix – Rooms, F&B, events, etc.
                                                          o Presence across 60 plus cities
   o 11 properties at tourist destinations in India:
                                                          o Relationships with 500+ hotel owners
     • 2 ownership; 9 on long term lease
                                                          o Network of 300+ agents
     • 797 rooms

                         Revenue Break-up                                        EBITDA Break-up
                     FY16 Total: Rs 2,315 mn                                     FY16 Total: Rs 526 mn

            Chartering                                              Chartering
              51%                                                     38%

                                                                                                         Hotel
                                               Hotel                                                     62%
                                               49%

                                                                                                                  9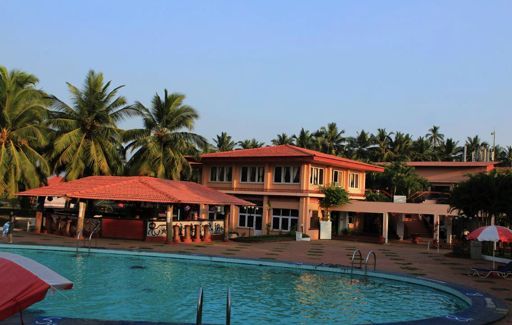
Pan-India Presence in Both Segments
         Hotel (Owned + Leased) Presence      Room Chartering Presence – 60+ cities

                           Current Presence
                           New Locations

                                                                       Cities

                                                                                      10
Key Growth Drivers
Key Growth Drivers

            Strong Industry Fundamentals
                                                                                                                                   01
            Robust demand outlook for the md market domestic tourism on the back of rising middle class and increasing
            discretionary spending

            Focused Strategy
            Mid market focused hospitality brand with focus on domestic tourism                                               02
            Niche in vegetarian segment
            Diversified revenue mix with focus on F&B, events (corporate and social)

            Asset Light Business Model
            Low capital expenditure leading to high return ratios (30%+ RoCE) and high cash flow generation              03
            Low debt (Debt/Equity of 0.1)

            Wide Distribution Network
            Tie-up with 300+ travel agents                                                                    04
            Enable to optimise occupancy in both segments

                                                                                                                                        12
1 Strong Industry Fundamentals
Share of tourists by expenditure
2013 2024
Foreign Tourist Foreign Tourist
19% 15%
Huge Potential of Domestic Tourism
Domestic Domestic
Tourist Tourist
81% 85%
Mix of middle class
1%
13% 7% 12% 20%
18%
32% 43%
Middle
Expanding Middle Class 51% 59% Class
36%
17%
1995 2005 2015 2025
< $1.8k $1.8-4k $4-20k >$20k
Growth in spending categories
% CAGR 16
14
12 12 12
10 10
6
Increasing Discretionary Spend 4
Total Consumer Spend Essential Consumer Spend Discretionary Consumer Spend
FY00-05 FY05-10 FY11-16CL
132 Focused Strategy
Mid market focused hospitality brand with focus on domestic tourism
Average Room Rent in Rs (Hotels segment)
o Domestic travellers have been the bedrock of demand for the Indian hotel industry
Domestic tourism continues to be over 80% of the total tourist expenditure in India 3,909
3,604 3,783
o A growing middle class has created demand for branded budget hotels for the
domestic travellers
o Byke has created a distinct brand in the budget hotels category
Niche in vegetarian segment FY14 FY15 FY16
o Restaurants/ Banquets in all hotels serve pure vegetarian food Hotel Segment Revenue Break-up
o Awarded for contribution to promote vegetarian hotels in India at 11th Hospitality
India & Explore the World Annual International Travel Awards FY16 Total: Rs 1,143 mn
F&B and
Events
Diversified revenue mix with focus on F&B and events 54%
o Increasing focus on diversified revenue streams including corporate events (meetings,
offsites) and social events (weddings, parties) to optimize occupancy and margins
o Restaurants/ conference rooms/ banquet halls & lawns across properties for social Rooms
46%
and corporate events
143 Asset Light Business Model
Low capital requirement as properties are taken on a long term lease
Asset Turnover
o Incremental room addition requires minimal capital employment; only capex
required for refurbishment and rebranding
1.6
1.4
o Enables the company to leverage high profitability from a low capital base 1.3
1.0
o Attractive cash flow generation and deleveraging profile
Impeccable return ratios with minimal level of debt FY13 FY14 FY15 FY16
Return on Equity (%) Return on Capital Employed (%) Debt/Equity
22 23
34
20 0.24
26
24
11 0.14
16
0.10
0.07
FY13 FY14 FY15 FY16 FY13 FY14 FY15 FY16 FY13 FY14 FY15 FY16
ROE = PAT / Average Net Worth; ROCE = EBIT / Average Capital Employed; Asset Turnover Ratio = Revenue/Average Total Assets
154 Wide Distribution Network
Pan-India presence through strong agent Number of Agents
network 326
o In hospitality, selling is the major constraint, which is mitigated 208
182
through tie-up with over 300 agents to sell owned + leased
hotel rooms as well as chartered rooms 134
o Pan-India network of agents
FY13 FY14 FY15 FY16
Enables to optimize occupancy levels
Hotels Segment Occupancy (%) Charter Segment Occupancy (%)
68 70 67 92 94 94
65 89
FY13 FY14 FY15 FY16 FY13 FY14 FY15 FY16
16… Driving Robust Growth
Rs Million
Revenue EBITDA PAT
2,315 526 259
1,814
1,556 373 200
159
287
1,009
173 78
FY13 FY14 FY15 FY16 FY13 FY14 FY15 FY16 FY13 FY14 FY15 FY16
32% 3 year CAGR 45% 3 year CAGR 49% 3 year CAGR
EPS* (Rs.) EBITDA Margin (%) PAT Margin (%)
6.47
5.00
3.97 23
21
17 18
1.94 11 11
10
8
FY13 FY14 FY15 FY16 FY13 FY14 FY15 FY16 FY13 FY14 FY15 FY16
*In FY15, Company has issued bonus shares in ratio 1:1; prior period EPS has been adjusted for the same
17Hotel Segment (Owned + Leased)
Portfolio of 797 Rooms Across 11 Properties

                       Number of Rooms and Properties                                                        No. of
                                                                        Hotel                     Location            Type
                                                                                                             rooms

   2            5                7      7      8        9      11       Byke Old Anchor             Goa       240     Leased

                                                                        Byke Suraj Plaza          Mumbai      122     Leased
                                                               797
                                                                        Byke Heritage             Matheran    80      Owned

                                                        677             Byke Grassfield            Jaipur     54      Leased

                                                                        Byke Vijoya                 Puri      54      Leased
                                               519
                                                                        Byke Hidden Paradise        Goa       40      Leased
                                 465    465

                385                                                     Byke Neelkanth             Manali     40      Leased

                                                                        Byke Redwood              Matheran    25      Leased

                                                                        Byke Sunflower              Goa       22      Owned

   102                                                                  Byke Grassfield Riviera    Jaipur     80      Leased
                                                                                                                                Yet to be
   FY11         FY12             FY13   FY14   FY15   FY16E   Present   Byke Delotel              Mumbai      40      Leased   operational

                                                                        Total                                 797

          Number of properties

                                                                                                                                    19
Leasing = Asset Light = Low Capex & Faster Rollout
Renovation and re-branding of hotel properties…
Leasing Renovation Re-branding
o Take property on long term o Re-brand as “Byke”
Lease o Renovation, interior decoration,
o Approx. 15-20 year commercial investment in amenities o Market to create awareness of
lease the property
o Focus on completing renovation
o Low capital requirement leading within rent-free period o Standardize systems and
to break-even at low occupancy processes
… leading to improvement in ARR and Occupancy
The Byke Old Anchor, Goa
Before Renovation After Renovation ARR (Rs.) Occupancy (%)
4,660
4,250 70 70
3,520 60
FY12 FY14 FY16 FY12 FY14 FY16
20Robust Growth – 25% CAGR
Rs Million
Hotel Revenue Lease Cost ARR (Rs.) Occupancy (%)
5% 6% 6% 8%
90
70
68 67
1,143 65
3,909
3,783
917 3,617
806 58 3,431
580 42
39
FY13 FY14 FY15 FY16 FY13 FY14 FY15 FY16 FY13 FY14 FY15 FY16 FY13 FY14 FY15 FY16
As % of Hotel Revenue Decline in Average occupancy in FY15 and FY16 due
to addition of new properties
25% 3 year CAGR Low lease cost as % of Rev Improving ARR Optimizing Occupancy
21Room Chartering Segment
Unique Value Proposition
What is Room                                                                        Number of Cities = Expanding Presence
 Chartering        Involves aggregation of hotel rooms through prior booking
                   of inventory with partial / full advance payments                                                         66

                                                                                                               48
                   This is done 3-4 months before the tourist season for the                          41
                   entire duration of the tourist season in a particular location        32

 Why Room          Scalable: Flexibility to quickly expand depending on tourist
 Chartering    1 trends
                                                                                               FY13    FY14   FY15    FY16

                   Risk mitigation: Pan India chartering depending on peak
               2   season; Strict quality checks while purchasing inventory                    Room Nights Sold (lacs)

                   Network effect: Sold onward to wide network of travel agents                                          4.90
               3 who sell to customers
                                                                                                               3.73
                                                                                                      3.45

               4 Synergistic: Gives insight on where to expand in hotel segment;        2.01
                   agent network helps maximizing occupancy for hotel segment

                   High returns: Discount leads to low break-even point; low
               5 capital employed yielding high returns
                                                                                               FY13    FY14   FY15    FY16

                                                                                                                                  23
Robust Growth – 40% CAGR
Rs Million
Room Chartering Revenue Gross Profit and Margin ARR (Rs.) Occupancy (%)
14% 14% 16% 17%
2,404 2,388
1,172 92 94 94
89
193
2,175
2,131
897
143
750
107
429
60
FY13 FY14 FY15 FY16 FY13 FY14 FY15 FY16 FY13 FY14 FY15 FY16 FY13 FY14 FY15 FY16
Gross Profit: Revenue – (Chartering Cost + Occupancy
Loss + Agent Commission)
40% 3 year CAGR Improving Margins Optimizing ARR Maximizing Occupancy
24Growth Strategy
Growth Strategy

            Pan India Presence with 25 properties by 2020…
       01   Expand current portfolio from 11 properties to 25 by
            FY20; 8 properties to be added over FY17-18

            Opportunistic room chartering…
       02   Grow this segment in equal proportion by capitalizing on
            diverse seasons across India

            Continue focus on being asset light…
       03   New properties to be taken on long term lease thus
            minimizing capital requirement and yielding better returns

            …To drive growth and profitability going forward
       04   Grow revenue at over 20% CAGR to reach Rs 5,000
            million by FY20

                                                                         26
Added 2 New Properties in Q2FY17
Added properties in the existing locations of Mumbai and Jaipur…
… highlights strong demand potential in these cities…
… and increasing acceptability of the “Byke” brand
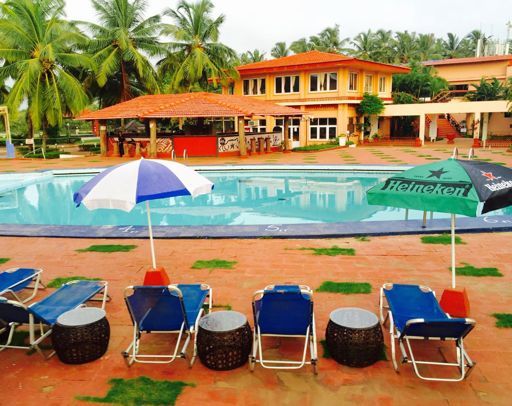
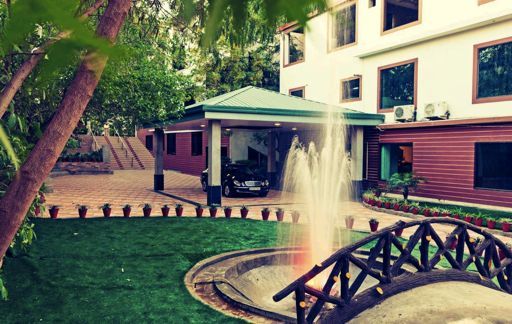
The Byke Grassfield Riviera, Jaipur The Byke Hotel Delotel, Mumbai
o Hotel taken under long-term lease
o Hotel taken under long-term lease
o Has 40 rooms
o Has 80 rooms
o Has banquet halls and conference rooms
o Has banquet halls, conference rooms and a party lawn
o Targets high density residential population of Borivali –
o Targets religious & leisure tourists; Jaipur is a prominent
specifically for events including social events (birthdays,
location for destination weddings & other such events
weddings, parties) & corporate events
27Identified 8 Locations for the Next Phase of Growth
Coveted location for a quick
Lonavala weekend getaway for the Mumbai
Blend of old-world charm, natural
Dalhousie Mahabaleshwar beauty and modernity
Chandigarh
Best-planned city in India, epitome
Darjeeling
Chandigarh of modernization and natural beauty
Jodhpur Gangtok
Udaipur Situated in the western Himachal
Dalhousie Pradesh, prominent hill station
Traditional city with beautiful
Lonavala Jodhpur palaces and forts
Mahabaleshwar
‘The Venice of the East’ is one of the
Udaipur most beautiful places of Rajasthan
Hill station in East India surrounded
Darjeeling by tall Himalayan mountains
Ambience of tradition and
Gangtok modernity; stupas and monasteries
28Financial Highlights Q2FY17
Income Statement – Q2FY17

    Rs. Mn                        Q2 FY17   Q2 FY16   Y-o-Y Growth   HI FY17    H1FY16   Y-o-Y Growth
    Hotel Revenue                 227.4     177.0        28%          512.9     412.1       24%
    Chartering Revenue            308.5     277.3        11%          642.0     523.4       23%
    Revenue                       535.9     454.3        18%         1,154.90   935.5       23%

    Operating and Other expense   392.4     339.2        16%          860.9     711.4       21%

    Employee Expense               21.9      13.8        58%           43.7      25.1       74%
    Total Cost                    414.3     353.0        17%          904.6     736.5       23%
    EBITDA                        121.6     101.0        20%          250.3     198.9       26%

      EBITDA margin               22.7%     22.2%                     21.7%     21.3%

    Depreciation                   30.1      22.9        31%           58.3      45.6       28%
    Net Interest Cost              3.1       4.0         -22%          6.3       8.1        -22%
    Other Income                   0.3       0.4         -12%          0.7       0.7         -7%
    PBT                            88.7      74.4        19%          186.4     146.0       28%
    Tax                            30.7      25.8        19%           64.5      50.5       28%
    PAT                            58.0      48.7        19%          121.9      95.4       28%
      PAT margin                  10.8%     10.7%                     10.6%     10.2%

                                                                                                        30
Balance Sheet
Rs. Mn Sept’16 Mar’15 Rs. Mn Sept’16 Mar’15
Share Capital 400.9 400.9 Net Block + CWIP 893.9 873.6
Reserve and Surplus 932.6 810.6 Other Non-Current Assets 16.1 16.1
Net Worth 1,333.5 1,211.6 Long Term Loans and Advance 110.3 85.9
Long Term Borrowings 12 21.7 Total Non current assets 1,020.4 975.6
Deferred Tax Net 78.2 66.2 Inventories 74 62.3
Other non-current liabilities 3.9 3.3 Debtors 196.4 176.8
Total Non-current liabilities 94.1 91.3 Cash and bank 41.8 28.7
Short term borrowings 59.9 60.7 Other Current Assets 1.1 0.4
Other current liabilities 219.3 232.1 Short Term Loans and Advance 373.1 351.8
Total Current liabilities 279.2 292.8 Total Current Assets 686.4 620.1
TOTAL LIABILITIES 1,706.8 1,595.7 TOTAL ASSETS 1,706.8 1,595.7
31Lease Business – Q2FY17
Number of rooms* Occupancy (%)
677
56%
623
51%
Q2FY16 Q2FY17 Q2FY16 Q2FY17
ARR (Rs) Revenue (Rs Mn)
2,955 3,052
F&B/ Events Rooms
107
74
103 121
Q2FY16 Q2FY17
Q2FY16 Q2FY17
* Added 2 properties post Q2FY17; Currently 11 properties with 797 rooms
32Chartering Business – Q2FY17
Number of room night (In Lacs) Occupancy (%)
1.29
1.12 94% 95%
Q2FY16 Q2FY17 Q2FY16 Q2FY17
ARR (Rs) Revenue (Rs Mn)
2,452 2,384 308
277
Q2FY16 Q2FY17 Q2FY16 Q2FY172
33“The BYKE” Hotel Portfolio
The Byke Old Anchor, Goa The Byke Suraj Plaza, Thane The Byke Heritage, Matheran
No. of 240 No. of 122 No. of 80
Rooms Rooms Rooms
Type Leased Type Leased Type Owned
The Byke Grassfield Riviera, Jaipur The Byke Grassfield, Jaipur The Byke Vijoya, Puri (Odisha)
No. of 80 No. of 54 No. of 54
Rooms Rooms Rooms
Type Leased Type Leased Type Leased
Property in Mumbai is not included here as it is yet to be operational
34“The BYKE” Hotel Portfolio
The Byke Neelkanth, Manali The Byke Hidden Paradise, Goa
No. of 40
No. of 40
Rooms
Rooms
Type Leased
Type Leased
The Byke Redwood, Matheran The Byke Sunflower, Goa
No. of 25 No. of 22
Rooms Rooms
35
Type Leased Type Owned
Property in Mumbai is not included here as it is yet to be operationalSafe Harbor
This presentation and the accompanying slides (the “Presentation”), which have been prepared by The Byke Hospitality Limited (the “Company”), have been prepared solely for information
purposes and do not constitute any offer, recommendation or invitation to purchase or subscribe for any securities, and shall not form the basis or be relied on in connection with any contract or
binding commitment whatsoever. No offering of securities of the Company will be made except by means of a statutory offering document containing detailed information about the Company.
This Presentation has been prepared by the Company based on information and data which the Company considers reliable, but the Company makes no representation or warranty, express or
implied, whatsoever, and no reliance shall be placed on, the truth, accuracy, completeness, fairness and reasonableness of the contents of this Presentation. This Presentation may not be all
inclusive and may not contain all of the information that you may consider material. Any liability in respect of the contents of, or any omission from, this Presentation is expressly excluded.
Certain matters discussed in this Presentation may contain statements regarding the Company’s market opportunity and business prospects that are individually and collectively forward-looking
statements. Such forward-looking statements are not guarantees of future performance and are subject to known and unknown risks, uncertainties and assumptions that are difficult to predict.
These risks and uncertainties include, but are not limited to, the performance of the Indian economy and of the economies of various international markets, the performance of the industry in India
and world-wide, competition, the company’s ability to successfully implement its strategy, the Company’s future levels of growth and expansion, technological implementation, changes and
advancements, changes in revenue, income or cash flows, the Company’s market preferences and its exposure to market risks, as well as other risks. The Company’s actual results, levels of activity,
performance or achievements could differ materially and adversely from results expressed in or implied by this Presentation. The Company assumes no obligation to update any forward-looking
information contained in this Presentation. Any forward-looking statements and projections made by third parties included in this Presentation are not adopted by the Company and the Company
is not responsible for such third party statements and projections.
For more information, please contact:
Company : Investor Relations Advisors :
The Byke Hospitality Ltd.
CIN: L67190MH1990PLC056009 Stellar IR Advisors Pvt. Ltd.
CIN: U74900MH2014PTC259212
Neha Mankame
Pooja Dokania
cs@thebyke.com
dpooja@stellar-ir.com
www.thebyke.com
www.stellar-ir.comYou can also read