A Demographic Approach to Evaluate the Development of Tourism Industry of Mainland China
←
→
Page content transcription
If your browser does not render page correctly, please read the page content below
Open Journal of Social Sciences, 2018, 6, 33-49
                                                                                                   http://www.scirp.org/journal/jss
                                                                                                              ISSN Online: 2327-5960
                                                                                                                ISSN Print: 2327-5952

A Demographic Approach to Evaluate the
Development of Tourism Industry of Mainland
China

Junjian Lin

School of Management, Jinan University, Guangzhou, China

How to cite this paper: Lin, J.J. (2018) A      Abstract
Demographic Approach to Evaluate the
Development of Tourism Industry of              As the tourism industry shows a noticeable impact on the social and economic
Mainland China. Open Journal of Social          environment in China, it is essential to study how this industry has influenced
Sciences, 6, 33-49.                             the country. This paper discusses the relationship between some of the fea-
https://doi.org/10.4236/jss.2018.63004
                                                tures of demographics and the development of tourism in China in recent
Received: February 13, 2018                     years to evaluate the development of tourism in China. A province-level panel
Accepted: March 13, 2018                        dataset is constructed from the related statistical yearbook to be applied to a
Published: March 16, 2018                       pooled, fixed effect and random effect model respectively to check the correla-
                                                tion between the demographics features and development of tourism. As the
Copyright © 2018 by author and
                                                result shows, the fast development of tourism has a highly positive correlation
Scientific Research Publishing Inc.
This work is licensed under the Creative        with urbanization process in China. However, the rapid growth in tourism
Commons Attribution International               seems to be negatively correlated with local total fertility rates. And to the side
License (CC BY 4.0).                            of mortality rate, the rise of tourism sometimes even has a significant adverse
http://creativecommons.org/licenses/by/4.0/     effect, which means the development of the tourism industry will have the
               Open Access
                                                impact for increasing mortality of that province. Those exciting results show
                                                that the tourism development in mainland China in the past few years, espe-
                                                cially after the global financial crisis in 2008, could be quite challenging to the
                                                sustainable development of the Chinese economy. The economic structure of
                                                the industry of tourism in China still needs to be improved to achieve a better
                                                goal to benefit the nation with a long-term goal.

                                                Keywords
                                                Tourism Development, Urbanization, Demographic Evaluation, China, Scale
                                                Economy

                                              1. Introduction
                                              It is essential to understand the development of tourism industry of a country.

DOI: 10.4236/jss.2018.63004       Mar. 16, 2018                    33                                Open Journal of Social Sciences
J. J. Lin

                              As pointed out by the World Tourism Organization (UNWTO) [1], tourism is
                              an economic and social phenomenon which is a key driver for the increasing
                              economic growth in the world. In the meanwhile, tourism helps to provide more
                              employment in many sectors, such as hotel industry, airline transportation, tra-
                              vel insurance, and telecommunications sectors. According to China National
                              Tourism Administration [2], the overall contribution of tourism to GDP in 2017
                              was RMB 9.13 trillion, accounting for 11.04% of the total GDP. 79.9 million
                              people worked in the tourism industry directly or indirectly, accounting for
                              10.28% of China’s working population. The growth of the number of interna-
                              tional tourists becomes one of the most prominent features in the global tour-
                              ism. According to UNWTO statistics, the international tourist arrivals grew by
                              4.6% in 2015 to 1184 million and brought 1.5 trillion U.S. dollars in export
                              earnings. Mainland China (hereafter, referred to mainland China, not including
                              Hong Kong, Macaw and Taiwan), the largest developing country in the world
                              with one of the highest GDP growth of the world in the recent decades, has also
                              experienced this rapid upward sloping tourism growth with more than 3 billion
                              of domestic travelling trips of 2013 than that of 1996 [3].
                                However, it is ambiguous to see if the industry has generated purely benefit of
                              the economy in China or produced negative externalities to the society as well.
                              On one hand, it indeed has generated more GDP and more employment posi-
                              tions in the related fields with larger inflows of tourism both from domestic and
                              international countries or regions in mainland China over the past few decades.
                              Zhao et al. estimated from their quantitative analysis that the tourism industry
                              has increased employment directly in China by using the panel data by prov-
                              ince-level from 1999-2014 [4]. On the other hand, there is always argument in
                              the literatures about the negative impacts of the development of tourism, as
                              shown in the study [5], to the economic costs and negative socio-psychological
                              impacts. However, this has not been stressed so much in mainland China before.
                              In another word, it is time to investigate the impacts of the development of tour-
                              ism industry to give the evaluation about whether it has more positive effects or
                              more negative effects to the society.
                                There are more reasons to choose mainland China, which is the second largest
                              economy of the world with the largest population group, as the targets to carry
                              out this study are following. One of the recent but important social phenomena
                              in mainland China is the low total fertility rate, which has been lasting for many
                              years after the famous “One-child Policy” starting from the 1970s of the central
                              government of China. As the Department of Social Affairs of the United Nations
                              pointed out [6], within seven years, the size of the population of China will be
                              surpassed by the size of the population of India. Lower fertility rate also brought
                              concerns about the aging population structure as pointed by Feng et al. in 2013
                              [7]. The government started to relax the restriction of the one-child policy and
                              carried out two-child policy in China in recent years. However, the reform of the
                              fertility policy does not cause the enthusiasm of the residents for giving more

DOI: 10.4236/jss.2018.63004                         34                               Open Journal of Social Sciences
J. J. Lin

                              births to the family. Surveys and data show that the two-child new fertility policy
                              fails to increase the speed of gaining of the national population [8]. The reasons
                              behind the phenomenon that why people do not want to make the new policy
                              work could be complicated and mysterious, but the results of the little effect of
                              the new fertility policy will not solve the problem that the shortage of the labor
                              of China. The discussion from any related aspects that could explain the puzzle
                              would be a break-through not only in the literature but also to the practical parts
                              of the goal of sustainable development of the country. Therefore, it is essential to
                              study any economic sector, which could affect the amount of employment and
                              the increase of the net population growth in China.
                                In this sense, this paper strives to combine the two big aspects of the economy
                              of China: tourism industry and demographic features to give the evaluation of
                              the development of the tourism industry in China. This study is also among the
                              first paper attempts to evaluate how the tourism industry affects the society from
                              the demographic aspects: urbanization (internal migration inflows), total fertili-
                              ty, mortality mainly after the 2008 global financial crisis to see the correlation. A
                              panel-dataset structure is used to conduct an empirical regression model for the
                              study of this topic. In the following section, related literatures will be reviewed.
                              In the third section, this paper will introduce the constructed dataset and the
                              associated variables for this research. In the fourth section, economic models will
                              be set up from both structural sides and empirical sides to conduct the analysis
                              of the relationship of the tourism industry and demographic features in China
                              from 2007-2013. Finally, this paper gives the conclusion of the study.

                              2. Literature Review
                              There is plenty of research to investigate the relationship between tourism and
                              demography. For example, in the book of Smith, Karen, et al. in 2011 [9], they
                              discussed that the demographic pattern will shape and change the demand and
                              supply of the tourism, which will further change the pattern of an economy.
                              Another paper from Casagrande in 2016 [10] argued about the challenges of the
                              demography brought by the nearby tourism industry. It was argued in the paper
                              that the influx of the tourists brought difficulty in protecting the local heritage
                              and environment in Venice. However, they did not include the aspects of the in-
                              flows of the tourists, the expenditures of the international tourists, together with
                              the revenues generated by the tourism industry to discuss both the positive ef-
                              fects and negative effects. Also, they were focusing on either the entire trend of
                              the world or some cases of the development countries in their studies.
                                Mainland China is the largest developing country in this world with the larg-
                              est population. However, in Haft’s book, he mentioned that there is hidden truth
                              about the China’s economy miracle, which could make this country never catch
                              up with the US economy [11]. Yet it would be interesting to check how the tour-
                              ism industry has developed during the period of rapid economic growth of Chi-
                              na in the past. To evaluate the aspect of the tourism development in China, re-

DOI: 10.4236/jss.2018.63004                         35                               Open Journal of Social Sciences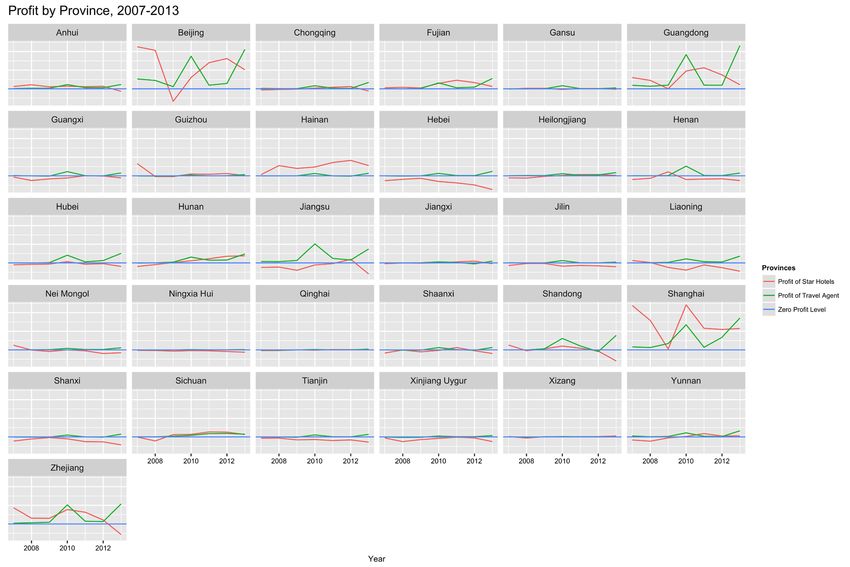
J. J. Lin

                              searchers also followed the relationship of the tourism industry and demograph-
                              ic features in China, especially urbanization in China, to carry out the study. For
                              example, the paper written by Luo, Qiu and Lam in 2014 studied the urbaniza-
                              tion impacts on tourism development in four regions Guangdong province [12].
                              The paper also provides the panel data study of Guangdong province from 1996
                              to 2011. However, there is lack of the analysis of the tourism industry with fertil-
                              ity and mortality status in China for the current period. Why would we care
                              about this relationship? First, we would like to know if the development of tour-
                              ism industry could be the shock, especially the inflows of the international tour-
                              ists could impact the low fertility decisions made by each family. Evidence by
                              Jones and Schoonbroodt in their 2010 paper showed [13] that historically the
                              fertility rates of the United States were positively correlated with the productivity
                              by using the quantitative calibration of a dynamic model. Following this logic, if
                              one can show that the productivity of the tourism industry can at least have the
                              same fluctuation with the fertility, it means that in the necessary conditions, the
                              development of the tourism industry could be accessed with the sign of the cor-
                              relation inversely. Second, the mortality rate is the weighted average of different
                              groups of populations, which are usually grouped by infant group, under
                              five-year-old children group, adolescent group, adult group [14]. Notably, many
                              researchers have been using the indicator of infant mortality rate and the un-
                              der-five children mortality rate as an instrument to see the degree of environ-
                              mental policies, pollution, and development of a region [15] [16] [17]. The ma-
                              jor countries have already put the goals of decreasing the infant mortality rate
                              and the under-five mortality rate on the Millennium Development Goals
                              (MDGs) to achieve the success of the sustainable development [18]. A paper of
                              Pierce and Schott in 2016 of NBER [19] even conducted the positive correlation
                              between the external economic shock with the suicide rate, also along with the
                              drop of the employment supply. If there could be a study of China combine the
                              development of tourism industry as an external shock with the demographic
                              features, it could answer the questions of how the tourism industry in China
                              impact the environment (as stated by Wang et al. [20], the tourism sector holds a
                              negative effect on the utilities of the residents), human social activities and if the
                              current tourism industry creates negative externalities towards to society. How-
                              ever, a national-wide time series study has not been applied to China to analyze
                              the relationship between the tourism industries and demographic features in
                              China in empirical work.
                                In this paper, the primary objective is to use the panel data sets of China con-
                              taining both demographic characteristics and tourism economic indicators to
                              examine the relationship of the two. Moreover, this paper provides the quantita-
                              tive analysis of the tourism industry to firstly show the scale of this sector of
                              China for further study of the literature. The significant contribution of this
                              study is as follows: first, this article constructs the panel dataset from China Sta-
                              tistical Yearbooks and The Yearbook of China Tourism Statistics and Supple-

DOI: 10.4236/jss.2018.63004                         36                                Open Journal of Social Sciences
J. J. Lin
ment. Second, this study analyzes the development of tourism with the demo-
graphic features with the quantitative analysis of the degree of the economic
scale of that industry.
3. Data
The data that this study uses to develop the evaluation of the tourism industry of
China in the past decades come from two recourses. First, the data are from the
Yearbook of China Tourism Statistics and the supplement of the Yearbook of
China Tourism Statistics from 2007 to 2013 published by the National Tourism
Administration of the People’s Republic of China. The series of the materials
fully provides the information of the development of the tourism industry of
China yearly and is the good resource for researchers to dig out more behind the
phenomenon. Second, this paper uses the China Statistical Yearbook conducted
by the National Bureau of Statistics from 2007 to 2013 to construct the demo-
graphic related datasets. In the following section, this paper will introduce
groups of variables from each dataset for this paper.
3.1. The Yearbook of China Tourism Statistics and Supplement
2007-2013
There are two Statistical Yearbooks published by the National Tourism Admin-
istration of the People’s Republic of China each year to provide the related tour-
ism datasets. From the Yearbook of China Tourism Statistics, this study chooses
the panel variables of the income from the international tourists to each prov-
ince in China from 2007-2013. The reason to choose this variable fit the global
trends and characteristic of the development of tourism industry: the increasing
trend of tourism trips by international tourists all over the world. From the sup-
plement of the Yearbook of China Tourism Statistics, this study chooses the
panel variables related to the economic indicator of two big groups of tourism
industry: the star-level hotels and the travel agencies. The first group of variables
is the revenues earned by each of the two groups each year by each province. The
second group of variables drawn is the profits received by both star-level hotels
and travel agencies by province from 2007 to 2013. The third group of the va-
riables is the returns of the total productivity by every province in each year. The
fourth group of variables is the average-level of the total labor employment of
either star-level hotels or travel agencies each year by province level.
To understand the status of the development of the two big sectors (star-level
hotels and travel agencies), this study puts the time series trend of the panel data
group in Figure 1. It is very clear in the graph in province level, the development
of the tourism industry has not been always promising in China. Beijing,
Guangdong and Shanghai always have some positive profits in both star-hotel
department and the travel agency sector. However, most of the provinces in
China showed some negative of the profits in the development of the tourism
industry by their two biggest sectors. It is not easy to distinguish the effect of the
DOI: 10.4236/jss.2018.63004 37 Open Journal of Social SciencesJ. J. Lin
Figure 1. Profits of Star-level Hotels and Travel Agent in Each Province 2007-2013. Note: As shown in the figure, the blue line
labels the zero-profit level. From year 2007 to 2013, not every time, every sector of the tourism industry can always bring some
positive profits back to that province, except to Beijing, Guangdong and Shanghai.
development of the tourism industry on other fields directly since there exists
inconsistency of the trend across the provinces in China in the past few years. To
better understand the logic behind these numbers and trends, the economic
models need to be applied to give a further analysis.
3.2. Demographic Features: From China Statistical Yearbook
2007-2013
From the China Statistical Yearbook, one could obtain the time series variables
related to demographic feature by province in China. The chosen variables are:
total population by each province, urban population by each province, total fer-
tility rate (per thousand) by each province, mortality rate by each province from
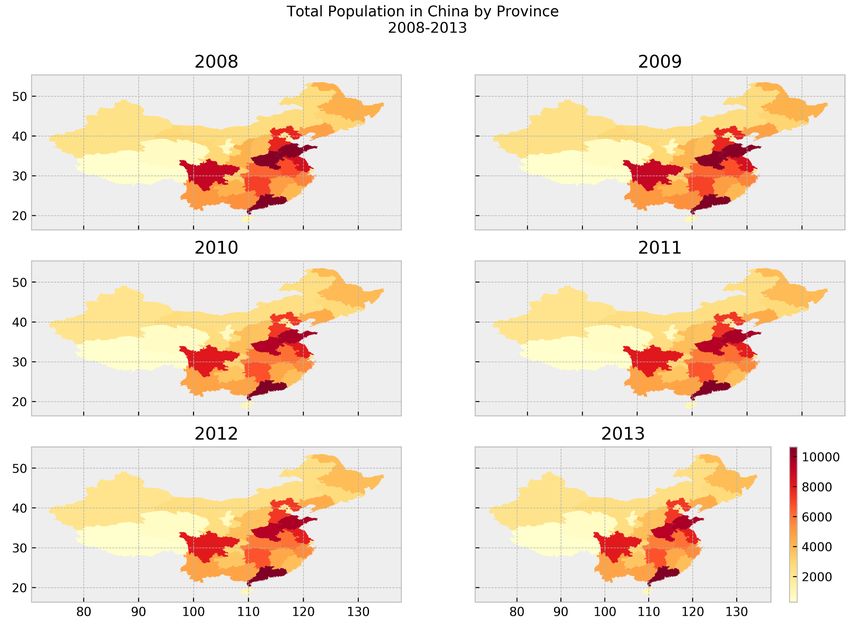
2007 to 2013. From Figure 2 and Figure 3, we can observe the spatial distribu-
tion of the total population and urbanization process by province in each year
respectively. Furthermore, by the changes of trends in numeric term, this paper
puts the time series trend of the ratio of urbanization in each province in Figure
4. As shown in the pictures, the gains of the total population in China in the past
few years were not that much, however, the urbanization achieved a steady and
an increasing progress by almost every province in China, except for Xizang
DOI: 10.4236/jss.2018.63004 38 Open Journal of Social SciencesJ. J. Lin
Figure 2. Total Population Spatial Distribution by Each Province in China 2007-2013.
Figure 3. Urbanization Level Spatial Distribution by Each Province in China 2007-2013.
Province. That fits the facts described before. While small changes hold in the
total population in China, the urbanization process goes fast in the past years.
However, that will leave the puzzle to the problem about the lack of labor supply.
The next step is to check the total fertility rate and mortality rate to give the pic-
ture of the main demographic picture in China.
In Figure 5, you can find out the total fertility rate and mortality rate of each
DOI: 10.4236/jss.2018.63004 39 Open Journal of Social SciencesJ. J. Lin
Figure 4. Urbanization Level Ratio Trend by Each Province in China 2007-2013.
province at the same time from 2007 to 2013. The situations vary hugely from
province to province about the changes of the fertility rate, while some provinces
steadily hold the decreasing fertility rate (such as Guangdong and Ningxia), but
other provinces have been applying the increasing total fertility rate such as Hu-
nan and Hubei. These facts will keep adding the ambiguity about the topic we
are discussing here: what is the relationship between the development of the
tourism and the changes of the features of demographics? Is there any correla-
tion between some of the big aspects of the two groups? If so, how would we
evaluate the relationship between the two?
In the next section, a structure model will be set up to reveal how the industry
of the tourism developed by itself, that is, is it behaving as a scale economy or
not.
4. Models and Results
In this section, this paper uses two sub sections to describe the evaluation of the
tourism industry in China, and presents the main results coming from each of
the models.
4.1. Scale Economy Quantitative Analysis
In the theory of Microeconomics, we learned that if an economy holds an
DOI: 10.4236/jss.2018.63004 40 Open Journal of Social SciencesJ. J. Lin
Figure 5. Total Fertility Rate and Mortality Rate by Each Province in China 2007-2013.
increasing return to scale, it must has
( input )
input alpha ∗ Q > input ∗ Q . (1)
input
In this sense, let us simply assume that the input is labor related (of course) of
each of the big sector of tourism industry: star-level hotels and travel agencies. In
that sense, with the variable we choose in the Section 3.1, we can start to evaluate
if the economy of the tourism industry is increasing scale to economy, decreas-
ing scale to economy or constant scale to economy by checking if the alpha value
is greater than 1, less than 1 or equal to 1. After divide the returns of the total
productivity by the average-level of the total labor employment of either
star-level hotels or travel agencies each year by province level respectively, a
panel sequence of results are shown in Figure 6 to give the idea about the basic
structure of the industry of the tourism in China. However, the results do not
show a very exciting news about the efficiency of the tourism industry in China.
Except for the beginning of the investigating period (2007-2013) in Shandong
Province, and recent development in Hubei Province, the economy scale of both
the two sectors in tourism industry behave in a slightly decreasing scale to the
economy. Combined with the negative profits from the two sectors as it is ob-
served in the last section, it is not difficult and is reasonable to make a simple
DOI: 10.4236/jss.2018.63004 41 Open Journal of Social SciencesJ. J. Lin
Figure 6. Economic Scale of the Tourism Industry by Each Province in China 2007-2013.
conclusion. The lack of efficiency of the tourism industry is one of the reason
why the profits of this industry are not always positive all over the country in the
past few years. But to further understanding how this inefficient tourism indus-
try could affect the demographics features, I mean, the urbanization process and
the fertility behaviors of residents in China, in the next sub section, the regres-
sion models could provide a deeper and cleared view for this evaluation.
4.2. Regression Models
To run the regression of the panel data sets, this paper selects the group of linear
regression models containing pooled regression model, fixed effect model and
random effect model to test the group of variables chosen above respectively for
this study. The basic structure of the panel data model is the following:
α it + β T xit + uit .
yit = (2)
When α it = α i without the varies from the time, it is a pooled linear regres-
sion model. When we assume that the basic linear model behaves in the follow-
ing:
yit = α it + β T xit + ui + ε it . (3)
When α it = α i for each t and there is correlation between xit and ui , it is a
DOI: 10.4236/jss.2018.63004 42 Open Journal of Social SciencesJ. J. Lin
fixed model; on the other hand, when α it ≠ α i and there is no correlation be-
tween the regressors and the individual specific variable ui , it is a random effect
model. The Hausman test model is applied between the fixed effect model and
the random effect model. The group of the regressions is shown now.
4.2.1. Fertility V.S. Tourism Development
The first regression is the pooled regression model, which is
log ( Fertility )it =
α i + β1 log ( income from international tourists )it + ε it (3)
The results are shown in Table 1. It is shown that the 1unit increase on the
growth of the income from the international tourists by each region will drop
the growth of the local fertility by 6%. The results from the fixed effect model
and random effect model do not give a significant value on the regressors, so the
conclusion is that the increasing inflows of the outside international tourism will
decrease the local fertility rate significantly.
4.2.2. Mortality VS Tourism Development
The first regression is the pooled regression model, which is
α i + β1 log ( Revenue_TA )it + β 2 log ( Productivity_TA )it + ε it
Mortalityit = (4)
The results are shown in Table 2. It is shown that the 1 unit increase on the
growth of the income from revenues of the travel agents will increase the growth
of the local mortality by 42.5%, while the 1 unit increase on the growth of the
productivity of the travel agents will decrease the growth of the local mortality
by 39.5%. While in Table 3, a fixed effect model is applied. Results showed the
inverse direction versus the one in Table 2, however, coming from the star-hotel
department. The formula is
Mortalityit = α i + β1 log ( Revenue_SH )it + β 2 log ( Productivity_SH )it + ui + ε it (5)
It is shown that the 1 unit increase on the growth of the income from revenues
Table 1. Fertility VS Tourism [Pooled].
Dependent variable:
log(Fertility)
log(inter_t_inc) −0.067***
(0.009)
Constant 3.127***
(0.095)
Observations 217
R2
0.218
Adjusted R 2
0.215
F Statistic 60.003*** (df = 1; 215)
Note: *p < 0.1; **p < 0.05; ***p < 0.01
DOI: 10.4236/jss.2018.63004 43 Open Journal of Social SciencesJ. J. Lin
Table 2. Mortality VS Tourism [Pooled].
Dependent variable:
Mortality
inter_t_inc −0.00000***
(0.00000)
log(Revenue_ta) 0.425***
(0.061)
log(Productivity_ta) −0.395***
(0.114)
Constant 2.345***
(0.557)
Observations 217
R2 0.296
Adjusted R 2
0.286
F Statistic 29.898*** (df = 3; 213)
Note: *p < 0.1; **p < 0.05; ***p < 0.01
Table 3. Mortality VS Tourism [Fixed].
Dependent variable:
Mortality
log(Revenue_sh) −0.417***
(0.148)
log(Productivity_sh) 0.239***
(0.107)
Observations 217
R2 0.042
Adjusted R 2
−0.215
F Statistic 4.020*** (df = 2; 184)
Note: *p < 0.1; **p < 0.05; ***p < 0.01
of star-hotel department will drop the growth of the local mortality by 41.7%,
while the 1 1unit increase on the growth of the productivity of the star hotel will
rise the growth of the local mortality by 23.9%. But the conclusion could be
achieved from this result, which means the development of the tourism locally
will not always help the drop of the mortality. It could be either increase the
pollution of the local environment, or increase the crime rates. A further discus-
sion would be required to develop the study in this direction.
4.2.3. Urbanization VS Tourism Development
From the pooled regression model,
DOI: 10.4236/jss.2018.63004 44 Open Journal of Social SciencesJ. J. Lin
α i + β1 log ( Revenue_SH )it + β 2 log ( Profit_SH )it
Urbanization it =
(6)
+ β3inter_t_in it + ε it
The results are shown in Table 4. It is significantly shown that the 1 unit in-
crease on the growth rate of the revenues, and profit of the star hotels will give a
770% and 163.3% grow of the urbanization ratio correspondingly. Similar con-
clusion would be found in the random effect model, which after the Hausman
test gives a p-value of 0.21 that rejects the fixed effect model.
α it + β1 log ( Revenue_SH )it + β 2 log ( Profit_SH )it
Urbanization it =
(7)
+ β 3inter_t_in it + ui + ε it
In Table 5, the random effect model tells us the similar results as the pooled
one, instead of 700% and 163.3% increase on urbanization, the 1 unit increase on
the growth rate of the revenues, and profit of the star hotels will give a 414.4%
and 405% increase. The prominent positive effects demonstrate that the better
the development of the local tourism industry, the higher the pace of the urba-
nization will be generated by the effect of such.
5. Conclusion
In this paper, this study analyses the relationship between the tourism industry
and the demographic features in China in recent years. In a sum, the results
imply that the tourism helps to build a higher urbanized society with more mi-
grant inflows crashing into the urban sectors. However, due to its structure and
inefficient productivity, the tourism industry in China has brought adverse ef-
fects on the local fertility rate and the mortality rate. The results from the panel
Table 4. Urbanization VS Tourism [Pooled].
Dependent variable:
Urban. Ratio
inter_t_inc −0.00001***
(0.0000)
log(Revenue_sh) 7.714***
(1.607)
log(Profit_sh) −1.633***
(0.876)
Constant −0.66.449***
(16.814)
Observations 102
R2 0.616
Adjusted R2 0.605
F Statistic 52.491*** (df = 3; 98)
Note: *p < 0.1; **p < 0.05; ***p < 0.01
DOI: 10.4236/jss.2018.63004 45 Open Journal of Social SciencesJ. J. Lin
Table 5. Urbanization VS Tourism [Random].
Dependent variable:
Urban. Ratio
inter_t_inc −0.00001***
(0.0000)
log(Revenue_sh) 4.144***
(1.062)
log(Productivity_sh) 4.050***
(0.884)
Constant −0.14.302***
(12.490)
Observations 217
R2 0.471
Adjusted R 2
0.463
F Statistic 63.109*** (df = 3; 213)
Note: *P < 0.1; **p < 0.05; ***p < 0.01
data linear regression show that the tourism industry in China mostly behaves in
a slightly decreasing scale to the economy. Furthermore, the development of the
tourism economy, specifically, the inflows of the international tourists negatively
correlated with the total fertility rates locally. Third, the growth of the local
tourism industry continues to increase some of the mortality rates of some
provinces, but highly correlated with the urbanization rate of China in the last
few years.
In the previous section, this paper discussed the components of mortality rate.
The analysis of mortality rate with the development of the tourism industry in
China can be untangled into two major parts. First, the infant or under-five
children mortality rate can be related to the tourism sector. Seen from the re-
sults, the increasing mortality rate of this baby group implies that this tourism
industry sector brought a negative effect on the environment pollution and poli-
cies. On the other aspect, the negative effect of the tourism development asso-
ciated with the increase of the adult mortality rate shows the consistency in the
literature: if we consider tourism industry as a shock to the local economy, it
would probably have increased the crime rates, pressure to the residents, and in
the end increase the mortality rate of that place. This paper also proves that the
tourism industry in China in recent years is mostly decreasing returns to scale,
which means the productivity of this tourism industry is not efficient. It is also
consistent with the results from the empirical regression on the datasets that the
negative effect on lower fertility of industry showed a low productivity level of
the tourism industry. In one aspect, it is because of the impact of the outsiders
on the fertility rate. The increased mobility of the tourists’ group gains the diffi-
DOI: 10.4236/jss.2018.63004 46 Open Journal of Social SciencesJ. J. Lin
culty for the stable of the society, which does not help the decision of the in-
crease of the fertility even under the more relaxed political policy. On the other
side, it may cause more pressing issues such as environmental pollution, in-
creasing crime rate due to its decreasing scale to the economy.
Like other empirical studies, this paper inevitably has certain limitations. This
paper used the panel data of province-level from 2007-2013 of China to evaluate
the development of the tourism industry in China, instead of the most recent
data. Because the most recent related dataset from both tourism industry and
demographic features are not publicly available yet to construct. But first, the
post financial crisis data are applied and the effects of the development of that
period are available. Second, the results are consistent with the fact that the low
efficiency of the tourism industry indeed impacts negatively on the net growth of
the population, but helps accelerate the pace of urbanization in mainland China.
Third, with the same methods used in this paper, once the free and publicly
available data are published, the results could be generated reproducible of this
paper.
Overall, it seems that the current tourism industry does not satisfy the de-
mand of a long-term sustainable development in China. For example, since
2007, the growth of the qualified AAAAA tourism resorts has been developed
and later repealed by the government. It is both misleading for the consumer’s
side and a huge waste of the national resources for the tax payers. Another ex-
ample comes that recently many tourism resorts have been reported that they
treated tourists horribly which brought bad reputation for the tourism and made
it difficult to improve [21]. This also explains and fits the results of this paper. It
is essential for both the central government and the local government to adjust
the structure of the tourism industry. The inefficiency in this sector, will not on-
ly impact the environment and generate pollution, but also discourage the hu-
man social activities. The more dangerous aspect of this inefficient industry is
that it indeed highly associated with the increasing urbanization pace. It is easy
for the government and residents to ignore the hidden dangerous side-effect of
this inefficient sector, which could delay the development of the economy of
China. The government of China must achieve an environment friendly tourism
industry to reduce these negative externalities of the society as soon as possible.
The long-term sustainable goal must be achieved in a way with less negative ex-
ternalities of the tourism industry in China. And I hope that not only China, but
also other countries should follow a more environment friendly development
goal.
References
[1] World Tourism Organization. (2017) Why Tourism?
http://www2.unwto.org/content/why-tourism
[2] China National Tourism Administration. (2018) 2017 Annual Report on Tourism
Market and Comprehensive Contribution Data.
http://www.wta-web.org/eng/xwdt_4020/xw_4021/201802/t20180207_856039.shtml
DOI: 10.4236/jss.2018.63004 47 Open Journal of Social SciencesJ. J. Lin
[3] Ma, T., Hong, T. and Zhang, H. (2015) Tourism Spatial Spillover Effects and Urban
Economic Growth. Journal of Business Research, 68, 74-80.
https://doi.org/10.1016/j.jbusres.2014.05.005
[4] Zhao, L. and Tang, C.C. (2017) China’s Tourism Industry, Industrial Structure and
Economic Growth. Resources Science, 39, 1918-1929.
[5] Kim, W., Jun, H.M., Walker, M. and Drane, D. (2015) Evaluating the Perceived So-
cial Impacts of Hosting Large-Scale Sport Tourism Events: Scale Development and
Validation. Tourism Management, 48, 21-32.
https://doi.org/10.1016/j.tourman.2014.10.015
[6] Desa, U.N. (2013) World Population Prospects: The 2012 Revision. Population Di-
vision of the Department of Economic and Social Affairs of the United Nations Se-
cretariat, New York. https://doi.org/10.18356/02911eeb-en
[7] Feng, W., Cai, Y. and Gu, B. (2013) Population, Policy, and Politics: How Will His-
tory Judge China’s One-Child Policy? Population and Development Review, 38,
115-129. https://doi.org/10.1111/j.1728-4457.2013.00555.x
[8] Hanrahan, M. and Baculinao, E. (2017) China Population Crisis: New Two-Child
Policy Fails to Yield Major Gains.
https://www.cnbc.com/2017/01/28/china-population-crisis-new-two-child-policy-fa
ils-to-yield-major-gains.html
[9] Smith, K., Backer, E., Baum, T., Benkendorff, P., Butterfield, S., Cothran, C., et al.
(2011) Tourism and Demography. Goodfellow Publishers Ltd., Oxford.
[10] Casagrande, M. (2016) Heritage, Tourism, and Demography in the Island City of
Venice: Depopulation and Heritagisation. Urban Island Studies, 2, 121-141.
https://doi.org/10.20958/uis.2016.6
[11] Verma, R. (2016) Unmade in China: The Hidden Truth about China’s Economic
Miracle. By Jeremy R. Haft. International Affairs, 92, 754-756.
https://doi.org/10.1111/1468-2346.12636
[12] Luo, J.M., Qiu, H. and Lam, C.F. (2016) Urbanization Impacts on Regional Tourism
Development: A Case Study in China. Current Issues in Tourism, 19, 282-295.
https://doi.org/10.1080/13683500.2015.1033385
[13] Jones, L.E. and Schoonbroodt, A. (2016) Baby Busts and Baby Booms: The Fertility
Response to Shocks in Dynastic Model. National Bureau of Economic Research, 22,
157-178. https://doi.org/10.1016/j.red.2016.07.001
[14] United Nations, Department of Economic and Social Affairs, Population Division
(2017) World Population Prospects: The 2017 Revision.
https://www.un.org/development/desa/publications/world-population-prospects-th
e-2017-revision.html
[15] Foster, A., Gutierrez, E. and Kumar, N. (2009) Voluntary Compliance, Pollution
Levels, and Infant Mortality in Mexico. American Economic Review, 99, 191-197.
https://doi.org/10.1257/aer.99.2.191
[16] Hanna, R.N. and Oliva, P. (2010) The Impact of Inspections on Plant-Level Air
Emissions. The B.E. Journal of Economic Analysis and Policy, 10, 1-33.
https://doi.org/10.2202/1935-1682.1971
[17] Greenstone, M. and Hanna, R. (2014) Environmental Regulations, Air and Water
Pollution, and Infant Mortality in India. American Economic Review, 104,
3038-3072. https://doi.org/10.1257/aer.104.10.3038
[18] You, D., Hug, L., Ejdemyr, S., Idele, P., Hogan, D., Mathers, C. and Alkema, L.
(2015) Global, Regional, and National Levels and Trends in under-5 Mortality be-
DOI: 10.4236/jss.2018.63004 48 Open Journal of Social SciencesJ. J. Lin
tween 1990 and 2015, with Scenario-Based Projections to 2030: A Systematic Analy-
sis by the UN Inter-agency Group for Child Mortality Estimation. The Lancet, 386,
2275-2286. https://doi.org/10.1016/S0140-6736(15)00120-8
[19] Pierce, J.R. and Schott, P.K. (2016) Trade Liberalization and Mortality: Evidence
from US Counties. Finance and Economics Discussion Series, 94, 1-68.
https://doi.org/10.3386/w22849
[20] Wang, S. and Chen, J.S. (2015) The Influence of Place Identity on Perceived Tour-
ism Impacts. Annals of Tourism Research, 52, 16-28.
https://doi.org/10.1016/j.annals.2015.02.016
[21] China Daily (2018) Snow Town Must Clean up Its Act.
http://www.chinadaily.com.cn/cndy/2018-01/17/content_35519291.htm
DOI: 10.4236/jss.2018.63004 49 Open Journal of Social SciencesYou can also read