INTERRENT REIT INVESTOR PRESENTATION - September 2018
←
→
Page content transcription
If your browser does not render page correctly, please read the page content below
INTERRENT REIT
INVESTOR PRESENTATION

     September 2018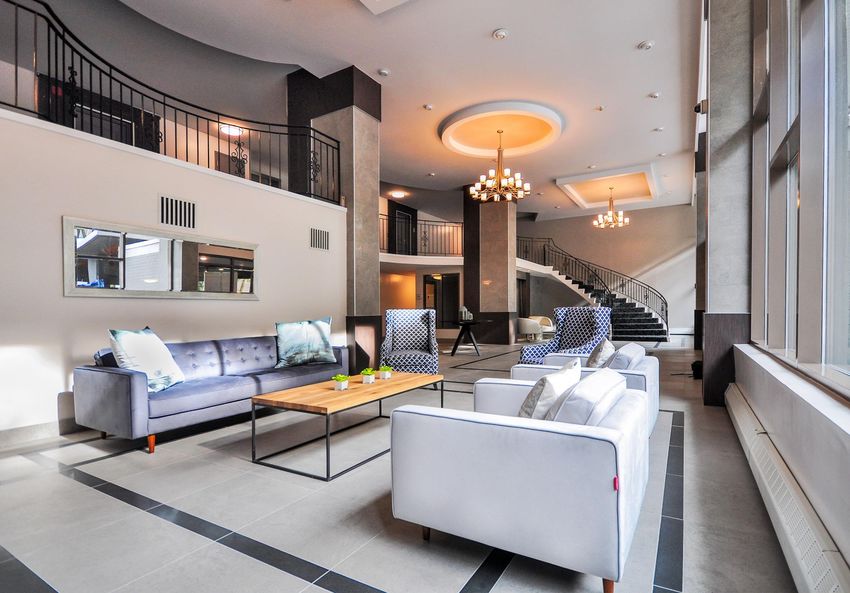
INTERRENT REIT IS A GROWTH-
ORIENTED REAL ESTATE
INVESTMENT TRUST ENGAGED IN
INCREASING VALUE AND CREATING
A GROWING AND SUSTAINABLE
DISTRIBUTION THROUGH THE
ACQUISITION AND OWNERSHIP OF
MULTI-RESIDENTIAL PROPERTIES.
FORWARD LOOKING STATEMENTS
This presentation contains “forward-looking statements” within the meaning of applicable Canadian securities legislation.
Generally, these forward-looking statements can be identified by the use of forward-looking terminology such as “plans”,
“anticipated”, “expects” or “does not expect”, “is expected”, “budget”, “scheduled”, “estimates”, “forecasts”, “intends”,
“anticipates” or “does not anticipate”, or “believes”, or variations of such words and phrases or state that certain actions,
events or results “may”, “could”, “would”, “might” or “will be taken”, “occur” or “be achieved”. InterRent is subject to
significant risks and uncertainties which may cause the actual results, performance or achievements to be materially
different from any future results, performance or achievements expressed or implied by the forward looking statements
contained in this release. A full description of these risk factors can be found in InterRent’s publicly filed information which
may be located at www.sedar.com. InterRent cannot assure investors that actual results will be consistent with these
forward-looking statements and InterRent assumes no obligation to update or revise the forward-looking statements
contained in this presentation to reflect actual events or new circumstances.
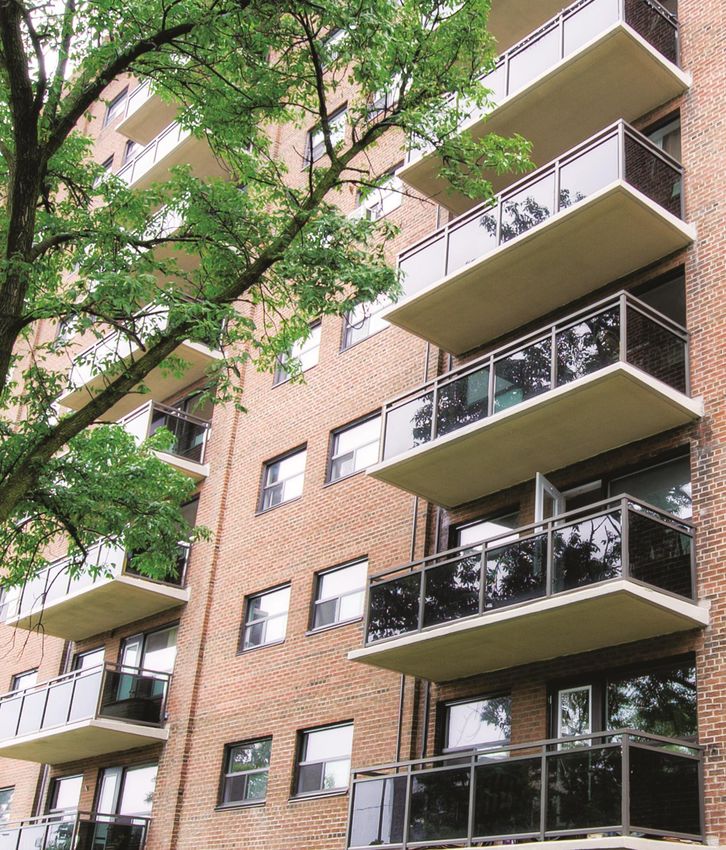
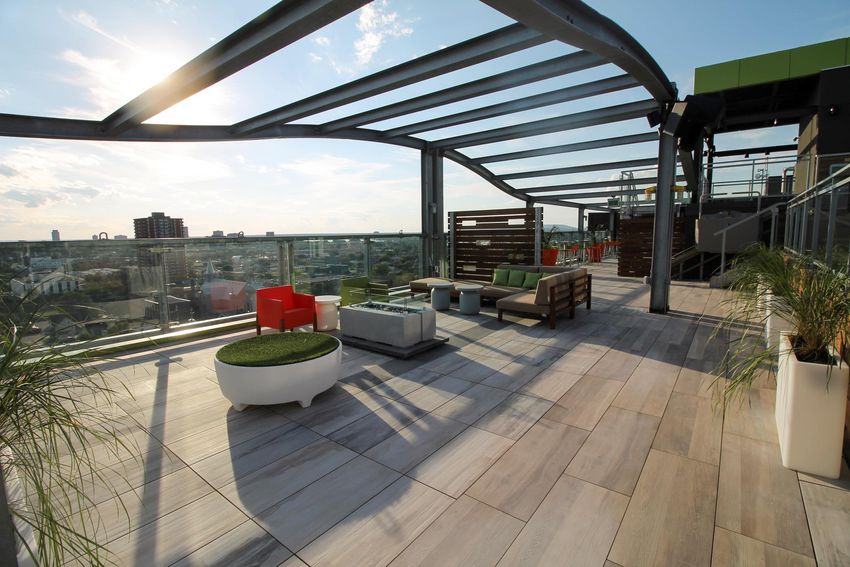
157 Pearl | Hamilton
InterRent REIT | 2018 3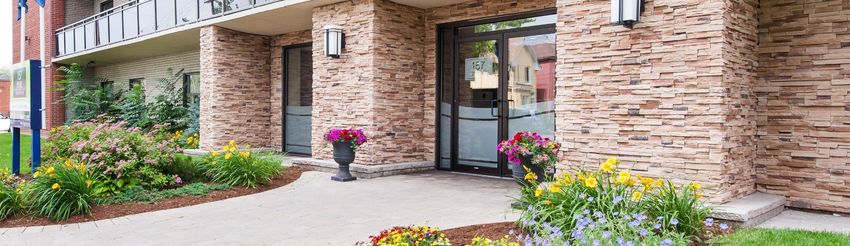
ABOUT INTERRENT

                 ROADMAP TO THE PRESENT
DISTRIBUTIONS

                12¢     12¢        13.65¢   18.68¢   20.36¢   22.15¢   23.30¢   24.75¢

                                                                                         $11.33            Start       September 30, 2009

                                                                                                            End      As at September 4, 2018

                                                                                                      Unit Price      $1.50 to $11.33
                                                                                                    Cumulative
                                                                                                   Distributions              $1.67

                                                                                                   Total Return               809%
                                                                                                     Number of     4,033 to
                                                                                                                                      124%
                                                                                                        Suites      9,021

                                                                                                  Since current management took over,
                                                                                                  InterRent has been one of the best
                                                                                                  performing REITs in Canada with a total
                                                                                                  return of 809%. InterRent continues to
                                                                                                  focus on organic growth of existing
                                                                                                  properties, target new properties to
                                                                                                  reposition, as well as acquisitions of
                                                                                                  properties with untapped value.

                                                                                                                   InterRent REIT | 2018     4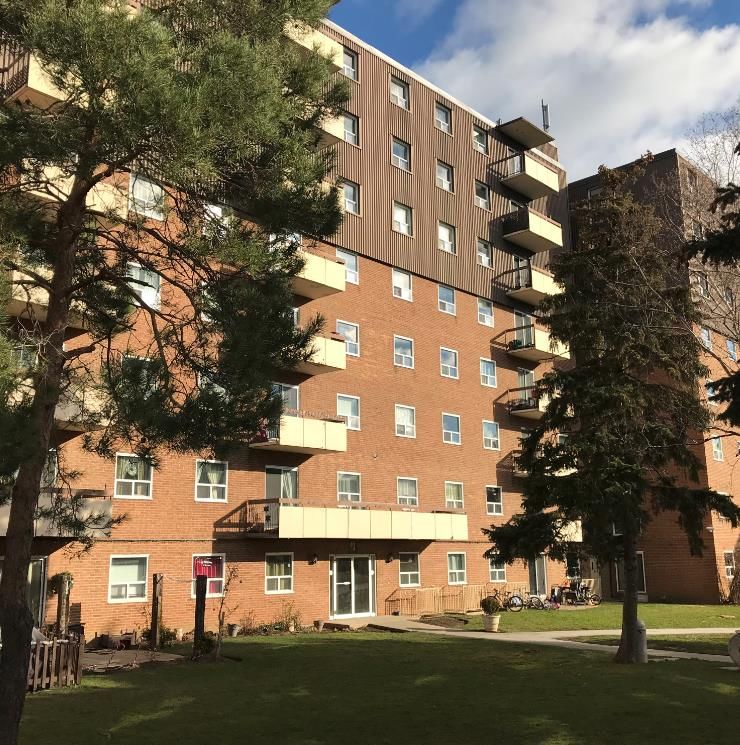
ABOUT INTERRENT

         WE ARE PROVIDERS OF HOMES ACROSS ONTARIO AND QUEBEC

                                      1

                                     1

                                    11

                                                       Primary Market   Secondary Market
                                                       7,212 Suites     1,809 Suites
Our primary markets make up
more than 80% of our NOI

  1   CMHC Fall 2017 Rental Market Report apartment universe
                                                                                           InterRent REIT | 2018   5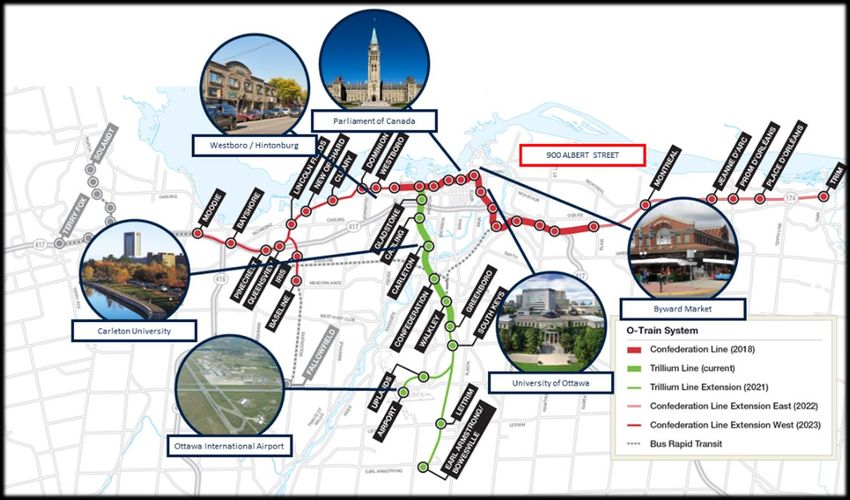
GROWTH POTENTIAL

                PROVEN ABILITY TO SOURCE DEALS

  Proven track record of sourcing acquisitions, with over $700 Million in acquisitions since change of control (over 6,200 units).

  Continued pipeline of potential properties through solid relationships and proprietary lead generation database.

       Crystal Beach East, Ottawa                                                                                                                     5775 Sir Walter Scott, Montreal
      15 Kappele Circle, Stratford                                                      1101 Rachel, Montreal                                             1-3 Slessor, Grimsby
                                                 1702 Suites                            Parkway Park, Ottawa             602 Suites                      236 Richmond, Ottawa
Tindale Court & Quigley Road, Hamilton
      6599 Glen Erin, Mississauga                                                                                                                         381 Churchill, Ottawa
           15 Louisa, Ottawa                                                                                                                            10 Ben Lomond, Hamilton

                                                   2015                                                                    2017
              2014                           5501 Adalbert, Montreal                          2016                                                             2018
                                               Forest Ridge, Ottawa                                                1111 & 1121 Mistral, Montreal
                                            Britannia Portfolio, Ottawa                                                3 East 37th, Hamilton
            645 Suites                   181 Lebreton & 231 Bell, Ottawa
                                                                                             545 Suites         2121 & 2255 Saint Mathieu, Montreal          360 Suites
                                         Stoney Creek Portfolio, Hamilton                                             78 Lawrence, Hamilton
                                            Maple & Brant, Burlington

Riviera, Gatineau                                                     5550 Trent, Montreal                             Crystal Beach, Ottawa
                                                                                                                                                         InterRent REIT | 2018   6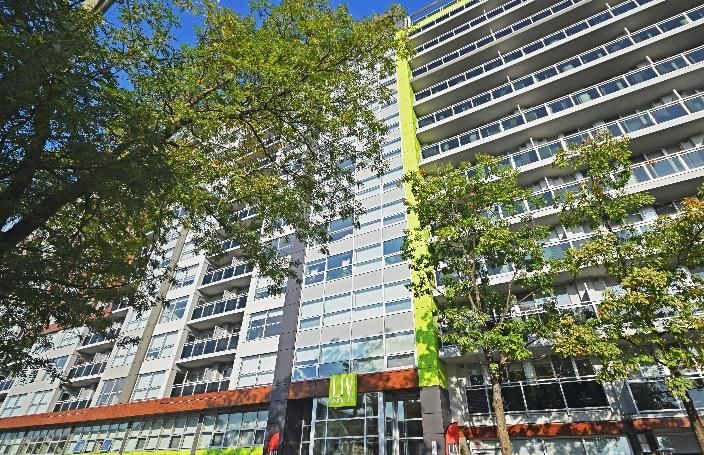
PORTFOLIO MANAGEMENT

         VALUE ADD STRATEGY

                                                              Acquisitions/Development
                                                •   Acquire properties that have untapped value that can be
                                                    realized through the REIT’s repositioning strategy
                                                •   Develop properties in our target growth areas

 Recycling and                                                                                                         Customer Service
 Allocation of Capital                                                                                                 Offer an unsurpassed customer
 •   Regularly review the properties within                                                                            experience by:
     the portfolio to determine the most                                                                               • Multi-channel communication stream
     efficient and effective use of capital                                                                            • Dedicated customer advocates
 •   Refinance at more favourable                                                                                      • Tracking and reporting to senior
     rates/terms                                                                                                          management of customer concerns
 •   Disposition of non-core assets                                                                                       and feedback
                                                                                                                       • Creating a sense of community

                                                                        Our People
                                                                       Hiring excellence,
                                                                      providing constant
Cost Reduction and Containment                                        training and career                     Driving and Enhancing Revenue Streams
Implement energy-efficient utility programs to lower                     advancement                          Continuously search for new revenue streams as well
operating costs while utilizing government programs to                                                        as ways to grow existing ones.
leverage investment dollars.                                                                                  • Increase rents on turnover through exterior,
• Replace old boilers, domestic hot water heaters,                                                               common area and in-suite improvements
   water fixtures and lighting fixtures                                                                       • Securing additional streams of income through
• Conversion of domestic hot water heaters from                                                                  rooftop leases and revenue sharing agreements
   electric to gas                                                                                            • Growing the rental revenue base organically while
• Implement hydro submetering programs                                                                           at the same time improving its stability by removing
• Focus on preventative maintenance                                                                              undesirable tenants
• Reduce customer turnover by providing better                                                                • Increased focus on parking and ancillary revenue
   customer service                                                                                           • Adding suites within under-utilized space

                                                                                                                                               InterRent REIT | 2018   7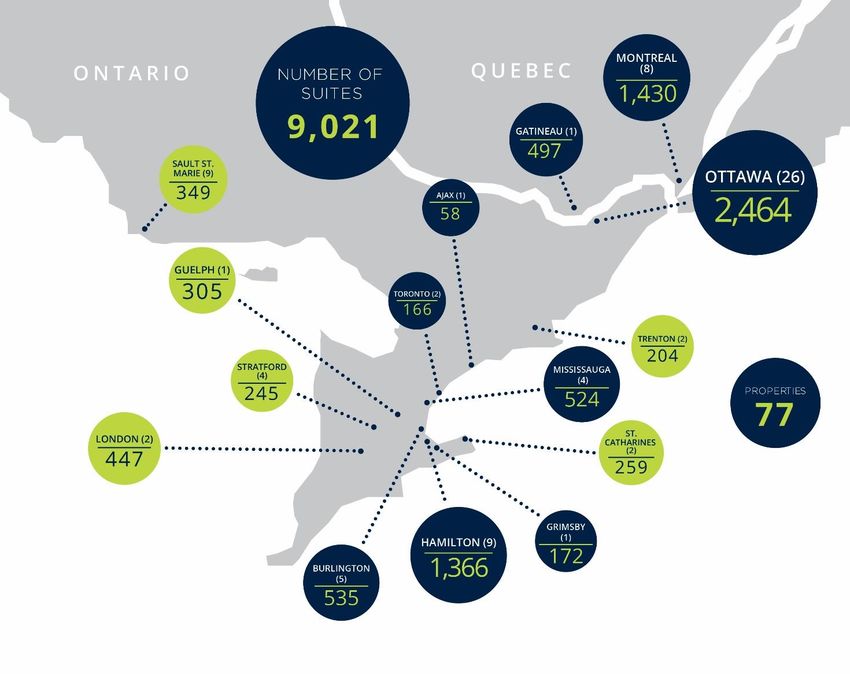
PORTFOLIO MANAGEMENT

     FOCUS ON REPOSITIONING

                                                             Before   After
EXTERIOR UPGRADES

                               5220 Lakeshore | Burlington
• Complete, attractive first
  impression package
• Designer-influenced
  exterior finishes

COMMON AREA
UPGRADES
                               New Street | Burlington

• Added functionality
• Designer finishes
• Enhanced security

UNIT UPGRADES
• Improving suite layout
• Upgraded bathrooms and
  kitchens
• Upgraded flooring
                               LIV | Ottawa

                                                                              InterRent REIT | 2018   8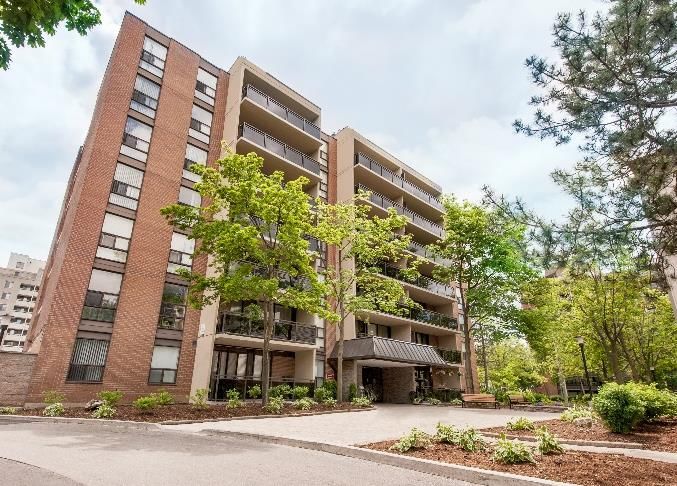
VALUE CREATION

2014 ACQUISITIONS

                                                          As at Acquisition         As at 2018 Q2
                 Acquisition Cost                             $76,011,767
                 Capital Invested                                                        $25,985,654
                 Acquisition Cost Plus Capital Invested                                 $101,997,421
                 Net Revenue                                    $7,347,268                $9,829,781
                 Operating Costs                                $3,426,507                $3,468,447
                 NOI                                            $3,920,761                $6,361,333         62%
                 NOI Margin                                            53%                       65%
                 Cap Rate                                             5.2%                      6.2%
                 Total Suites                                          645                       645
                 Current Cap Rate                                                               4.3%
                 Fair Value Today                                                       $146,903,000
                 Value Creation                                                          $44,905,579
                 Value per Suite                                   $117,848                 $227,757         93%

                  Tindale-Quigley | Hamilton               Crystal Beach East| Ottawa
                                                                                                    InterRent REIT | 2018   9
KEY FINANCIAL METRICS

 PROVEN TRACK RECORD OF SUCCESS

        Effective use of capital through:
          Smart disposition of properties
          Recycle capital from dispositions fully into repositionings
          Capitalize on low interest rate environment

                                                                 TOTAL ASSET GROWTH

                                                                                                                                                     1
                                                                                                                                         1        67%
  $2,000,000                                                                                                                          66%                      $0.50
                                                                                                                         69%
  $1,800,000                                                                                               72%                                                 $0.45
                                                                                           73%
  $1,600,000                                                                  63%                                                                              $0.40
  $1,400,000                                                    51%                                                                                            $0.35
                                                   92%
  $1,200,000                       300%                                                                                                                        $0.30
                        100%
  $1,000,000                                                                                                                                                   $0.25
       $800,000                                                                                                                                                $0.20
       $600,000                                                                                                                                                $0.15
       $400,000                                                                                                                                                $0.10
       $200,000                                                                                                                                                $0.05
            $0                                                                                                                                                 $0.00
                     01-Jan-10   31-Dec-10     31-Dec-11     31-Dec-12     31-Dec-13    31-Dec-14      31-Dec-15      31-Dec-16     31-Dec-17   30-Jun-18

                  Liabilities       Unitholders' Equity          Distributions/unit          FFO Per Unit (Diluted)            FFO/Unit CAGR       AFFO Payout Ratio

1TTM   AFFO for 2017 calculated in accordance to Realpac definition. Prior years calculated differently.                                        InterRent REIT | 2018   10
KEY FINANCIAL METRICS
GROWTH IN ALL THE RIGHT PLACES
TTM at 30-
In $000s, except as noted 2010 2011 2012 2013 2014 2015 2016 2017
Jun-18
Total Suites 3,998 3,820 4,695 6,048 6,700 8,389 8,059 8,660 9,021
Occupancy Rate 96.3% 96.6% 97.8% 96.4% 96.1% 94.6% 94.8% 97.9% 94.0%
Average Rent Per Suite $805 $843 $887 $931 $965 $996 $1,064 $1,110 $1,148
Operating Revenues $35,352 $38,471 $47,530 $60,506 $65,404 $82,977 $97,466 $109,004 $118,585
Net Operating Income (NOI) $15,913 $20,506 $27,946 $36,041 $37,884 $48,490 $56,868 $66,166 $74,226
NOI % 45.0% 53.3% 58.8% 59.6% 57.9% 58.4% 58.3% 60.7% 62.6%
Funds from Operations (FFO) $232 $4,300 $13,489 $18,883 $18,836 $24,425 $27,796 $34,662 $39,726
FFO Per Unit (basic) $0.01 $0.13 $0.31 $0.35 $0.33 $0.35 $0.39 $0.43 $0.45
Adjusted Funds from Operations (AFFO) $1,135 $4,343 $11,748 $16,278 $16,189 $21,145 $24,170 $30,5701 $34,8841
AFFO Per Unit (basic) $0.04 $0.13 $0.27 $0.30 $0.28 $0.31 $0.34 $0.381 $0.401
Debt to GBV 58.3% 48.5% 46.8% 47.4% 52.7% 54.2% 55.3% 47.8% 43.5%
Elmridge | Ottawa
1TTM AFFO for 2017 & 2018 calculated in accordance to Realpac definition. Prior years calculated differently.
InterRent REIT | 2018 11KEY FINANCIAL METRICS
A PROVEN APPROACH TO MANAGING THE BALANCE SHEET
Hamilton Landing | Trenton
MORTGAGE SCHEDULE
Mortgage &
Debt Balance Weighted Weighted
(000s) Average by Average
Year Maturing 30-Jun-18 Maturity Interest Rate
2018 $90,933 11.2% 3.27%
2019 $44,301 5.5% 3.21%
2020 $95,512 11.8% 2.87%
700 Ross | Burlington
2021 $51,854 6.4% 3.46%
2022 $70,765 8.7% 2.83%
Thereafter $457,919 56.4% 2.87%
Total $811,284 100.0% 2.95%
INTEREST COVERAGE 2.81x
939 Western | London
DEBT SERVICE COVERAGE 1.80x
DEBT TO GBV
30-Jun-18
43.5%
InterRent REIT | 2018 12INTERRENT REIT
EXECUTIVE TEAM
PAUL AMIRAULT PAUL BOUZANIS
BOARD
Trustee Trustee
RONALD LESLIE MIKE MCGAHAN “Good teams become great ones when the
Trustee Trustee members trust each other enough to
surrender the Me for the We”
CHERYL PANGBORN VICTOR STONE
Trustee Trustee - PHIL JACKSON
MIKE MCGAHAN Property Management
Operations
Chief Executive Officer
Acquisitions
& Trustee Development
Syndications
Brokerage
BRAD CUTSEY, CFA Capital Markets / Investor Relations
Research & Financial Modeling
President Our success is dependent on our
Acquisitions
Property Management team members. The InterRent team
INTERRENT REIT
Strategic Management
has a proven track record of creating
100+ Years value through repositioning rental
CURT MILLAR, CPA, CA Corporate Finance
Chief Financial Officer Accounting & Financial Reporting Combined properties, providing both the
Experience
Operations Management experience and ability necessary to
Acquisitions
Business Development continue to grow and improve the
Process & Systems Optimization REIT while creating value for our
unitholders.
DAVE NEVINS Property Management
Operations
Chief Operating Officer
Construction
BRIAN AWREY, CPA, CA Financial Reporting
Corporate Finance
Vice President
Accounting
InterRent REIT | 2018 13APPENDIX LIV | Ottawa InterRent REIT | 2018
INTERRENT REIT IN THE NEWS

           RECENT EVENTS

                      “Strong Fundamentals Drive Solid Cash Flow Growth”
                                                         - Mark Rothschild, Canaccord Genuity
                                                                                              August 14, 2018

                      “Maintaining Outperform on Rent Growth Potential”
                                                         - Troy MacLean, BMO Capital Markets
                                                                                                 May 16, 2018

               “Adjusting Estimates After $98 mln Offering; Maintain Strong Buy”
                                                                - Ken Avalos, Raymond James
                                                                                               March 29, 2018

                       “Solid Q4 Results and a Constructive 2018 Outlook”
                                                         - Michael Smith, RBC Capital Markets
                                                                                             February 22, 2018

Britannia | Ottawa                      LIV | Ottawa            5220 Lakeshore| Burlington     InterRent REIT | 2018   15
ANALYSTS’ RESEARCH
PRICE TARGETS & NAV/UNIT ESTIMATES
Target NAV/Unit NAV/Unit
Broker Date Rating
Price Estimate Cap Rate
BMO Capital
17-Aug-18 Outperform $12.50 $10.50 4.5%
Markets “Another Strong Quarter: Very strong fundamentals (SP AMR up
Canaccord +6.9%) and IIP's value-add strategy continued to produce strong
15-Aug-18 Buy $12.00 $10.94 4.5% organic growth in Q2, with SPNOI up +13.5%, the fourth quarter in a
Genuity
row of SPNOI growth >10%. This is the 15th consecutive quarter of
CIBC World SPNOI growth above +4% (~8.4% average).”
14-Aug-18 Neutral $11.50 $10.50 4.5%
Markets
- Troy MacLean, BMO Capital Markets
Desjardins August 17, 2018
14-Aug-18 Buy $11.75 $10.20 NA
Capital Markets
Echelon Wealth “Leverage profile is improving. Accounting for post-quarter
14-Aug-18 Buy $11.50 $10.50 4.7% refinancing: (1) >80% of IIP’s mortgages are CMHC-insured; (2) variable
Partners
exposure has been reduced to 13%; (3) the average term exceeds 6+
GMP Securities 14-Aug-18 Buy $11.50 $10.30 4.5% years; and (4) the average rate is virtually unchanged at 2.95%.”
- Michael Markidis, Desjardins
Industrial August 14, 2018
Alliance 15-Aug-18 Buy $12.00 $10.50 4.5%
Securities “Our view: Multi-family is a strong sector especially in the greater
Laurentian Bank Toronto, Ottawa and Montreal regions. These regions are benefiting
15-Aug-18 Buy $12.00 $10.50 4.7% from strong demand underpinned by immigration/population growth
Securities
and muted supply owing to capacity constraints, regulation and a host
Sector of other factors. As Warren Buffett famously said when it comes to
NBF 14-Aug-18 $11.50 $10.65 4.5%
Perform investing “I don’t try to jump over 7-foot hurdles, I look for 1-foot
hurdles”. We think multi-family in these markets is the proverbial 1-
Raymond James 15-Aug-18 Strong Buy $12.00 $10.25 4.6% foot hurdle. Even better, we think IIP’s business model and
management team are turning 1-foot hurdles into 6-inch hurdles.”
RBC Capital
14-Aug-18 Outperform $12.00 $10.50 NA - Michael Smith, RBC Capital Markets
Markets
August 14, 2018
Sector
Scotiabank GBM 15-Aug-18 $12.25 $11.00 4.6%
Outperform
TD Securities 15-Aug-18 Buy $12.50 $10.50 4.3%
Average $11.92 $10.53 4.5%
InterRent REIT | 2018 16EXTERNAL GROWTH
1 & 3 SLESSOR BOULEVARD, GRIMSBY
Property Overview
1 and 3 Slessor Boulevard are two dominant rental buildings in the sought after
community of Grimsby, located fifteen minutes away from the Hamilton neighbourhood
of Stoney Creek. The buildings at 1 and 3 Slessor Boulevard have eight and four storeys
respectively, combining for a total of 172 units. The property provides residents with
quick access to both the Queen Elizabeth Way highway, and, by 2021, the town’s future
daily GO Train service.
7
1 2
3
4
5 6
8
9
Suite Count 172
Purchase Price $21,075,000
1 & 3 Slessor Boulevard 5 RBC Royal Bank
Price per Suite $122,529 1 Canadian Tire 6 Central Public School
2 Sobey’s Grocery Store 7 Blessed Trinity Catholic Secondary School
3 Shoppers Drug Mart 8 Grimsby Secondary School
4 Canadian Tire Gas 9 Food Basics
InterRent REIT | 2018 17EXTERNAL GROWTH
5775 SIR WALTER SCOTT AVENUE, MONTREAL
Property Overview
5775 Sir Walter Scott is a low-rise multi-residential building situated in a quiet sought
after rental neighborhood within close proximity to downtown Montreal and with easy
access to the Montreal West train station and the Vendome metro station. The
property is situated one block from the Cavendish Mall, two blocks from Mount Sinai
Hospital and has easy access to highways 15, 20, 40 and 520. Additionally, the property
is adjacent to an existing InterRent 174 suite complex.
5
4
1 2
3
10
11
6
7
Suite Count 48 9 8
Purchase Price $5,250,000 5775 Sir Walter Scott 6 CIBC Brach and ATM
1 IGA Supermarket 7 Pharmaprix
Price per Suite $109,375 2 Quartier Cavendish Mall 8 Wagar Adult Centre
3 Scotiabank Branch 9 Aquatic and Community Centre
4 Eleanor London Côte Saint-Luc Public 10 Merton Elementary School
Library
11 Mount Sinai Hospital
5 Bialik High School
InterRent REIT | 2018 18EXTERNAL GROWTH
236 RICHMOND, OTTAWA
Property Overview
236 Richmond Road is a newly constructed mixed-use building located in the revitalized and
thriving Westboro community. Completed in 2016, this property sits prominently along
Richmond Road – Westboro’s main east-west street and offers its residents an abundance
of building and neighbourhood amenities. The property is within a 5 minute walk of
Westboro Station, which provides rapid bus services downtown Ottawa and throughout the
city. The station will be converted to LRT by 2023. This 9-storey building features 71
residential units, and a first floor of prime retail space anchored by RBC Bank.
5
12 2
11 7
6 1
3
4
8
9
10
Suite Count 72
Commercial sf 8,641
236 Richmond Road Hilson Avenue Public School
7
1 Real Canadian Superstore Iona Park
8
Purchase Price $36,250,000 2 Farm Boy Grocery 9 Shoppers Drug Mart
3 LCBO 10 TD Canada Trust
4 RBC Royal Bank 11 Westboro Beach
5 CIBC Bank 12 Westboro Station
6 Lion’s Park InterRent REIT | 2018 19EXTERNAL GROWTH
10 BEN LOMOND, HAMILTON
Property Overview
10 Ben Lomond is a 8-storey (plus PH) mid-rise building, tucked away on a quiet street in
Hamilton's Raleigh neighbourhood. Situated at the edge of the Niagara Escarpment, the
property offers spectacular views of the city's downtown, Hamilton Harbour, and beyond.
The property provides easy access to many neighborhood amenities such as parks, schools,
shopping, and hospitals.
8
2
1
3 1
6
7
9
4
10
Total Suite Count 62 5
Purchase Price $10,450,000 Mountain Drive Park
10 Ben Lomond 6
1 775 Concession and 3 East 37th St 7 Peace Memorial Park
Price per Suite $168,548 2 Juravinksi Hospital and Cancer Centre 8 Shoppers Drug Mart
3 Big Bear Food Mart 9 Sacred Heart of Jesus Catholic School
4 Metro Grocery Store 10 Blessed Sacrament Catholic School
5 Freshco Grocery Store
InterRent REIT | 2018 20EXTERNAL GROWTH
TRANSFORMATIONAL DEVELOPMENT IN OTTAWA
5
2
1 3
4
900 Albert Street – Development Site
1 Bayview Station – LRT Trillium and
Confederation Intersection
2 LeBreton Flats Development – 6 min
walk (500m)
3 City Centre Complex – 1 min walk
(100m)
4 Little Italy – 10 min walk (850m)
5 Ottawa River Pathway (biking and
walking) – 5 min walk (400m)
Conveniently located at the southwest corner of Albert Street and City Centre Avenue, the new development will access a direct
pedestrian link to the Bayview Light Rail Transit Station, the only intersection of the Confederation and Trillium Lines. The diverse spaces
draw people and business from key downtown neighbourhoods.
Potential for up to:
• 130,000 sq ft of retail space
• 200,000 sq ft of office space
• 1,150,000 sq ft (1,400 suites) of residential space
InterRent REIT | 2018 21CASE STUDIES
VALUE CREATION
2386 & 2400 NEW STREET
BURLINGTON, ONTARIO
Conveniently situated in the Roseland area
2386 & 2400 New Street
in Burlington, 2386 & 2400 New Street Overview
offers spacious one, two, and three
bedroom suites with scenic views of Lake Total Suites 238
Ontario.
This property has received extensive Investment Highlights
capital investment over the past three
years including new landscaping, new Burlington,
Location
balconies, upgraded kitchens and flooring Ontario
in many suites, energy efficient lighting, a
new gym and a media room. There have Investment
76 Months
also been added 8 suites to this property. Timeframe
Since acquisition in March 2012, average
Purchase Price $20.7M
rent on the suites which have been turned
over has increased 54% from $1,038 to
$1,599. NOI has increased 148% from Expected IRR 50%+
$1,313,832 to $3,253,793. The expected
IRR is based on the IFRS value at June 30,
2018 is over 50%. Equity Multiple 5.9x
InterRent REIT | 2018 22CASE STUDIES
VALUE CREATION
2757 BATTLEFORD ROAD
MISSISSAUGA, ONTARIO
2757 Battleford is located adjacent to Lake 2757 Battleford Overview
Aquitaine and at the corner of Erin Mills Parkway
and Battleford Road in Mississauga. Including our
Suites 184
adjacent property at 6599 Glen Erin Drive, the
combined site has a land mass of approximately
420,750 square feet (9.66 acres).
Investment Highlights
Substantial capital improvements have been
made to these properties including new hard &
Investment
soft landscaping, new entrance and lobby, hydro 73 Months
Timeframe
submetering, new elevators and energy efficient
lighting. Purchase Price $23.9M
Since acquisition in June 2012, average rent on
the suites which have been turned over at 2757 Expected IRR 25%+
Battleford has increased 36% from $1,152 to
$1,564. NOI has increased 64% from $1,462,650 Equity Multiple 3.9x
to $2,402,932. The expected IRR based on the
IFRS value at June 30, 2018 is over 25%.
InterRent REIT | 2018 23CASE STUDIES
VALUE CREATION
BRITANNIA PORTFOLIO
OTTAWA, ONTARIO
InterRent purchased this 286 unit portfolio in Britannia Portfolio Overview
2015. The average purchase price was $97,028
per unit overall, which the REIT believes was well Suites 286
below market value.
Unit types consist of apartments, duplexes and
semi-detached homes and are located along
Investment Highlights
Britannia Park and the waterfront of the Ottawa
River. Investment
38 Months
Timeframe
The average rent for the suites which have
turned over since the acquisition of this portfolio Purchase Price $28.1M
in April 2015 is $1,214. This is an increase of
43% from the average rent for this same group
Expected IRR 40%+
of suites at acquisition of $848. Capital
improvements at these properties include
Equity Multiple 3.0x
recladding of exteriors, new windows, new
landscaping, intercom and security systems new
laundry rooms, energy efficient lighting,
upgraded boilers and renovated kitchens on
turnover.
The expected IRR based on the IFRS value at
June 30, 2018 is over 40%.
InterRent REIT | 2018 24VALUATION
CANADIAN APARTMENT REITS: IN LINE WITH HISTORICAL VALUATIONS
Historical Price / Consensus AFFO
32.0x
24.0x
16.0x
8.0x
Jan-98 Jan-00 Jan-02 Jan-04 Jan-06 Jan-08 Jan-10 Jan-12 Jan-14 Jan-16 Jan-18
Cdn P/FTM AFFO US P/FTM AFFO Cdn P/FTM AFFO Hist. Avg US P/FTM AFFO Hist. Avg
Historical AFFO Yield Spread
12.0%
5.0%
(2.0%)
Jan-98 Jan-00 Jan-02 Jan-04 Jan-06 Jan-08 Jan-10 Jan-12 Jan-14 Jan-16 Jan-18
Cdn AFFO Yield Spread US AFFO Yield Spread Cdn AFFO Yield Spread Hist. Avg US AFFO Yield Spread Hist. Avg
Source: S&P Global Market Intelligence.
InterRent REIT | 2018 25VALUATION
INTERRENT’S PAYOUT RATIO: REMAINS CONSERVATIVE
2018E AFFO Payout Ratio
93.7%
88.0% 84.1% 81.2%
70.9% 67.6%
58.8%
NA NA NA
MI.UN
NVU.U
RUF.U
MRG.U
MEQ
HOM.U
KMP.U
CAR.UN
IIP.UN
BEI.UN
N
N
N
Distribution Yields
2019 Fully
7.2% 7.1% 5.7% 5.1% 6.4% 3.7% 3.9% 3.8% 3.9% 5.0%
Distributed Yield
Distributed Yield 2018 Fully Distributed Yield
6.9%
6.4% 6.2% 6.0%
5.3% 5.1%
4.5% 4.8% 4.6%
4.1% 4.0%
3.5% 3.4% 3.5%
2.9%
2.4% 2.4% 2.0%
1.9%
0.0%
NVU.UN HOM.U RUF.U KMP.UN MRG.UN CAR.UN MI.UN IIP.UN BEI.UN MEQ
Figures based on consensus estimates as at September 4, 2018.
Source: S&P Global Market Intelligence.
InterRent REIT | 2018 26VALUATION
INTERRENT’S PEG RATIO: AT A DISCOUNT RELATIVE TO ITS PEERS
Price / Consensus AFFO
PEG Ratio(1) 2.6x 2.8x NA 2.0x 1.2x 2.0x 0.9x 3.7x 1.5x NA
P/2018E AFFO P/2019E AFFO
29.8x 28.3x 27.0x 28.8x
26.6x 25.5x 25.4x
21.9x 20.0x 20.8x 19.6x 19.5x
17.4x 16.8x 15.6x
14.6x 14.0x 14.0x
NA NA
IIP.UN CAR.UN MI.UN BEI.UN MEQ KMP.UN RUF.U MRG.UN NVU.UN HOM.U
Price / Consensus NAV
112% 108% 104% 102% 99% 99% 94% 91% 83% 79%
BEI.
ME
MR
P.U
F.U
R.U
UN
UN
UN
HO
UN
MI.
IIP.
KM
NV
RU
UN
CA
M.
G.
U.
Q
U
N
N
Figures based on consensus estimates as at September 4, 2018.
Source: S&P Global Market Intelligence.
(1) PEG Ratio = P/AFFO ('17E) / CAGR of AFFO ('17P-'19E) + current yield
InterRent REIT | 2018 27WHY MULTI-FAMILY?
VERY DEFENSIVE ASSET CLASS
• Multi-family properties known as safest real-estate asset class
• Steady and stable rent increases enabled by short term lease durations
• Lower cost mortgage financing with CMHC insurance and mortgage renewal risk
mitigated
• Acquisitions at a discount to replacement cost
Stable Multi-Family Fundamentals
Multi-Family assets have experienced less volatile changes in vacancy and more
stable Y/Y rent growth over the past 30 years relative to other real estate sectors
Historical Vacancy Historical Y/Y Rent Growth
45%
20%
30%
16%
15%
12% 0%
-15%
8%
-30%
4% -45%
0% -60%
1986 1991 1996 2001 2006 2011 2016 1986 1991 1996 2001 2006 2011 2016
Apts Retail Office Industrial Apts Retail Office Industrial
Source: CBRE. InterRent REIT | 2018 28INTERRENT REIT
NOTES
InterRent REIT | 2018 29INTERRENT REIT
NOTES
InterRent REIT | 2018 30INTERRENT REIT
NOTES
InterRent REIT | 2018 31You can also read