SASSEUR REIT - Growing in a Sunrise Industry - First Listed Outlet Mall REIT in Asia - Investor ...
←
→
Page content transcription
If your browser does not render page correctly, please read the page content below
SASSEUR REIT – Growing in a Sunrise Industry
First Listed Outlet Mall REIT in Asia

SIAS Corporate Connect Seminar          26 Nov 2019

Disclaimer
    NOT FOR RELEASE, PUBLICATION OR DISTRIBUTION IN OR INTO THE UNITED STATES, CANADA, JAPAN OR THE PEOPLE’S REPUBLIC OF CHINA

    This presentation shall be read in conjunction with Sasseur REIT’s financial results announcement dated 14 November 2019
    published on SGX Net.

    This presentation is for information only and does not constitute or form part of an offer, invitation or solicitation of any offer to
    purchase or subscribe for any securities of Sasseur REIT in Singapore or any other jurisdiction nor should it or any part of it form
    the basis of, or be relied upon in connection with, any contract or commitment whatsoever. The value of the units in Sasseur REIT
    ("Units") and the income derived from them may fall as well as rise. Units are not obligations of, deposits in, or guaranteed by, the
    Manager, DBS Trustee Limited, as trustee of Sasseur REIT, Sasseur Cayman Holding Limited, as sponsor of Sasseur REIT or
    any of their respective affiliates. An investment in the Units is subject to investment risks, including the possible loss of the
    principal amount invested. Investors have no right to request that the Manager redeem or purchase their Units while the Units are
    listed. It is intended that unitholders of Sasseur REIT may only deal in their Units through trading on Singapore Exchange
    Securities Trading Limited (the "SGX-ST"). Listing of the Units on the SGX-ST does not guarantee a liquid market for the Units.
    The past performance of Sasseur REIT is not necessarily indicative of the future performance of Sasseur REIT.

    This presentation may contain forward-looking statements that involve risks and uncertainties. Actual future performance,
    outcomes and results may differ materially from those expressed in forward-looking statements as a result of a number of risks,
    uncertainties and assumptions. These forward-looking statements speak only as at the date of this presentation. No assurance
    can be given that future events will occur, that projections will be achieved, or that assumptions are correct. Representative
    example of these factors include (without limitation) general industry and economic conditions, interest rate trends, costs of capital
    and capital availability, competition from similar developments, shifts in expected levels of rental revenue, changes in operating
    expenses, property expenses, governmental and public policy changes and the continued availability of financing in the amounts
    and the terms to support future business.

    Investors are cautioned not to place undue reliance on these forward-looking statements which are based on the current view of
    management on future events.

    DBS Bank Ltd. was the sole financial adviser and issue manager for the initial public offering of Sasseur REIT (the "Offering").
    DBS Bank Ltd. and Bank of China Limited, Singapore Branch were the joint global coordinators to the Offering. DBS Bank Ltd.,
    Bank of China Limited, Singapore Branch, China International Capital Corporation (Singapore) Pte. Limited, Citigroup Global
    Markets Singapore Pte. Ltd., Credit Suisse (Singapore) Limited, Haitong International Securities (Singapore) Pte. Ltd. and
    Maybank Kim Eng Securities Pte. Ltd. were the joint bookrunners and underwriters to the Offering.                                        2
Content

  Section 1   Key Investment Highlights

  Section 2   Overview of PRC’s Outlet Market

  Section 3   About Sasseur REIT

  Section 4   About Sasseur Group

  Section 5   Entrusted Management Agreement (“EMA”) Model

  Section 6   3Q FY2019 Financial Results

  Section 7   Capital Management

  Section 8   Portfolio Update

  Section 9   Investment Merits

                                                             3
Key Investment Highlights

                                                                          Growing middle-class population in the PRC creates a large potential
                       EXPOSURE TO THE                                    customer base for the outlet mall market in the PRC
                       PRC’S FAST-GROWING                                 Resulting increase in spending power represents a sweet spot for the
                       RETAIL OUTLET MALL                                 retail outlet mall industry
                                                                          The PRC‘s outlet industry expected to become the world’s largest
                       SECTOR                                             outlet market in terms of sales revenue by 2030(1)

                                                                          Two right of first refusal properties (“ROFR Properties”) and nine
                                                                          Pipeline Properties
                       STRONG GROWTH
                                                                          Assuming Sasseur REIT acquires the full interest in the ROFR
                       POTENTIAL                                          Properties and Pipeline Properties, it will almost quadraple the total
                                                                          gross floor area of the Initial Portfolio

                       STRATEGICALLY                                      Leading privately-owned outlet mall operator in the Chinese outlet mall
                                                                          industry1
                       LOCATED PORTFOLIO
                                                                          First-mover advantage in the Tier-2 PRC cities with an increasing
                       IN FAST-GROWING                                    addressable market size(2)
                       CITIES                                             Diversified mix of tenants across various trade sectors

(1) Source: China Insights Consultancy
(2) Defined as the sales revenue opportunity available in the outlet industry after considering information such as economic development, population size, residents’
disposable income and outlets penetration

                                                                                                                                                                        4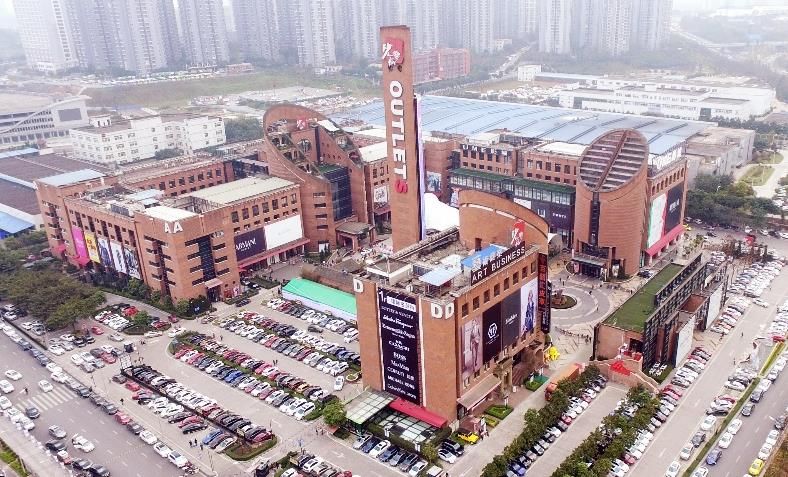
Overview of PRC’s Outlet Market

   Robust retail sales performance in PRC
   PRC’s total retail sales value for consumer goods is expected to grow at CAGR
   of 8.7% between 2016 to 2021, in line with growth in GDP and income levels.

                                                                                   5
Overview of PRC’s Outlet Market (Con’t)

         Riding on the aspiration of                                      Large supply gap presenting                Young industry with ample
1        PRC’s fast growing middle                              2             upside opportunity          3           room to growth further
                    class
     Middle class population in                                            China’s Outlet Industry                 China’s Outlet Industry
               China                                                            (RMB billion)                           (RMB billion)US$96.2
                                                                                                Supply
              (million)                                                                                                                     US$91.5
                                                                                                 gap
                                                                                                 0.5
                  CAGR:                                                       CAGR:
                  12.1%                                                       24.2%
                                                                                                                       CAGR: 17.9%

                                                                          Supply       144.9                                          640                U.S. Outlet
                                        216                                gap                                                                           Industry
                                                                           30.6

          109                                                                                            CAGR: 24.2%
                                                                           49.1
                                                                                                                           145
                                                                                                              49
          2015                         2021E                               2016        2021E                  2016        2021E       2030E
                                                                                                                                         2030E

      Higher urbanization rates to help                                                                       Projected PRC vs U.S. outlet industry in
                                                                          Supply gap represents market
      shift the economy towards a                                                                                               2030
                                                                          opportunity for the outlet
      consumption-based model of                                          industry                              RMB 640 billion
                                                                                                                (US$96.2 billion) vs
                                                                                                                                     US$91.5 billion
      economic growth
                                                                                                                                                                       6
Source: China Insights Consultancy - Independent Market Research Report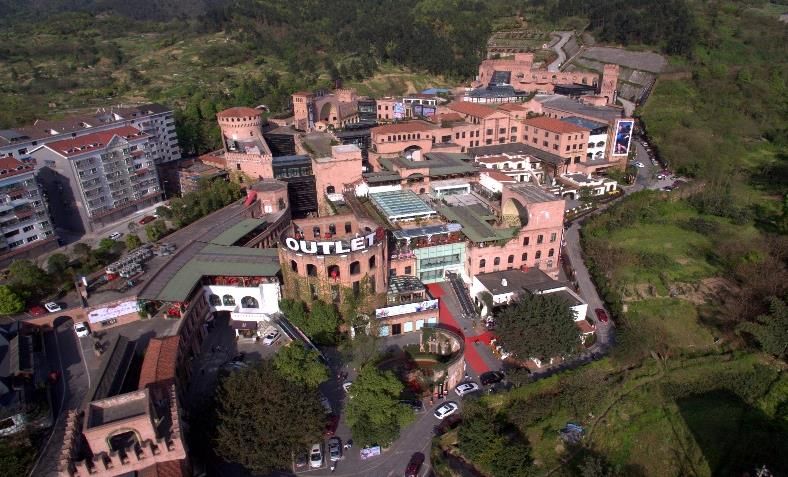
About Sasseur REIT

                      First
                Outlet Mall REIT
                 listed in Asia

                                   7
China-Singapore (Chongqing) Demonstration Initiative on Strategic Connectivity
(Financial Services) 中新(重庆)战略性互联互通示范项目-金融领域项目

                      Listed on SGX mainboard on 28 March 2018

                                        From Left to Right:
                                        i)     Mr Chew Sutat, Head of Equities & Fixed Income,
                                               SGX;
                                        ii)    Mr Liu Guiping, Vice Mayor of the Chongqing
                                               Municipal Government of the People’s Republic of
                                               China;
                                        iii)   Mr Xu Rongcan, Founder of Sasseur Cayman
                                               Holding Limited, Chairman and Non-Executive
                                               Director of Sasseur Asset Management Pte. Ltd.;
                                        iv)    Mr Luke Goh, Deputy Secretary (Trade), Ministry of
                                               Trade and Industry

                                                                                                    8
Sasseur REIT Structure
                                        Chairman Xu                                    L Catterton Asia                              Ping An Real Estate

                                     Sasseur Cayman

                                            100.0%                                                                                            Public

                                      Cayman HoldCo              57. 2%                                                                       42.8%

                                       REIT Manager                                         Sasseur                                          Trustee
                                                                                             REIT
                                                                                              100%

                       100.0%                                                              SG HoldCo

                                                                   Bishan Offshore                             Hefei Offshore             Kunming Offshore
Offshore
                                                                      HoldCos                                    HoldCos                     HoldCos

                                                                         100.0%                                     100.0%                       100.0%
Onshore
                                     Entrusted                       Bishan PRC                                  Hefei PRC                  Kunming PRC
                                     Manager                           HoldCo                                     HoldCo                      HoldCo
                                                        15.0%
                                     Entrusted                           85.0%
                                    Management
                                                                    Chongqing
                                    Agreements
                                                                   PRC HoldCo (1)

                                                                         100.0%                100.0%               100.0%                        100.0%

                                                                     Chongqing               Bishan                 Hefei                      Kunming
                                                                      Outlets                Outlets               Outlets                      Outlets

 (1) Holds 40% interest in Chongqing West Outlets Brand Discount Commercial Co., Ltd. and Shanghai Pacific Rehouse Service Chongqing Co., Ltd.. Remaining 60% interest is held by Shanghai   9
 Pacific Rehouse Service Co. Ltd., an independent third party unrelated to the Sponsor (Sasseur Cayman Holding Limited) or Sasseur REIT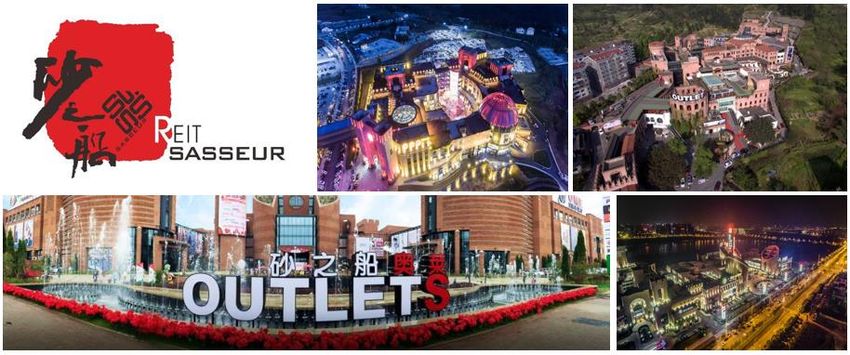
About Sasseur Group – Strong Sponsor
Introduction to Sasseur Group
Changchun
▪ Founded in 1989, Sasseur is one of the leading premium outlet
groups in the People’s Republic of China (“PRC”), that focuses on
the development and operation of retail outlet malls in the PRC
▪ As of November 2019, Sasseur manages 10 outlet malls in 9 major
Chinese cities
Bishan
Xi’an
Hefei
Nanjing
Hangzhou
30 years of history
~40% sales growth
Chongqing (1)
▪ Leverages on the founder’s passion for art and culture to develop Changsha
and design all of Sasseur’s outlet malls, thus offering a unique Guiyang
lifestyle experience for its customers Kunming
Founded by Chairman Xu Supported by Strategic Shareholders
▪ Chairman Xu is the founder and chairman ▪ Largest pan-Asian consumer-
of Sasseur with a wealth of experience in focused private equity firm that
the fashion industry. operates within a global L Catterton
▪ In 1992, he entered the clothing industry platform
and created his own women’s wear fashion ▪ Manages over USD 1.6 billion AUM
line – Sasseur (USD 2.6 billion with co-
▪ In 2008, he built the first Sasseur outlet in investments)(2)
Chongqing, an art piece that has won
numerous awards ▪ Affiliate of the Fortune 500 company
▪ Recipient of numerous prestigious awards Ping An Insurance
▪ Professional real estate investment,
development and management
platform of Ping An Insurance
▪ AUM of approximately RMB 300
(1) CAGR from 2009 to 2018; Sponsor Data billion (USD 61 billion)(3)
(2) Provided by L Catterton Asia on 19 September 2017
(3) Extracted from Ping An Real Estate website (http://realestate.pingan.com/realestate/html/about.html) on 4 January 2018
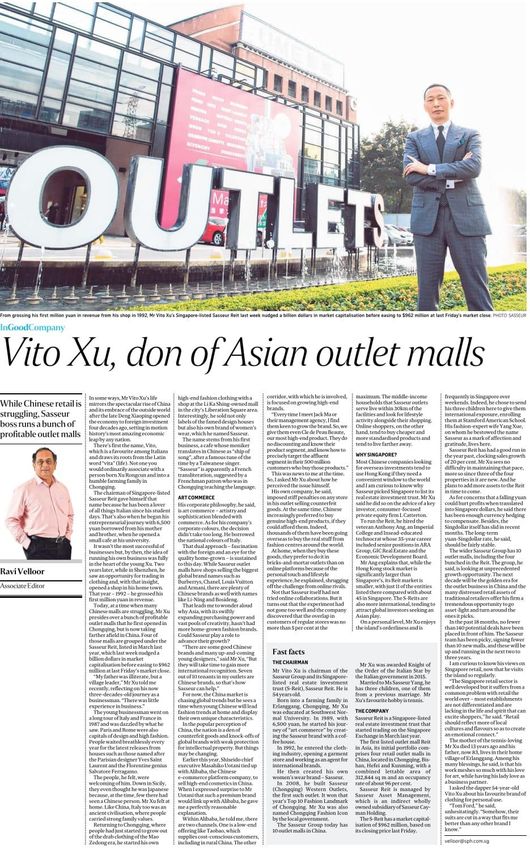
10Chairman Vito Xu - Profile Source: Sasseur REIT Annual Report 2018 Source: The Sunday Times 10 Nov 2019
Strong and Experienced Board of Directors and Management Team

                                              Board of Directors
                                                                                                             Led by Chairman
                                                                                                             Xu, founder and
                                                                                                             chairman of
                                                                                                             Sasseur
                                                Mr Xu Rongcan
                                                  Chairman
                                                                                                             Representatives
                                                                                                             from L Catterton
                                                                                                             Asia and Ping An
           Ms Yang Xue                          Dr Wang Jun                       Dr Zhou Yimin              Real Estate
       Non-Executive Director               Non-Executive Director             Non-Executive Director

                                                                                                             Robust Board of
                                                                                                             Directors with
                                                                                                             extensive
      Mr Mario Boselli               Dr Gu Qinyang        Mr Cheng Heng Tan               Mr Wu Geng         experience in their
    Independent Director       Lead Independent Director Independent Director         Independent Director   respective fields

                                          REIT Management Team
                                                                                                             REIT Management
                                                                                                             Team possesses
                                                                                                             years of relevant
                                                                                                             experience in the
    Mr Anthony Ang Meng Huat   Mr Ken Chew Hian Chin     Ms Jaslyn Leong          Ms Wong Siew Lu            S-REIT space
              CEO                      COO              Financial Controller   Head of Investor Relations
                                                                                  & Corporate Affairs
History & Development of Sasseur Group
• 2016 Top 10 Outlets
• 2016 Innovative
• Best Operator in Outlets
Luxury Industry in • China Innovative
2015 Commercial Real
• 2015 Top 10 Outlets Estate Project
• 2015 Emerging
Outlets
• 2016 Most Promising
• Most Promising Outlet
Chinese Enterprises
• New Mode Retail
Sales
2018
▪ Opened:
2015 - 2016 2017 • Changsha Outlets
• 1st in top 10 ▪ Opened:
Fashion Landmarks ▪ New strategic • Xi’an Outlets
of Chongqing shareholders: ▪ As of May 2019,
2012 – 2014 • L Catterton Asia
• Guiyang Outlets Sasseur Group:
▪ Opened Bishan • Ping An Real • manages 10
Outlets Estate outlets
▪ Opened: • owns 6 of them
• Hefei Outlets
2008 • Kunming Outlets
▪ Opened:
Chongqing
Outlets
▪ Generated sales of Opening of Outlet Malls (GFA in ‘000 sqm) 707
1989 – 1999 over RMB 450m in
its first year Sasseur (Guiyang) Outlets
▪ Art inspired coffee
shop ▪ Among top 3
outlets in PRC Sasseur (Xi'an) Outlets
▪ Distributor for 372
international brands Sasseur (Kunming) Outlets
▪ Started high-end Sasseur (Hefei) Outlets
women's Sasseur 137
brand 73 Sasseur (Bishan) Outlets
Sasseur (Chongqing) Outlets
Source: Sponsor
2008 2014 2016 2017
13Sponsor’s Unique “Super Outlet” Business Model
Integrated destination shopping combining “1+N” business model in the design
1 and operation of Sasseur REIT’s outlet malls
Enhances resilience to competition from online retail platforms by providing a
2 unique lifestyle shopping experience
3 Robust and proactive brand management
4 Alignment of interest with tenants through sales-based leases
5 More than 1.39 million VIP members across the portfolio
14Sponsor’s Unique “Super Outlet” Business Model
“1” represents the outlet mall business platform and “N” reflects the various
lifestyle options offered in each of the outlet malls
Unique lifestyle experience based on a combination of art in the design and
decoration of its outlet malls, and as a one-stop shopping and lifestyle
experience, provides resilience against competition from e-commerce
15Outlet’s Competitive Edge Against Other Retail Models
Outlets Department Store Shopping Mall Online Platform
Luxury and high-end
Product Mix Middle to high-end brands Middle to high-end brands Low priced products
brands
Pricing Strategy Large Discounts Normal Normal Low
Consumer Experience ✓ (small area with compact ✓ (no in-store shopping
layout) experience)
Location Suburbs City Center City Center -
Segment Middle Class Mass Market Mass Market Mass Market
Possibility of counterfeit
Authenticity ✓ ✓ ✓
goods
Brand Owners Customers
▪ Advantages Over Online ▪ Better Shopping Experience
Outlet Malls’
▪ Higher Profit Margin Competitive ▪ Product Authenticity
▪ Quicker Payback Period Edge ▪ High Discounts
▪ Enhanced Inventory Management ▪ Access to a Wide Range of Products
Source: China Insights Consultancy - Independent Market Research Report
16Entrusted Management Agreement (“EMA”) Model
SASSEUR
SASSEUR(KUNMING) OUTLETS
(BISHAN) OUTLETSEMA Model
Business Model REIT Income Model
Gross Revenue EMA Resultant
Outlet Sales EM Base Fee Residual
(GR) Rent (RR)
Outlets Variable Component
(% of Sales)
Chongqing 4.0%
Bishan 4.5%
Fixed
Component Hefei 5.5%
Kunming 5.0%
Variable
Component
EM Performance Fee
▪ Gross Revenue (“GR”) = ▪ EMA Resultant Rent (“RR”) ▪ EM Base Fee: Up to ▪ EM Performance Fee:
Total rental receivable + comprises FC and VC 30% of GR to the 60% x (GR - RR - EM Base Fee)
Income from permissible ▪ REIT paid EMA Resultant Entrusted Manager ▪ Payment to REIT:
investments Rent before EM Base Fee 40% x (GR - RR - EM Base Fee)
▪ VC is pegged to the Sales of
the Outlet
The EMA Model aligns the interest of the Operating Manager with the REIT. 18EMA Model
EMA Resultant Rent (“RR”) Stable distributable income with growth (Illustrative DPU yield)
EMA Resultant Rent
(“RR”)
7.50% 7.82%
Fixed Component + Variable Component
(“FC”) (“VC”)
▪ Fixed Rent with stable ▪ % of total sales for
growth escalation of 3% each property
annually from 2018 FY2018 PY2019
Projected RR Total Return of 11.77% from 2018 to 2019
(SGD million)
124 Stable distributable income guaranteed at 2 levels:
115
(i) ~70% of RR locked in at property level via guaranteed FC,
37 44 VC and
FC
FC (ii) Guaranteed EMA Resultant Rent (“RR”) at portfolio level
Variable Component
~70% 78 80 Outlets
(% of Sales)
Chongqing 4.0%
FY2018 PY2019
Bishan 4.5%
Growth in distributable income is driven by:
Hefei 5.5%
(i) 3% annual escalation in FC and
(ii) VC being % of total sales Kunming 5.0%
193Q FY2019 Key Highlights
SASSEUR (KUNMING) OUTLETS3Q FY2019 Key Highlights
EMA Rental Distributable Distribution NAV
Income(1) Income Per Unit Per Unit
S$30.6 S$19.6 1.640 84.99
million million S Cents S Cents
5.2% y-o-y 7.6% y-o-y 6.4% y-o-y 6.2% as at
IPO
(1) Excluding straight-line accounting adjustment3Q 2019 DPU Increased 6.4% y-o-y
3Q 2019 and 3Q 2018
SGD’000 28 Mar to
Change Change
3Q2019(1) 3Q2018 YTD2019 30 Sep
% %
2018(2)
EMA rental income
(exclude straight-line 30,587 29,081 +5.2 90,590 58,680 n.m.
adjustment)
Income available for
19,579 18,196 +7.6 58,431 36,939 n.m.
distribution to Unitholders
Distribution per Unit (DPU)
1.640 1.542 +6.4 4.904 3.130 n.m.
(SGD cents)
Annualised DPU yield (%) (3,4)
- Based on listing price of 8.1% 7.6% +6.4 8.2% 7.6% n.m.
S$0.80
n.m. - Not meaningful
(1) The actual results of the REIT Group’s foreign subsidiaries were translated using the average SGD:RMB rate of 1: 5.0967 and 1: 5.0242 for 3Q
2019 and YTD 2019 respectively.
(2) The YTD comparative figures were for the period from 28 March 2018 (Listing Date) to 30 September 2018. These figures were extracted from
Sasseur REIT’s results announcement for the period from 28 March 2018 to 30 September 2018.
(3) The annualised distribution yields for 3Q 2019 and YTD 2019 were on a pro rata basis for 92 days and 273 days respectively, based on the listing
price of S$0.800 and closing price of S$0.795. 22
(4) The annualised distribution yields for 3Q 2018 and the period from 28 March 2018 to 30 September 2018 were on a pro rata basis for 92 days and
187 days, based on the listing price of S$0.800 and closing price of S$0.795.YTD 2019 DPU Exceeded Projection By 7.8%
3Q 2019 YTD 2019
Change Change
Actual Projection Actual Projection
% %
Fixed Component
99.8 98.5 +1.4 296.9 295.6 +0.5
(RMB mil)
Variable Component
56.0 56.0 0.0 158.2 151.7 +4.3
(RMB mil)
EMA Rental Income(1)
155.8 154.5 +0.8 455.1 447.3 +1.8
(RMB mil)
Exchange Rate(2)
5.0967 4.9300 +3.4 5.0242 4.9300 +1.9
(RMB/S$)
EMA Rental Income(1)
30.6 31.3 -2.4 90.6 90.7 -0.1
(S$ mil)
Distributable Income
19.6 18.9 +3.7 58.4 54.2 +7.7
(S$ mil)
DPU (S cents) 1.640 1.581 +3.7 4.904 4.551 +7.8
(1) Excluding straight-line accounting adjustment
(2) Using the average SGD:RMB rate for the period. An exchange rate of SGD:RMB of 1:4.930 was adopted in the projection 23EMA Rental Income vs Forecast By Quarter
Six consecutive quarters of outperformance
200
156.9 153.3 154.5 155.8
160 151.3 148.6
142.3 145.8 144.1 146.0
139.6 142.0
61.2 54.8 56.0 56.0
RMB ‘ millions
120 39.8 42.2 50.1 55.6 50.1 45.6 47.5
46.7
80
99.8 99.8 95.6 95.7 95.7 95.7 98.5 98.5 98.5 98.5 98.5 99.8*
40
0
2Q18 2Q18 3Q18 3Q18 4Q18 4Q18 1Q19 1Q19 2Q19 2Q19 3Q19 3Q19
FCST/ Act/实 FCST/ Act/实 FCST/ Act/实 FCST/ Act/实 FCST/ Act/实 FCST/ Act/实
预测 际 预测 际 预测 际 预测 际 预测 际 预测 际
Fixed Component Variable Component
固定部分 浮动部分 * Included fixed component of
Hefei’s additional shop units
acquired during the year 24Distribution Details
Distribution Period 1 1 July to 30 September 2019
Distribution Per Unit1 1.640 Singapore cents
1. Based on 100% distribution pay-out ratio
Distribution Timetable
Notice of Books Closure Date 14 November 2019
Ex-dividend Date 28 November 2019
Books Closure Date 29 November 2019
Distribution Payment Date 27 December 2019
Quarterly distribution pay-out with effect from 1 January 2019
25Sasseur REIT Has Highest Yield VS Other Asset Classes
1
Sasseur REIT Distribution Yield 7.7%
2
Average of the 44 S-REITs and Property Trust 6.2%
2
STI Index 4.0%
CPF Ordinary Account Interest Rate 2.5%
3
MAS Benchmark Govt Bond 10 Year 1.7%
4
Singapore Fixed Deposit Rate 0.6%
Notes:
1. Annualised distribution yield for 3Q2019 based on share price of S$0.85 as at 18 Nov 2019
2. Based on 12M Average Dividend Yield
3. Based on 10 Year Yield
4. 12M Bank fixed deposit rates from MAS as of 30 September 2019
26
Source: Bloomberg, SGX, Central Provident Fund (CPF) Board, data as of 31 October 2019Capital Management
SASSEUR (HEFEI) OUTLETS
27Healthy Balance Sheet
Actual Actual
S$ mil 30 Sep 2019 31 Dec 2018
Investment properties 1,522.0 1,539.5
Cash and short-term deposits 164.1 203.6
Other assets 22.5 25.5
Total Assets 1,708.6 1,768.7
Loans and borrowings 480.0 493.3
Other liabilities 211.7 201.4
Total Liabilities 691.7 694.7
Net Assets 1,016.9 1,074.0
NAV per unit (cents)(1) 84.99 90.33
Aggregate Leverage 29.0% 29.0%
Debt Headroom 276.0 283.0
(1) Based on units in issue and issuable of 1,196,494,243 and 1,188,953,352 as at 30 September 2019 and 31 December 2018 respectively
28Prudent Capital Management
Onshore Facilities Offshore Facility 3Q 2019
Total
(RMB) (SGD)
~SGD 370 million SGD 125 million(1) ~SGD 495 million
Quantum
(RMB 1.90 billion) (~RMB 0.64 billion) (~RMB 2.54 billion)
Debt Headroom1
276
Proportion 74.8% 25.2% 100%
4.5 years
Tenure 5 years 3 years Offshore Debts2
(weighted average)
125 Limit of
45%
Interest Rate (p.a.)
4.43%
(exclude upfront debt- 4.75% 3.49%
(weighted average) Aggregate
related costs)
Leverage
YTD2019: 4.8 times 29.0% Onshore Debts
Interest Cover - - 370
(FY2018: 4.1 times)
PBOC benchmark Singapore
Floating Rate -
1-5 years lending rate SOR
(1) 50% of Offshore Loan is hedged As at 30 September 2019
Note: All calculations are done according to the SGD to RMB exchange rate of 5.1355 as at 30 September 2019
29Debt Maturity Profile
Weighted average debt maturity is 2.98 years with
no major re-financing until 2021
S$ million
Debt Maturity
347
133
- 8 8
2019 2020 2021 2022 2023
30Portfolio Update
SASSEUR (HEFEI) OUTLETSPortfolio Summary
Portfolio
Valuation * : 7,810 mil
NLA : 312,844 sqm
Occupancy ^ : 95.4%
Hefei Outlet Mall
Valuation : 2,624 mil
NLA : 144,583 sqm
Occupancy : 95.0%
Chongqing Outlet Mall
Bishan Outlet Mall Kunming Outlet Mall
Valuation : 2,901 mil
Valuation : 790 mil Valuation : 1,495 mil * Based on independent valuation as at 31 Dec 18 by Savills
(RMB million) and the average independent valuation as at NLA : 50,885 sqm
NLA : 47,308 sqm NLA : 70,067 sqm
28 Feb 2019 by Savills and JLL for the shop units in Hefei
Occupancy : 94.8% Outlet which was acquired on 14 May 19. Occupancy : 100% 32
Occupancy : 91.9% SASSEUR (HEFEI) OUTLETS
^ Occupancy for 3Q 20193Q 2019 Outlets Summary
YTD 2019 Total Outlet Sales Increased 20.9%
Q3 20191 Q3 2019 vs YTD 20193 YTD 2019 vs
NLA Occupancy
Outlets Sales Q3 20182 Sales YTD 20184
(sqm) (%)
(RMB’mil) Change (%) (RMB’mil) Change (%)
Chongqing 50,885 100.0 579.7 -5.4 1,669.0 +8.9
Hefei 144,583 95.0 286.4 +32.2 802.5 +28.8
Kunming 70,067 94.8 238.0 +26.9 647.3 +44.4
Bishan 47,308 91.9 114.3 +18.6 332.3 +32.7
Portfolio 312,844 95.4 1,218.4 +9.4 3,451.1 +20.9
1. Q3 2019: 01 July 2019 – 30 September 2019
2. Q3 2018: 01 July 2018 – 30 September 2018
3. YTD 2019: 01 January 2019 – 30 September 2019
4. YTD 2018: 01 January 2018 – 30 September 2018
33
SASSEUR (HEFEI) OUTLETSPortfolio Occupancy (3Q 2019 vs 2Q 2019)
4 Outlets Malls enjoy high stable occupancy
100.0% 100.0% 97.9% 95.4%
95.0% 93.3% 94.8% 95.8%
91.9% 92.7%
3Q19 2Q19 3Q19 2Q19 3Q19 2Q19 3Q19 2Q19 3Q19 2Q19
重庆 ChongQing 璧山 Bishan 合肥 Hefei 昆明 Kunming 项目组合 Portfolio
3Q 2019 vs 2Q 2019
34Weighted Average Lease Expiry (WALE)
Deliberate short lease to optimise tenant mix
Lease Expiry by NLA & Property Income WALE by :
80.0%
NLA 3.1 years
68.8%
70.0%
Property Income 1.4 years
60.0%
50.0%
44.1%
40.0%
30.0%
24.7%
20.0%
14.4% 13.6%
12.1%
10.0% 6.6% 7.2%
4.7% 3.9%
0.0%
2019 2020 2021 2022 2023 & beyond
As at 30 September 2019 by NLA by Property Income
35
SASSEUR (HEFEI) OUTLETSVIP Members - Growth by Outlets
Total VIP members have jumped 70% from end of 2018 to reach 1.391 million
2017 2018 YTD 2019
1,600
1,391
1,400
1,200
Members in '000
1,000
819
800
600 486
400 352 322
231
200
0
Chongqing Bishan Hefei Kunming Total
36Well Diversified Trade Mix
Breakdown of NLA(1) by Trade Mix Breakdown of Revenue(2) by Trade Sector
Anchor Tenants 1.7%
Ad-hoc Outlet 3.2% Lifestyle 0.8% Kids By Revenue
Lifestyle 3.5%
Ad-hoc Outlet 2.0% Amusement
Children 3.9% Park 0.6%
F & B 3.4%
Shoe Wear 4.3%
Miscellaneous 4.0%
Kids
Amusement Shoe Wear 4.1%
Park 4.3%
Children 5.5%
Fashion
Miscellaneous 34.6% Fashion
5.2% 39.8%
Sports
F & B 6.3% 15.1%
International
Anchor Brands 13.1% International
Sports 9.9% Tenants Brands 23.1%
11.7%
Fashion, Sports and International Brands
57.6% 78.0%
(1) As percentage of the portfolio’s net lettable areas as at 30 September 2019 37
(2) As percentage of the portfolio’s gross revenue as at 30 September 2019Chongqing Outlets
Year Commenced Operations Sep 2008
GFA (sqm) 73,373
NLA (sqm) 50,885
Occupancy Rate (%, 30 Sep 19) 100
No. of Tenants (30 Sep 19) 435
FILA, Adidas, +39 Space,
Top Brands/Tenants
High Wave, Naersi
Car Park Lots 500 Source: Google Maps (November 2019),
China Insights Consultancy (March 2017)
38
Valuation (RMB mil, 31 Dec 18) 2,901Bishan Outlets
Year Commenced Operations Oct 2014
GFA (sqm) 68,791
NLA (sqm) 47,308
Occupancy Rate (%, 30 Sep 19) 91.9
No. of Tenants (30 Sep 19) 212
Adidas, Nike, Polo Sport,
Top Brands/Tenants
OBEG, +39 Space
Source: Google Maps (November 2019),
Car Park Lots 400
China Insights Consultancy (March 2017)
39
Valuation (RMB mil, 31 Dec 18) 790Hefei Outlets
Year Commenced Operations May 2016
GFA (sqm) 147,316
NLA (sqm) 144,583
Occupancy Rate (%, 30 Sep 19) 95.0
No. of Tenants (30 Sep 19) 336
Adidas, Coach, Michael Kors,
Top Brands/Tenants
Nike, Hazzys Source: Google Maps (November 2019),
China Insights Consultancy (March 2017)
Car Park Lots 1,566
40
Valuation (RMB mil) 2,624 SASSEUR (HEFEI) OUTLETSKunming Outlets
Year Commenced Operations Dec 2016
GFA (sqm) 88,257
NLA (sqm) 70,067
Occupancy Rate (%, 30 Sep 19) 94.8
No. of Tenants (30 Sep 19) 251
Nike, Adidas, Fila, Polo
Top Brands/Tenants
Sport, +39 Space Source: Google Maps (November 2019),
Car Park Lots 2,000 China Insights Consultancy (March 2017)
41
Valuation (RMB mil, 31 Dec 18) 1,495 SASSEUR (HEFEI) OUTLETSExciting Events to Drive Shoppers’ Traffic
42Anniversary Celebrations : Record Breaking Sales on First Day
Chongqing Bishan Hefei Kunming Total
2019 RMB 131.2 million RMB 20.8 million RMB 34.9 million RMB 28.7 million RMB 215.5 million
2018 RMB 130.0 million RMB 16.7 million RMB 27.3 Million RMB 24.0 million RMB 197.9 million
Change
1% 25% 28% 20% 9%
y-o-y
43Potential Pipelines
• All acquisitions must be yield accretive
• First China, then the World Changchun
• Potential properties increased to 11
ROFR Properties
Lanzhou Xi’an Yangzhou
Xi’an Guiyang Shanghai
Nanjing
Changsha Hangzhou
Opening Date Sep 2017 Dec 2017 Guiyang Xiamen
Shenzhen
GFA (sqm) 141,708 193,520
Car Park Lots c.2,000 c.1,000
Opening Soon
Pipeline Properties
Nanjing Hangzhou Changchun Changsha Lanzhou Xiamen Shenzhen Yangzhou Shanghai
Opening
May 2015 Jun 2011 Sep 2017 Dec 2018 ~4Q 2019 ~3Q2020 ~4Q 2020 ~4Q 2020 ~3Q2021
Date
GFA (sqm) 149,875 45,873 172,128 210,600 ~100,000 ~75,000 ~150,000 ~85,000 ~109,000
Car Park
c.8,000 c.5,000 c.4,000 c.2,084 c.2,500 c.2,000 c.2,200 c.1,200 c.2,500
Lots
44Investment Merits
45
SASSEUR (KUNMING) OUTLETSInvestment Merits
Market Leadership: Sasseur Group is the one of the largest operator of outlet
1 malls in China, with 10 malls and over 11 years of operating experience
Unique Art-Commerce Business Model: Aligns interests of tenants,
2 unitholders and entrusted managers, with potential to share upside
6 Consecutive Quarters of DPU Outperformance Since Listing:
3 Beating forecast for 2018 and projection for 2019
One of the Top Performing S-REIT 2019: Total YTD Return 42.0% as per OCBC
4 Investment Research (as of 18 Nov 2019)
Strong Partnerships: Longstanding business relationships with leading
5 premium international and local retail brands
46Awards and Achievement
The Asset Asian (Triple A) Awards 2018
1 Best IPO in Singapore 2018
Fortune Times REITs Pinnacle Awards 2018
2 Most Promising REIT in Asia
2018 Asia Pacific Best of Breeds REITs (less than USD 1 billion
3 market capitalization) - Gold Award Retail REITs (Singapore)
Alpha Southeast Asia 12th Annual Best Deal & Solution
4 Awards 2018 - Best REIT Deal in Southeast Asia 2018 as
Southeast Asia’s largest REIT IPO S$396 mil for 2018
International Investor Magazine
5 REIT Company of The Year – Singapore 2019
6th Asia Pacific REITs Awards 2019
Best Retail REIT (Platinum)
6 Best CEO (Platinum)
47
Best Investor Relations (Gold)Thank You
For enquiries, please contact:
Ms Wong Siew Lu, CFA, CA (Singapore)
Head, Investor Relations and Corporate Affairs
Email: wongsl@sasseurreit.com
Tel: +65 6360 0290
Address: 7 Temasek Boulevard, #06-05, Suntec Tower One,
Singapore 038987You can also read