1Q 2019 INVESTOR PRESENTATION
←
→
Page content transcription
If your browser does not render page correctly, please read the page content below
INVESTOR
PRESENTATION
1Q 2019
8000 Sunset Strip Shopping Center
Los Angeles, CA

                                    FORWARD LOOKING
                                    STATEMENTS
                                    Statements included herein that state the Company’s
                                    or Management’s intentions, hopes, beliefs,
                                    expectations or predictions of the future are “forward-
                                    looking” statements within the meaning of the Private
                                    Securities Litigation Reform Act of 1995 which by
                                    their nature, involve known and unknown risks and
                                    uncertainties. The Company’s actual results,
                                    performance or achievements could differ materially
                                    from those expressed or implied by such statements.
                                    Reference is made to the Company’s regulatory
                                    filings with the Securities and Exchange Commission
                                    for information or factors that may impact the
                                    Company’s performance.

                                                                                              2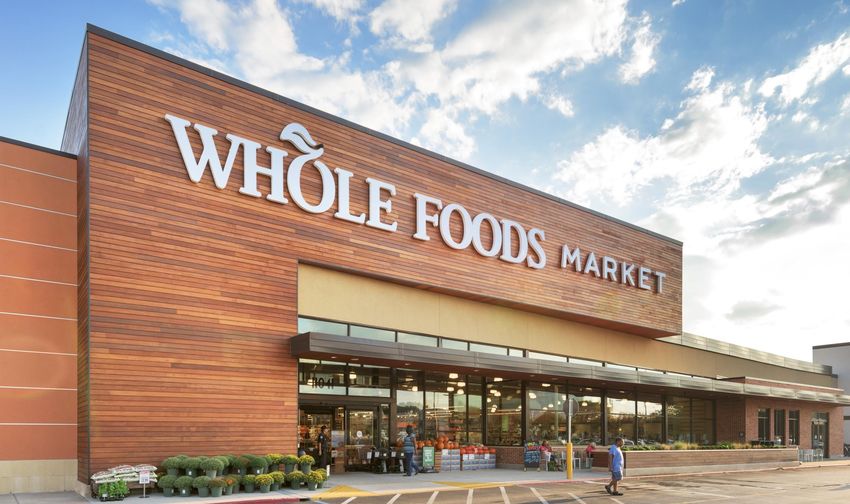
COMPANY OVERVIEW
As of 3/31/19

                >75%                                                                                  5.3x
   Grocery Anchored                 $5.6B                                          80%                 Net Debt
                                                                                                     to EBITDAre
                                                                          NOI in Top      40            No Significant
  with average sales of                                                                              Maturities until 2022
                                 Total Enterprise Value                       CBSAs
        $678 PSF

                                 BEST IN CLASS                         EXPERIENCED
                PROVEN            RETAILERS                            TEAM
                RESULTS                        Diversified
                3 Yr. Average                  Tenancy
  SSNOI growth of 2.8%,                                                     of Real Estate
                                                                      Professionals with a Best in
                                                                                                       >$550M
 including redevelopments       Top 5 Tenants Include: TJX, Kroger,                                   RE / DEVELOPMENT
                                  Whole Foods, Ross, and H-E-B         Class Operating Platform
                                                                                                          PIPELINE

 Nottingham Commons                                                   Wellington Green Commons
 Nottingham, MD                                                       Wellington, FL

                                                                                                                             3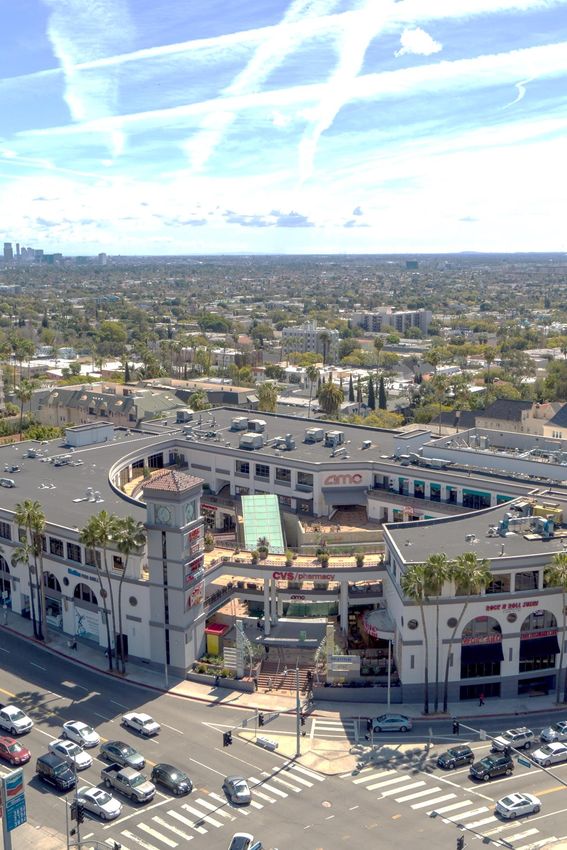
Atlantic West Shopping Center
Jacksonville, FL

                                HIGH QUALITY
                                PORTFOLIO
Hilltop Village Center
Alexandria, VA
STRATEGIC TARGET MARKETS - FOCUSED ON GROWTH

                     FOCUS ON URBAN LOCATIONS IN MARKETS THAT WILL CONTINUE TO GROW
             •   Solid job growth                                                        • Lower cost of living
             •   Pro business environment/low tax states                                 • Benefiting from migration within the US
             •   Highly educated population                                              • Benefiting from immigration to the US
             •   Densely populated areas with barriers to entry

                                                TARGET MARKETS REPRESENT >90% OF NOI

                                           TOP STATES
                                              Target Market (as noted)
                                              Non-Target Market States

                   Regional Office

Source: STI: Popstats, Evercore ISI Annual Demographic Update March 12, 2019
▪ WRI demographics are for a 3 mile trade area and weighted by ABR  ▪ Q119 peer information includes BRX, FRT, KIM, REG, RPAI, and SITC   5
TOP 12 CENTERS COMPRISE ~25% OF TOTAL PORTOLIO

    The Palms at Town & Country                     River Oaks Shopping Center                        Westminster Center
1                                               2                                                 3
    Miami, FL                                       Houston, TX                                       Los Angeles, CA

    ABR:                   3 Mile Population:       ABR:                    AHHI:                     ABR:                  3 Mile Population:
    $26.77 PSF             170,000                  $33.85 PSF              $155,000                  $20.14 PSF            210,000

Major Tenants: Publix, Kohl’s, Nordstrom        Major Tenants: Kroger, Barnes & Noble, Perry’s,   Major Tenants: The Home Depot, Albertsons,
Rack, Dick’s, Marshalls, CVS, Total Wine        Americas, Sur La Table, Barry’s Bootcamp          Ross Dress for Less, Petco, Rite Aid

    Colonial Plaza                                  8000 Sunset Strip                                  Largo Mall
4                                               5                                                 6
    Orlando, FL                                     Los Angeles, CA                                    Largo, FL

    ABR:                   3 Mile Population:       ABR:                    AHHI:                     ABR:                  3 Mile Population:
    $15.87 PSF             120,000                  $45.03 PSF              $119,000                  $18.80 PSF            115,000

Major Tenants: Ross Dress for Less, Petco,      Major Tenants: Trader Joe’s, AMC Theatres,        Major Tenants: Publix, Bed Bath & Beyond,
Old Navy, Marshalls, Staples, Stein Mart        Crunch Fitness, CB2, CVS                          Marshalls, PetSmart, Staples, Target (OBO)

                                                                                                                                                 6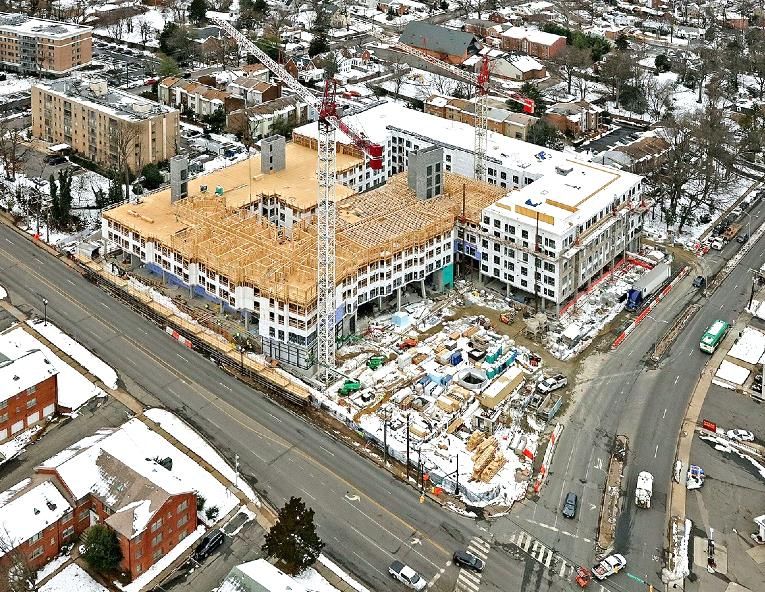
TOP 12 CENTERS COMPRISE ~25% OF TOTAL PORTOLIO

     Chino Hills Marketplace                          Centre at Post Oak                              Mueller Regional Retail Center
7                                                 8                                              9
     Los Angeles, CA                                  Houston, TX                                     Austin, TX

     ABR:                   AHHI:                     ABR:                  AHHI:                     ABR:                 3 Mile Population:
     $22.03 PSF             $103,000                  $37.97 PSF            $145,000                  $17.71 PSF           165,000

Major Tenants: Smart & Final, Rite Aid, Dollar   Major Tenants: Marshalls & HomeGoods,           Major Tenants: Home Depot, Best Buy, Bed
Tree, 24 Hour Fitness                            Nordstrom Rack, Old Navy, Grand Lux, Morton’s   Bath & Beyond, Marshalls, PetSmart, Old Navy

      Hilltop Village Center                          Village Plaza at Bunker Hill                    Perimeter Village
10                                               11                                              12
      Alexandria, VA                                  Houston, TX                                     Atlanta, GA

     ABR:                   % College Grads:          ABR:                  AHHI:                     ABR:                 AHHI:
     $34.68 PSF             58%                       $24.94 PSF            $133,000                  $21.49 PSF           $111,000

Major Tenants: Wegmans, L.A. Fitness              Major Tenants: HEB, Academy, Burlington,       Major Tenants: Walmart, DSW, Cost Plus
                                                  Sam Moon, PetSmart, Nordstrom Rack             World Market, Hobby Lobby

                                                                                                                                                7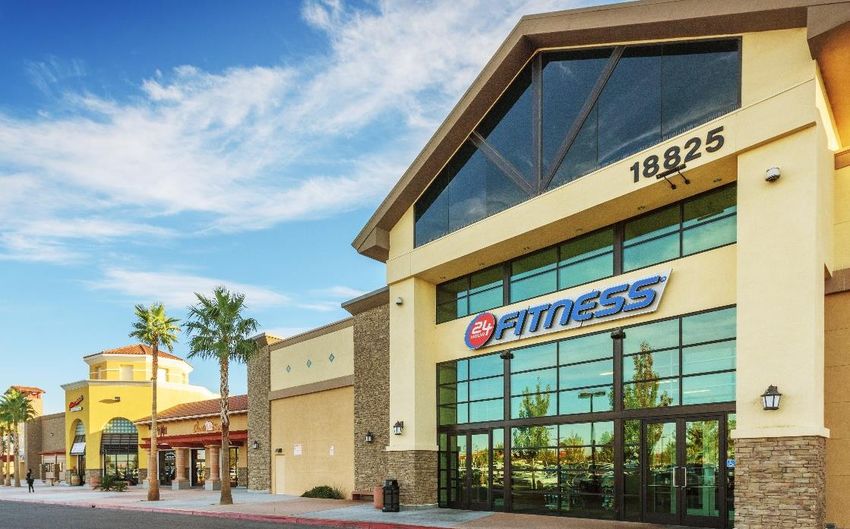
CREATING A SUPERIOR COMPANY

Our emphasis is on:

    CREATING A HIGH QUALITY PORTFOLIO THAT IS PRIMARILY SUPERMARKET
               ANCHORED SURROUNDED BY QUALITY TENANTS
      • Since 2015, sold over 20 Power Centers out of 61 property sales that have longer-
        term cash flow volatility
      • Reduced weak tenant exposure including office supply, electronics, books,
        independent grocer and pet tenants
      • Exited low growth and tertiary markets

         POSITIONING THE BALANCE SHEET FOR FUTURE OPPORTUNITIES

      • Staggered debt maturities with no significant                            2200 Westlake
                                                                                    Seattle, WA
        commitment until 2022
      • Balance sheet capacity with nothing
        outstanding under $500M revolving credit line.

                                                                                                  8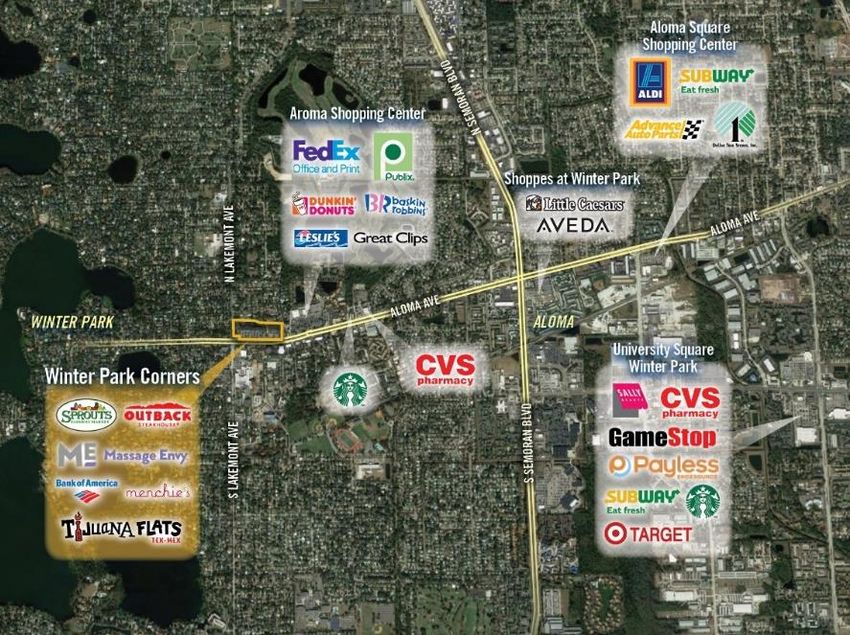
GOODBYE KANSAS…HELLO HOLLYWOOD!

  Over the 9 years (2010 – 2018),                         WRI Portfolio consists of:
 sold $2.9 Billion and acquired               Properties that   Quality Properties that           Recession and
    $1.3 Billion of property                produce sustained   demand higher NAV per            internet resistant
                                              growth in NOI         dollar of NOI                    cash flow

 + AQUISITIONS                                                  - DISPOSITIONS
     + High barrier-to-entry trade areas                            - Non-core markets
                                                                    - Smaller Centers
     + Located in strong growth markets
                                                                    - Independent supermarkets
     + Larger properties to drive efficiencies
                                                                    - Limited growth prospects
     + Supermarket anchored
                                                                    - Higher risk profile

 8000 Sunset Strip SC                                           Shawnee Village SC
 Los Angeles, CA                                                Shawnee, KS

                                                                                                                      9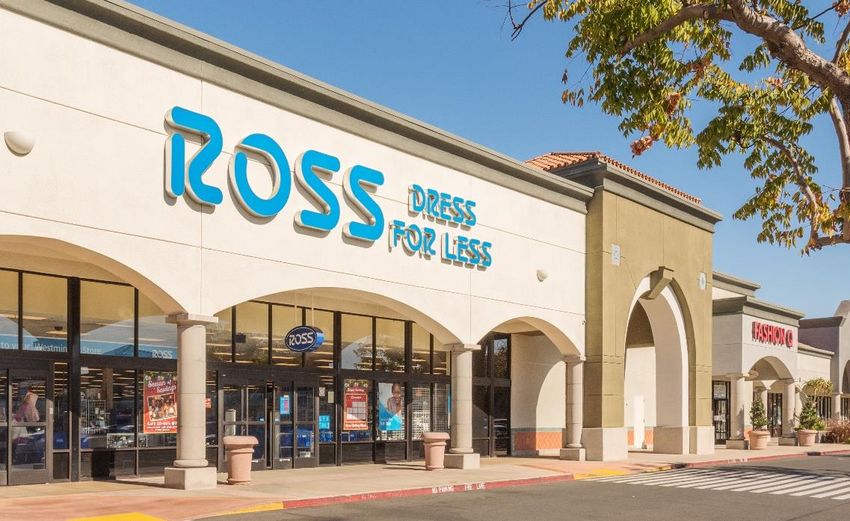
RESULTS OF PORTFOLIO REPOSITIONING

                        ACQUISITIONS    DISPOSITIONS    Change
 Number of Properties        33              169                    Acquisitions to improve the quality of the
 GLA SF                     5.8 M          16.2 M                   portfolio:
 ABR PSF                   $23.35          $12.57        86%
                                                                    • High quality acquisitions with superior
 Avg HH Income (a)        $101,000         $76,000       33%
                                                                      demographics in major metropolitan markets
 Households (a)            59,000          37,000        59%
                                                                    • Strong supermarkets (Whole Foods, H.E.B.,
 Population (a)            139,000         97,000        43%
                                                                      Kroger, Wegmans, Publix) to drive traffic to
 College Grads (a)         61.4%           35.9%         71%
                                                                      retailers
                                                        138%
 Grocer Sales PSF           $987            $415
                                                                    • Embedded growth
 Volume                  $1.3 Billion    $3.0 Billion

                                                                                  TOTAL PORTFOLIO RESULTS
                                                                                                   12/31/10   3/31/19   Change
    While selling lower quality properties in                    Number of Properties                312       177
    tertiary markets results in:                                 GLA SF                             32.8 M    22.6 M

    • Superior quality portfolio of national and                 Avg Base Rent PSF                  $13.60    $19.45     43%
      regional tenants                                           Average HH Income (a)             $80,000    $93,000    16%
    • Sector leading operating results                           Households (a)                     39,000    49,000     26%
    • Platform positioned for sustainable growth                 College Graduates (a)              37.0%     47.5%      28%
                                                                 Grocer Sales PSF                   $460       $678      47%
                                                                 Net Debt + Preferreds to EBITDA   7.96x      5.32x      -3x

(a) Weighted by ABR                                                                                                              11
WRI IN HOUSTON - TRANSFORMED PORTFOLIO
As of 3/31/19
WRI Centers have
Nearly 70% of WRI’s Houston NOI is within 5 miles of The Galleria higher AHHI and %
Kingwood
college grads than the
Houston CBSA
The retail per capita
space in the trade area TOTAL HOUSTON
around our centers has PORTFOLIO TODAY
declined as a result of Humble
significant multi-story Average HH Income(a)
development Sam Houston Pkwy
$123,000
WRI Houston Centers vs.
primarily service $91,000(b)
Super Zips Houston CBSA
Population(a)
Baytown
Westheimer Rd
157,000
Pasadena
ABR PSF
Sugar Land
Sam Houston Pkwy
Clear Lake
Richmond
$21.22
First Colony (a) Weighted By ABR
(b) STI Popstats Q2 2018
Pearland Note: Demographics For 3 Mile Trade Area.
Rosenberg
LEGEND Friendswood
League City
Super Zip WRI Center Sold in whole or part 12DIVERSIFIED TENANTS
Top Tenants by ABR Credit Ratings (S&P/ Moody’s) # Stores % ABR
Brownsville Commons
1. TJX Companies A+/A2 34 2.3% Powder Springs, GA
2. Kroger BBB/Baa1 19 2.3%
3. Whole Foods Market A+/A3 8 2.0%
4. Ross Stores A-/A3 29 2.0%
5. H-E-B N/A/N/A 8 1.9%
6. PetSmart CCC/Caa1 19 1.4%
7. Albertsons N/A/N/A 13 1.3%
8. 24 Hour Fitness B/B2 7 1.3%
9. The Home Depot A/A2 3 1.2% WRI’s diversified tenant base
10. Dollar Tree Stores BBB-/Baa3 33 1.0%
has limited exposure to any
Top 10 16.7%
single tenant.
11. Bed, Bath & Beyond BB+/Baa3 14 0.9%
12. Best Buy BBB/Baa1 7 0.9% Diversification is especially
13. Office Depot B/Ba3 15 0.8% important in today’s changing
14. Petco Animal Supplies CCC+/B3 15 0.8%
retail market.
15. Walmart Stores AA/Aa2 6 0.8%
16. Dick’s Sporting Goods N/A/N/A 4 0.7%
TOP 10 - % OF ABR
17. Barnes & Noble N/A/N/A 6 0.7%
27%
18. Starbucks BBB+/Baa1 35 0.6%
19. Nordstrom BBB+/Baa1 4 0.6% 20% 20% 20%
Hobby Lobby Stores N/A/N/A 5 0.6%
17% 17% 17%
20.
21. Party City B+/Ba3 14 0.6%
22. CVS BBB/Baa2 13 0.6%
23. Sprouts N/A/N/A 4 0.6%
24. Gap BB+/Baa2 7 0.6% WRI BRX RPAI ROIC REG KIM SITC
25. JP Morgan Chase Bank A+/Aa2 17 0.6%
Top 25 27.1%
12HIGHLY PRODUCTIVE GROCERS
GROCER SALES AVERAGE 80% OF OUR ABR IS IN SHOPPING
$678 PSF CENTERS WITH A GROCER COMPONENT
Portfolio Segmentation Portfolio Segmentation
% of Sales
80% ABR PSF
Grocery National 42% $614
with
Another
Grocery Anchor
Anchored 27% Strong Grocery Ties:
53% Regional 24% $762 Relating to a grocery
store started in 1901,
Power Weingarten Realty
and has always
Specialty Specialty 14% $676 emphasized the
25% stability of grocery
anchored centers to
our continued
Total 80% $678 success.
>75% of our National and Regional grocers like Shoppers typically visit each
Kroger, Whole Foods, Walmart, Publix and HEB 90,000 of our grocers every month
have curbside pickup and/or deliver options
(1) Includes neighborhood and community centers with a grocer
(2) Includes power center with a grocer 13WRI’S TENANT BASE IS 79% INTERNET RESISTANT
LOW INTERNET 98% of Weingarten’s
79% Portfolio
TENANT Composed of Retailers Thriving
TYPE COMPOSITION in the NewPOTENTIAL
BY ABR LandscapeRISK 18%
VULNERABILITY
Quick Service & Full Service Pet Stores & Services 4%
Restaurants 19%
Some Apparel 4%
Services 16%
Beauty Supplies 2%
Supermarkets 13%
Drugstores 2%
Recreation/Entertainment 8% 18% Sporting Goods 2%
Discount Apparel 7% 79% Footwear 1%
General Merchandise & Other
Misc. Retail 6% Liquor / Tobacco 1%
3%
Home Furnishings 5% Optical 1%
Medical 5% Party Supplies 1%
INTERNET
VULNERABLE 3%
Books 1%
Internet Resistant Potential Risk Internet Vulnerable
Electronics 1%
Office 1%
TOTAL 100%
14OMNICHANNEL RETAILERS ARE THE WINNERS
Having an omni-channel presence is important in today’s retail environment:
• 67 percent of shoppers in the US have used buy online, pick up in-store (BOPIS) in the past six months(1);
• 50 percent of consumers have decided where to shop online based on whether they could pick up their order in store (1)
• Seamless mobile, website and in-store shopping experience is what the modern consumer wants (2)
Four Retailer Examples -
Has invested over $1.2 billion to its omnichannel • In 2018 digital sales grew 58% and grocery
program(2) pickup and delivery reaches 91% of the
• Buy online, pick up in store households within Kroger’s reach
• Grocery pickup available at 140 stores with more • Invested $589 million in Ocado, one the world’s
rolling out weekly largest online grocery retailer, on two fulfillment
• Creative pricing centers and Home Chef for customizable meal
kits
• In 2018 digital sales grew 36% with stores
fulfilling nearly ¾ of those sales Digital sales accounting for 10% of sales in 2018 and
• “America’s easiest place to shop” 15.7% of Q1 2019 sales, showing tremendous growth
• Deliver from store offering same day and potential.(5)
free 2-day shipping • They offer a ‘Digital Pick Up Shelf’ for mobile orders
• Drive Up which also serves and an in-store marketing tool to
• Order Pickup raise awareness of digital offerings to customers.
(1) Top Omnichannel Retailers Adopting BOPIS Programs at a High Rate, mytotalretail.com, May 8 2019
(2) How Walmart is Leading the Omni-channel Strategy Charge, etailwest.com,
(3) ‘Target Stock Can Keep Surging Because the Company Can Parry Amazon’s Moves, Analyst Says,” www.barrons.com, April 29, 2019
(4) ‘Our Best Customers are Omnichannel customers’: Inside Ulta Beauty’s channel-agnostic growth strategy, www.glossy.com, December 20, 2018 15
(5) “Digital Sales Push Chipotle’s Growth in Q1,” forbes.com, April 26, 2019SMALL SHOP LEASING
Less than 10,000 square feet
Home 4%
General
Merchandise 4%
Other 1%
Service Apparel 5%
58%
Restaurant
(QSR and
Full Service)
28%
Percentages based upon the number of leases
for the 12 months ended March 31, 2019
16MINIMAL EXPOSURE TO AT-RISK TENANTS
CURRENT AT-RISK TENANTS
AS OF 3/31/19
At-Risk Tenants WRI Store Count % of ABR The Portfolio Transformation
focused on disposing of
17 0.54% properties with high risk
profiles which has resulted in
5 0.29% minimal exposure and
disruption from at-risk tenants
2 0.19%
9 0.18%
4 0.10%
TOTAL 37 1.30%
17PROVEN PERFORMANCE
LEASED OCCUPANCY SAME PROPERTY NOI(a)
5.0% 4.2% 4.2%
96.0% 95.4% 3.4% 3.1%
95.1% 2.7%
94.8% 94.8% 2.2% 2.1%
94.3% 94.4% 2.5%
94.0% 93.7% 0.2% 0.4%
93.0% 93.0% 0.0%
91.8%
92.0% -2.5%
-5.0% -3.8%
90.0%
2009 2010 2011 2012 2013 2014 2015 2016 2017 2018
2009 2010 2011 2012 2013 2014 2015 2016 2017 2018
ABR PSF RENT GROWTH
$20.00 $19.35 14.0% 12.5% 13.1%
$18.69
11.6%
12.0% 10.1%
$17.93 10.0%
$18.00 8.5%
$16.92 8.0% 6.3%
$16.24
$15.66 6.0% 4.2%
$16.00 $15.14 4.0% 2.0%
$14.51
2.0%
$14.00 $13.60
$13.31 0.0%
-2.0% -0.4%
$12.00 -4.0% -2.5%
2009 2010 2011 2012 2013 2014 2015 2016 2017 2018 2009 2010 2011 2012 2013 2014 2015 2016 2017 2018
WRI Peer Average
Note: Q119 peer information includes BRX, KIM, REG, RPAI and SITC (excl FRT for comparability purposes)
(a) Excludes redevelopment.
18ENVIRONMENT | SOCIAL | GOVERNANCE
ENVIRONMENT SOCIAL GOVERNANCE
From existing properties to new We value the people around us, and Good governance practices sets the
developments, Weingarten Realty has work to maintain the relationships with foundation for achieving the Company’s
actively embraced various initiatives that our communities, tenants, associates vision and mission, while staying
support the future of environmentally and stakeholders. accountable to stakeholders. Weingarten
friendly retail centers. To us, Realty adheres to the following practices:
• Engages community involvement with
environmental responsibility is reducing recycling events, volunteerism, • Maintains a qualified and competent
the Company’s carbon footprint through: philanthropy projects, and more Board of Directors
• Recycling and waste diversion • Assist in associate development • Emphasizes a culture of diversity,
• Energy management and Lighting through educational seminars, integrity and ethical business dealings
retrofits continued education, and mentorships
• Water and Landscape Management • Identifies and assess potential risk
• EV Charging and Public • Provides a program for health & • Reports with transparency, accuracy,
Transportation Initiatives wellness, including exercise and accessibility
• Green Leasing challenges, nutritional education, and
mental health awareness
View the Weingarten Realty Corporate Responsibility Report at bitly.com/2017WRICRR. 19West Alex
Alexandria, VA
The Driscoll at River Oaks
Houston, TX
STRATEGIC
GROWTH
Sunset Point 19
Clearwater, FLCREATING VALUE THROUGH NEW DEVELOPMENT
Developments and Large The Driscoll
Redevelopments
West Alex Centro Arlington
at River Oaks*
Location Alexandria, VA Arlington, VA Houston, TX
Cost Incurred To Date $136,000 $89,000 $29,000
Estimated Final $200,000 $135,000 $150,000
Anchor Tenants Harris Teeter (Kroger) Harris Teeter (Kroger) Kroger
Retail 100,000 SF 72,000 SF 11,000 SF
Multifamily 278 units 366 units 318 units
*The Driscoll at River Oaks is an addition to our 320,000SF River Oaks shopping center. 21CREATING VALUE THROUGH REDEVELOPMENT
Redevelopments Estimated
Description
Under Construction Costs
Reposition former supermarket with
Sunset Point 19 $23M
Sprouts and add shop space
River Point at Sheridan 13M Add Burlington and shop space
Reposition former supermarket with
Winter Park Corners 12M
Sprouts and add shop space
The Shoppes at Wilderness 7M Add multi-tenant building
All other 27M
Total Under Construction $82M
22CREATING VALUE THROUGH RE / NEW DEVELOPMENT
Robust Future Future Pipeline Driving Value
• Larger Scale Potential Future Redevelopments – adding densification including
residential
• Cambrian Park Plaza
• El Camino Promenade
• Gateway Plaza
• River Oaks additional phases
• Palms at Town & Country
• Centre at Post Oak
• Core Redevelopments – adding square footage to an existing center
Development and Redevelopment Spend
$500
$400
$300
$200
$100
$-
2014 2015 2016 2017 2018 2019E Future
Pipeline
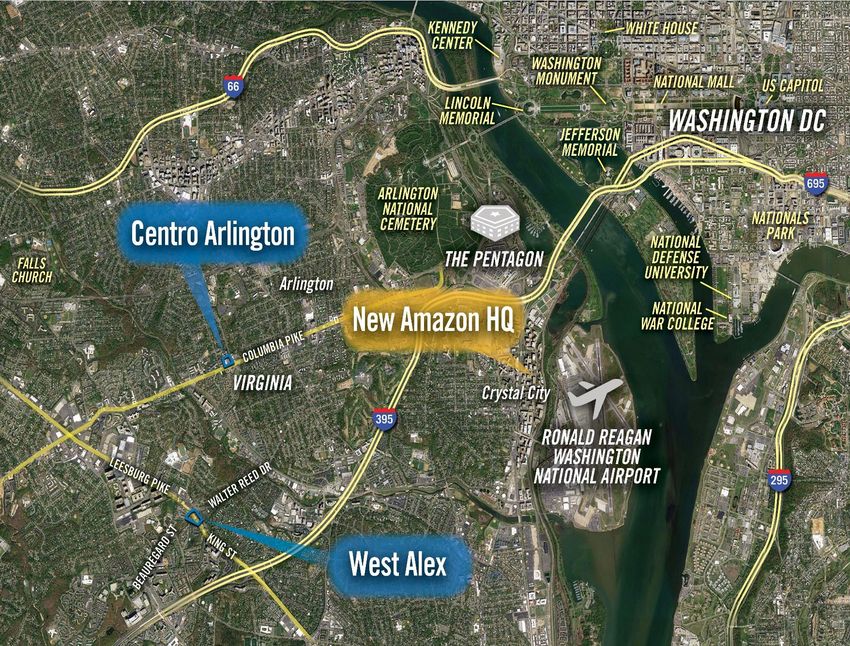
23WEST ALEX & CENTRO ARLINGTON
• We have two mixed-
used developments
under construction in the
Washington DC market
in close proximity to The
Pentagon and related
defense contractors.
• This submarket has little
new residential
product with an
increasing demand.
• Both are served by
numerous transit
connections to the
Pentagon, Pentagon
City and Washington
Metro stations.
• Close proximity to new
Amazon HQ in
Crystal City
24WEST ALEX
ALEXANDRIA, VA
$200M 100,000 SF
WRI’s Estimated Retail
Investment
278
• This premier mixed-use
Residential Units
development will feature
retail, residential, senior living
STRONG DEMOGRAPHICS
& 850 below-grade parking
spaces. 3-Mile 5-Mile
Avg HHI $112,331 $130,620
• 130,000 daytime population Population 296,691 565,733
within 3 miles
• The first residential units will
be available to lease at the
end of 2019 and Harris Teeter
anticipates opening late 2021.
25Centro Arlington
ARLINGTON, VA
$135M 72,000 SF
WRI’s Estimated 1st Floor Retail
Investment
6 Story 366
• This property is owned in a Mixed-Use Development Residential Units
joint venture with the
developer, Orr Partners.
WRI owns 90% equity
interest in the property.
STRONG DEMOGRAPHICS
• The first residential units 3-Mile 5-Mile
will be available for lease at Avg HHI $124,084 $135,665
the end of 2019 and Harris
Population 311,266 605,120
Teeter anticipates opening
in the first half of 2020.
26THE DRISCOLL AT RIVER OAKS
HOUSTON, TX
$150M 11,000 SF
Total Incremental Ground Floor
Investment Retail
30 Story 2020
Residential High-Rise First Units Delivered
318
Luxury Apt. Units
STRONG DEMOGRAPHICS
• WRI is contracting with Hanover Company, a nationally recognized
3-Mile 5-Mile
developer of high quality multi-family residential properties, for the
Avg HHI $154,890 $132,874
development of a 30-story residential luxury high-rise within
River Oaks Shopping Center. Population 182,040 470,904
• This 320,000 SF shopping center features national, upscale brands
serving the high-end River Oaks area and downtown Houston.
27SUNSET POINT 19
CLEARWATER, FL
BEFORE
Former Former Denotes redevelopment area
Bed Bath& Supermark
Beyond et
Former
Sports
Authority
Former
Staples
• Strategically located
Former
Comp USA
between downtown Tampa
and the Gulf
• The initial redevelopment
included re-tenanting the
former Sports Authority $23.1M 142,000 SF
and adding an outparcel Total Incremental Under
AFTER building. Investment Redevelopment
• With the addition of 12% Return
Sprouts to the center, the On Incremental
Investment
scope has increased
resulting in additional
investment, a higher return STRONG DEMOGRAPHICS
and more value creation 3-Mile 5-Mile
Future New
Building for shareholders. Avg HHI $63,920 $66,411
Population 103,967 223,816
12,000
New
building
28WINTER PARK CORNERS
WINTER PARK, FL
New 1,900 SF Building New Shops Building
New Sprouts Building
$12.1M 43,000 SF
Total Incremental Under
Investment Redevelopment
• Located in the high 10% Return
On Incremental
density Winter Park
Investment
community in
Northeast Orlando
STRONG DEMOGRAPHICS
• The redevelopment
consists of adding a 3-Mile 5-Mile
30,000 SF Sprouts and Avg HHI $92,296 $80,614
two new shop space Population 106,129 269,617
buildings with expected
stabilization in 2019.
29FIESTA TRAILS
SAN ANTONIO, TX
New 11,550 SF Multi-tenant Building New 7,800 SF Multi-tenant Building
$5.9M 20,000 SF
Total Incremental Under
Investment Redevelopment
11% Return
On Incremental
Investment
STRONG DEMOGRAPHICS
3-Mile 5-Mile
Avg HHI $79,718 $82,312
Population 108,391 285,982
• One of the area’s largest shopping destinations and is near UTSA
and South Texas Medical Center
• The redevelopment consists of adding two new shop space buildings
with expected stabilization in 2020
30WELLINGTON GREEN COMMONS
WELLINGTON GREEN, FL
Wellington Green
Commons
$4M 12,000 SF
Total Incremental Under
Investment Redevelopment
11% Return
On Incremental
Investment
STRONG DEMOGRAPHICS
3-Mile 5-Mile
Avg HHI $104,577 $80,000
Population 61,386 201,753
• Wellington serves a fast growing and regional affluent trade area
• The redevelopment consists of adding a 12,000 sf buildings with
expected stabilization in 2020
31POTENTIAL LARGER SCALE FUTURE REDEVELOPMENT –
CAMBRIAN PARK PLAZA | SAN JOSE, CA
PRELIMINARY SITE PLAN
The property has tenants with
short- term leases generating
a positive return.
STRONG DEMOGRAPHICS
3-Mile 5-Mile
Avg HHI $146,736 $140,303
Population 182,218 453,087
• Exciting opportunity to densify 7 acre property in San Jose, California
• Development will likely consist of retail, residential, hotel and senior living
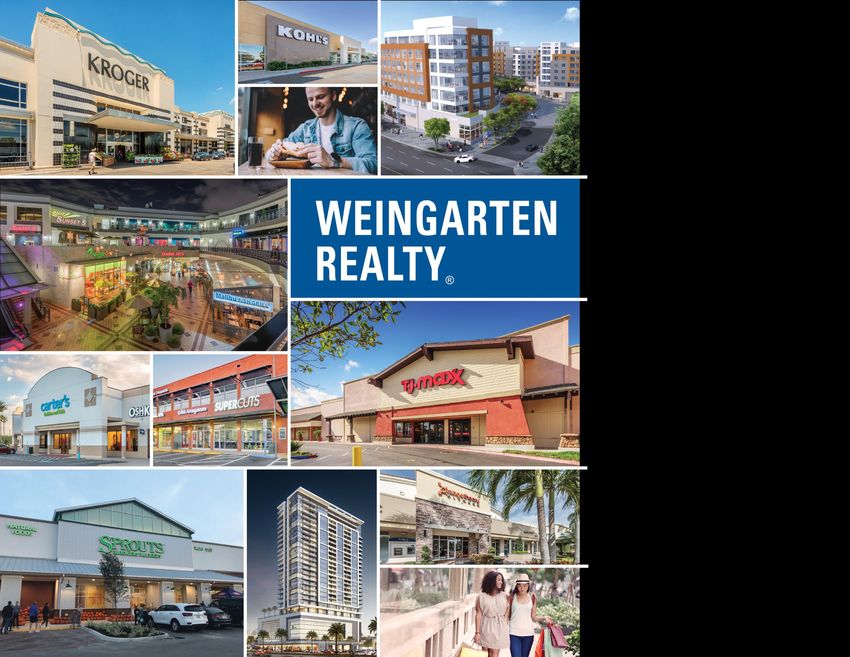
32Jess Ranch Marketplace
Apple Valley, CA
FORTRESS
BALANCE SHEET
Westminster Center
Los Angeles, CAFAVORABLE DEBT METRICS VS PEERS
NET DEBT + PREFERREDS TO EBITDA
WRI’s transformed balance sheet 7.0x
and low leverage positions the 6.5x 6.3 6.1 6.1
Company for long-term stability 6.0x 5.8 5.9 5.7 5.8
and all future opportunities 5.5x 5.3 5.3
5.0
including: 5.0x
• Re / New Development opportunities 4.5x
4.0x
• Acquisitions
3.5x
• Strategic debt repurchase 3.0x
(a)
• Stock repurchase on a leverage neutral basis 2015 2016 2017 2018 Q119
• Could invest $400M in net acquisitions and WRI Peer Avg
maintain Net Debt to EBITDARe below 6.25x.
INVESTMENT GRADE CREDIT RATINGS
Moody’s Baa1 Stable
S&P BBB Stable
(a)
WRI remaining Series F Preferreds were redeemed May 2015
Peer information includes FRT, SITC, KIM, BRX, RPAI, and REG. 34BALANCE SHEET POSITIONED FOR GROWTH
Village Plaza at Bunker Hill
Houston, TX MATURITIES
$350
$308 $313
$295
$300 $278
$253
$250
$200
241
299 300
$150 273
246
$93
$100
$73 10
$53
DEBT TO MARKET CAPITALIZATION $50 $45 $42
73 83 $10
45 53 7 54 34
$0 9 13 5 10
38.0%
Mortgage Debt Bonds
33.0%
32.5% 35.8%
33.7%
32.8% 32.8%
31.9% Weighted Average Remaining Life = 5.4 years
30.2%
28.0% Weighted Average Interest Rate = 4.0%
2014 2015(a) 2016 2017 2018 Q1 19
Debt Debt + Preferred
(a) Last of WRI preferreds were redeemed May 2015. 35Winter Park Corners
Winter Park, FL
2019 AND
BEYOND
Shoppes at Deerfield
Deerfield Beach, FLGUIDANCE
As of 3/31/19
2019 GUIDANCE
Guidance
Net income attributable to common shareholders $1.77 - $1.89
Depreciation and amortization 1.23 – 1.25
(Gain) on sale of property and interests in RE equity investments (0.93) – (0.99)
NAREIT FFO - Basic 2.07 - 2.15
Income attributable to operating partnership units 0.02 - 0.02
NAREIT FFO Per Common Share - Diluted $2.09 - $2.17
Core FFO Per Common Share - Diluted $2.09 - $2.17
Portfolio Activity
Acquisitions $50 - $150 M
Re / New Development $175 - $225 M
Dispositions $250 - $350 M
Operating Information
Same Property Net Operating Income with redevelopments +2.0% to +3.0%
37SAME PROPERTY NOI GROWTH - STABILIZED
• Average annual rent
Contractual Rent Steps steps of 1-3% 1.00% - 1.25%
• 15% of the portfolio GLA
Rent Growth turns in a typical year
• Rent growth of 10-15%
results in SPNOI impact 1.35% - 1.50%
of 1.35% - 1.50%
• Other items including
percentage rent and ancillary
Misc income account for 0.4% - 0.40% - 0.50%
0.5% to SPNOI annually
STABILIZED SPNOI GROWTH 2.75% - 3.25%
38RELATIVE PEER FFO MULTIPLES
22.0
20.3
20.0
18.0 17.1
15.8
16.0
14.0
13.7
12.6 12.0 12.0
12.0
10.0 9.6
8.0
6.0
FRT REG ROIC WRI KIM RPAI SITC BRX
Core FFO* $6.38 $3.86 $1.13 $2.13 $1.46 $1.05 $1.17 $1.90
Stock Price
$129.36 $65.54 $17.80 $29.26 $18.34 $12.64 $13.93 $18.25
(as of 5/10/19)
*Midpoint of 2019 Guidance 39WRI KEY POINTS
TRANSFORMED
PORTFOLIO
of High Quality, Grocery
Anchored Shopping Centers
>90% NOI in
Target Markets
STRONG
POSITIONED
BALANCE SHEET
with Great Laddering of
FOR FUTURE
Debt Maturities
OPPORTUNITIES
5.3X Net Debt
to EBITDAre
EXPERIENCED TEAM
of Real Estate Professionals
with a Best in Class
Operating Platform
Westchase Shopping Center
Houston, TX
40INVESTOR PRESENTATION 1Q 2019
You can also read