TRENDS IN PAYMENT INSTRUMENTS 2014 - Tecnocom Report on - In collaboration with
←
→
Page content transcription
If your browser does not render page correctly, please read the page content below
Tecnocom Report on
TRENDS IN PAYMENT
INSTRUMENTS 2014

       In collaboration with
Tecnocom Report on
TRENDS IN
PAYMENT INSTRUMENTS 20141. Highlights of the Tecnocom Report 2014
Tecnocom Report on TRENDS IN PAYMENT INSTRUMENTS 2014 4
1.
Highlights of the Tecnocom
Report 2014
1. Highlights of the Tecnocom Report 2014
2014 has been a year characterized by the massive launch of contactless payments technologies. While in the previous issue,
we noted that pilots were concentrated on technologies whose maturity was still incipient, such as NFC and the various wallet
ecosystems, this year we have verified that they have been brought up to a commercial level by many institutions on both sides
of the Atlantic. Proof of this are the multiple launches of digital wallets in both Spain (BBVA Wallet, iupay) and Latin America,
where we find Mi Dinero Seguro (Brazil) and mpeso (Dominican Republic), among others, that increasingly position the mobile
wallet as the most suitable instrument both in emerging markets (as an instrument of financial inclusion) and in more developed
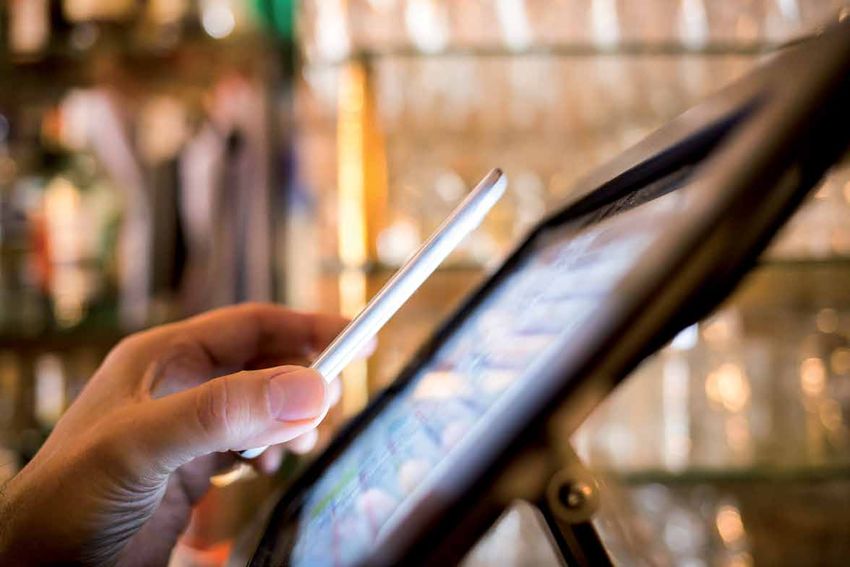
economies (where the key factors are convenience and quick and easy payment). The interest in point of sale terminal solu-
tions in mobile devices (mPOS) is gaining ground thanks to the increase in acceptance driven by their adoption by retailers and
liberal professionals, together with the innovations incorporated by suppliers.
We observe that the authorities in general maintain a firm commitment to promoting the development of secure and inclusive
forms of electronic payment, which accounts for the innovations also occurring in the regulatory field; these allow the needs
of the population to be better met – whether new needs of those who are already users, or the needs of the unserved popula-
tion – taking advantage of the benefits arising from the continuous technological advances with which the regulators are trying
to keep pace. This is the case of Europe, which over the next two years will experience growth in basic savings accounts – a
concept already widespread in Brazil, Colombia, Mexico and Peru – motivated by the new regulations passed by the European
Parliament, which will oblige financial institutions to offer them to all residents at a reasonable cost or none at all. In the Euro-
pean context, we point out that Spain has been a pioneer in implementing the European Payment Services Directive (PSD2),
approved in 2013, in its national regulations (Royal Decree Law 8/2014, of 4th July, which established limits on interchange
fees for card payments).
Meanwhile, in Latin America important regulatory projects have been approved, such as the Law on Financial Inclusion in Co-
lombia, focused on electronic payment instruments as a tool for financial inclusion, Chile's draft bill on non-banking issuers of
payments with provision of funds, and the provisions for the regulation of services related to ATM networks, interchange fees
and commissions In the electronic payments segment in Mexico. The Central Bank of Ecuador has created a new Electronic
Money System operating over mobile telephony that will go into service next year.
There is a steady trend for the differences between the two regions to narrow year by year. That said, the means of payment
executives interviewed noted many regional and national peculiarities, confirmed by official data and reported by users, which
will be described and analysed. Most of them, however, emphasise the two major forces noted above, which in their opinion are
having a decisive impact on the development of payment instruments: the action of governments and the growing importance
of technology in the definition of new business models.
From the point of view of supply, globally it is credit transfers that are undoubtedly taking the leading role in the universe
of retail payments in terms of the value of the transactions. In Latin America, they account for 80.7% of the value of the
payment transactions recorded in 2013 (USD 9.9 trillion). Direct debits have yet to take off and reach the shares found in
Spain and Portugal; they are a form of payment which is still relatively uncommon in the region, despite the fact that their
use has grown in the last five years in countries such as Colombia and Mexico, although growth is flat in others such as
Brazil and the Dominican Republic.
5Tecnocom Report on TRENDS IN PAYMENT INSTRUMENTS 2014
Chart I: Value of payment transactions in Latin America between 2008 and 2013 by instrument (USD, billions)
14.000
12.321,1
12.000 1,6%
13,2%
10.000 4,3%
8.370,9 Cash (M0)
8.000 1,4%
Cheques
22,1%
6.000 3,0% Cards
80,7% Direct debits
4.000
Credit transfers
73,3%
2.000
0
2008 2013
Source: central banks and banking supervisors. Bank of International Settlements (BIS) for Brazil 2013 data.
Meanwhile, the use of credit and debit cards in Latin America has been rising, with the result that in 2013 they accounted for
4.3% of all transactions, compared with 3.0% in 2008. Cards, used in 71.6% of all transactions, are overtaking other forms of
payment, with an uninterrupted growth trend around the world, as can be seen in Chart II. Cheques again record a fall in the
number of transactions (to 11.8% of the total), due to their gradual replacement by electronic transfers (16.1%), which are the
second most used means of payment. As noted above, direct debits continue to decline in Latin America, even experiencing a
fall in their share of transactions in the region as a whole during the past five years (0.73% of non-cash transactions in 2008 vs
0.55% in 2013), despite the number of transactions in absolute terms rising by close to 12%. In this area there is ample scope
to increase their use in the region.
Chart II: Number of payment transactions in Latin America, 2008-2013 (millions)
12.000
10.000
8.000 Cards
6.000
4.000
Credit transfers
2.000
Cheques
Direct debits
0
2005 2006 2007 2008 2009 2010 2011 2012 2013
Source: central banks and banking supervisors.
In Spain and Portugal, the means of payment are following a similar path to that of Latin America with regard to the replace-
ment of paper-based instruments, but the total amount of transactions has fallen by an accumulated 21.2% between 2008 and
2013, as the increased use of credit transfers, direct debits and card payments does not offset the fall recorded in the use of
cheques and commercial bills. With regard to direct debits, Spain is a unique case in our sample of countries due to the high
proportion of direct debits, inasmuch as this type of transaction accounts for 17.2% of the value of the payments recorded in
Spain in 2013, as shown in Chart III. They are seen as a mechanism for keeping track of spending (easy reconciliation of the
debits recorded in the statements of account) and for the automation of payments, making it particularly attractive for routine
and recurrent payments (basic services, telephone bills, financial products, instalments, subscriptions, etc.) whose automatic
debit through a mandate or direct debit order becomes a flexible, secure and efficient instrument of payment. That is why direct
debits, credit transfers and cards have gained ground among the available means of payment, due partly to increased avail-
ability and the use of remote or virtual channels such as internet or mobile banking, which free the user from the need to visit
their bank branch to carry out such transactions.
61. Highlights of the Tecnocom Report 2014
Cash grew by 4.6% in 2013, to a total of EUR 108 billion, although this growth rate represented a significant slowdown com-
pared with the changes recorded by the Bank of Spain in the years prior to 2010, which stood at over 10%.
Chart III: Value of payment transactions in Spain by instrument, 2008 - 2013 (EUR, billions)
2.500
2.174,7
Cash (M0)
0,2%
2.000 7,8%
Other
1.711,8
25,0% 0,1% Bills*
1.500 3,0%
14,5% Cheques
4,5%
5,8%
Cards
16,8% 17,2%
1.000
Direct debits
Credit transfers
500
42,1% 53,1%
0
2008 2013
* Bills are credit notes that can be collected (if due) or must be paid (if drawn) at maturity
Source: Bank of Spain.
Spain recorded a small increase in the number of cards in circulation in the last year (1.1%, around 900,000 cards), with a
positive impact on the number of cards per thousand inhabitants in the case of credit cards, which had deteriorated since 2008,
representing a return to the growth trend seen until that year. However, the number of debit cards per 1,000 inhabitants has
fallen by 3.9%. Compared to the record figure of 76.4 million debit cards reached in 2008, the fall in private consumption and
the increase in card commissions led to a decline to 69.7 million in 2013, down 6.5 million: some financial institutions increased
commissions to compensate for the fall in income from financial intermediation, helping to dissuade users from renewing some
cards and thereby reducing the stock of available cards.
Overall, the number of purchases in Spain with Spanish cards increased faster in 2013 (by 3.6%) than in the previous period
(1.4%), according to Bank of Spain data.
Table I: Number of credit and debit cards in circulation, 2013
Debit cards Credit cards
Brazil 291,217,770 182,407,807
Chile* 16,529,205 6,583,968
Colombia 18,417,238 11,226,733
Mexico* 103,138,302 25,887,321
Peru 14,872,871 8,038,839
Dominican Republic 3,457,330 2,481,200
Spain 26,480,000 43,260,000
Portugal 13,510,163 5,963,602
* Does not it include credit cards of commercial establishments
Source: central banks and banking supervisors.
The distribution of cards between debit and credit is uneven in the countries studied, with the former predominating almost eve-
rywhere except Chile (considering retail cards). In this context, we highlight the generalized good performance of debit cards,
which continue to rise at a greater rate than credit cards, especially in Chile (compound annual growth of 15.1% in 2008-14)
and Mexico (12.4%). Meanwhile, a more pronounced growth in the total number of credit cards compared to debit cards can
be seen during the last five years in both Colombia and Peru, where the ratio of debit to credit cards has fallen to 1.6 (from the
2.9 recorded in 2008) and 2.0 respectively.
7Tecnocom Report on TRENDS IN PAYMENT INSTRUMENTS 2014
With regard to the average ticket of payments using debit and credit cards, we observe that in all the countries studied, except
Colombia, spending with debit cards shows a similar pattern, in a range between USD 27.64 in Brazil and USD 39.02 in Chile.
In this respect, the behaviour of spending with credit cards is more varied among the countries of the region.
Chart IV: Average ticket on debit and credit cards in 2013 (USD)
Debit Credit
140
120
100
80
60
40
20
0
ile
ico
p.
n
il
a*
ru
l
ga
ai
az
Re
Ch
Pe
bi
ex
Sp
rtu
Br
m
M
n
Po
lo
ica
Co
in
m
Do
* The data of Colombia and Peru are for 2012.
Source: central banks, banking supervisors, Visa and Mastercard.
Chart V shows the growth trend of ATM access points per million inhabitants in Latin America. This trend is clearly the opposite
of that experienced on the other side of the Atlantic since the onset of the international financial crisis, whose effects in this
parameter have been intense in the past year, especially with regard to ATMs, largely due to the reduction in size of the branch
networks of the Portuguese and Spanish financial systems. Peru remains the country with the highest growth in ATMs in the pe-
riod, with the total rising from 3,428 in 2008 to 7,030 in 2013, a compound annual growth rate of 15.4%, double that recorded by
the other countries, where it ranged from 5% (Brazil, Chile, Mexico and Dominican Republic) to 10% (Colombia). The increase
in the number of access points (both ATMs and POS) has contributed to growth in the number and value of transactions in the
region, unlike the trend observed in Spain and Portugal which, though still growing, are doing so more slowly.
Chart V. Number of ATMs per million inhabitants, 2008-2013
Brazil
1.800
1.600 Chile
1.400
Colombia
1.200
Mexico
1.000
Peru
800
600 Dominican Republic
400 Spain
200
Portugal
0
2008 2009 2010 2011 2012 2013
Source: central banks and banking supervisors.
81. Highlights of the Tecnocom Report 2014
With regard to non-bank correspondents, a function that does not exist in Spain and Portugal, we observe that Brazil maintains
its leadership, followed by Colombia and Peru, with Mexico further behind with regard to growth, despite the recent implementa-
tion of the correspondent function, with the capacity to use simplified procedures to open accounts able to make and receive
electronic payments. Non-bank correspondents are a key aspect of the launch of many of the financial inclusion policies in the
region, based in large measure on electronic means of payment, as noted above.
Thus, the development of government-to-person (G2P) electronic payments, and more specifically those that distribute social
benefits (allowances) to vulnerable segments of the population in Latin America, is key to improving the reach, efficiency and
administration of public resources. G2P in general, and subsidies in particular, account for a significant volume of resources
and above all, a huge number of low-value transactions, with very high frequency.
We observe two regionally-differentiated scenarios: while the use of electronic means for G2P payments, basically through
bank transfers (salaries, pensions), is well established in the Spanish public administration, in Latin America the use of cash
and/or cheques still predominates in the field of social transfers. This predominance is due fundamentally to the difficulty
of covering the last mile in the distribution of G2P payments in sectors of the population excluded from formal financial ser-
vices by their socio-economic status and/or geographical location. Generally, and notwithstanding the existence of social
programs that distribute products in kind (food, medicines, textbooks, fuel), social transfer programs take three forms with
regard to the payment of benefits: (i) payment in cash, cheques or vouchers, still the main form in many of the countries; (ii)
wallet card or prepaid card; and/or (iii) savings accounts with or without an associated card; the latter two forms are based
on electronic means of payment and today still face important challenges which we will analyse in detail in the special report
in this issue.
Chart VI. Types of G2P payments
Allowances
Purchases/Travel
Loans
Support
Tax refunds
Subsidies for companies
Salaries
Loans
Pensions
G2P G2B
Individuals Government Companies
P2G B2G
Tax payments
Payments of taxes,
Charges for services
duties, licences
Infringements and fines
Source: Afi and Tecnocom.
9Tecnocom Report on TRENDS IN PAYMENT INSTRUMENTS 2014
The greatest challenges arise from legal, operational and even cultural factors. Thus, we find the challenge of agreeing an
adequate definition, design and implementation of money delivery mechanisms that are cost-effective and provide benefits
for the three parties participating in the process (government, financial institution and recipient). Also that of identifying, in
order to subsequently eliminate or reduce them, obstacles – legal, operational, cultural – to the use of electronic means of
payment that make the transactions viable in a successful and sustainable manner. Finally, that of ensuring adequate levels
of financial education among the recipients of the payments, together with transparency and protection for the user, so that
the benefits are understood by the final recipients and, as far as possible, extended to other aspects of financial inclusion.
This diagnosis is shared by executives in the sector who have explored this type of innovation, and who also point to the
enormous operating challenge involved in moving cash to remote areas.
As we have also noted in this report, we highlight the trend towards internet banking, increasingly widespread and significant
in the field of low-value payments on both sides of the Atlantic, chiefly due to the increased use of mobile devices to access
and initiate payment orders, a habit that enables users to carry out different transactions from wherever they happen to be,
without the need to go to the financial institution's premises for personal attention. The importance of internet and mobile
banking highlights the feedback between the ITC and banking sectors, which offers enormous opportunities for collabora-
tion between operators in the two sectors. In this respect, since the end of 2013 we have been witnessing major alliances
between banks and telecommunications companies for the development of new digital and mobile banking businesses, as
is the case of Claro and Bradesco in Brazil, rolling out the Near Field Communication (NFC) service around the country, or
that of Banco do Brasil, telecom operator Oi and Visa, which launched a new contactless payments solution; in the Domini-
can Republic, Banco Popular Dominicano and Orange launched mpeso and in Spain, Caixabank, Santander and Telefónica
have created new digital payment services (Yaap Money).
Electronic commerce has experienced exponential growth over the last five years in Latin America, where it has quadru-
pled its turnover, in line with the improvement in indices of financial inclusion (indices of access to banking and penetration
of electronic means of payment) and the greater security of the channel that, according to the executives in the sector, is
one of the key issues for the means of payment industry. This trend shows the growing importance that means of payment
other than cash are assuming for carrying on daily life in Latin America. Indeed, internet users are more likely to have bank
accounts than non-users, with the gap detected in previous years being maintained. This is especially notable in those
countries with lower levels of bank usage, where the proportion of bank users among internet users is higher, as occurs
in Mexico, Peru, Chile and the Dominican Republic. The form of payment most used for online purchases is credit cards,
followed by debit cards, cash (whether cash on delivery or direct payment) and PayPal, as reflected in the previous issue
of this Report. The case of Peru remains the exception, where payment in cash and bank deposits are the means with the
greatest number of users.
In Spain, electronic commerce has more than doubled its turnover in the last five years, mainly due to the increase in the
number of internet users and the increased proportion of those who make purchases online. The figures published by the
National Commission for Markets and Competition for 2013, on the internet purchases made using credit or debit cards,
confirm this behaviour: 190 million electronic commerce transactions were recorded, representing a turnover of USD 16.9
billion, 24.7% up on 2012. Debit cards and Paypal are the means of payment preferred by online consumers.
The characteristics of the frequent online buyer are similar in all the countries analysed; men under 40, with more sophis-
ticated technological equipment than the average, favoured by their membership of a high or medium-high socioeconomic
segment, residing in large cities or metropolitan areas, with a higher usage of debit cards and banking credit. This leads to
a pattern of frequent purchases associated with this profile: products and services related to travel, leisure, electronics and
fashion are the items most frequently acquired by internet using a card in all the countries studied.
As in our prior reports, the last section of our report includes an analysis of demand for payment instruments in Brazil, Chile,
Colombia, Mexico, Peru, the Dominican Republic and Spain. The results obtained show a slowing trend in credit cards in
a good number of the countries, with the presence of debit cards increasing in several of them. The performance of Brazil
stands out from the other countries (see Chart VII); there, two out of three people have some form of plastic, making it the
country with most cardholders in the region. In fact, it is consolidating its position as the major country in Latin America in its
relationship with banking, followed by Chile and Colombia, where the half the population has access to this form of payment.
Some way behind, we can identify a third group of countries composed of Mexico, Peru and the Dominican Republic, where
a majority of the population does not yet use banks: Peru has gone backward in the use of banks (as has Chile) while the
Dominican Republic stands out for the notable growth of bank usage in the last two years, over 5 percentage points.
101. Highlights of the Tecnocom Report 2014
Chart VII. Possession of debit and/or credit cards by country (2012 vs 2014)
2012 2014
70,4% Brazil 70,8%
58,9% 60,1%
53,0% 53,6%
54,5% Chile 51,7%
47,4% 44,8%
28,9% 29,1%
50,2% 50,9%
39,1% Colombia 39,8%
31,3% 38,8%
39,6% 39,7%
29,4% Mexico 30,5%
26,6% 29,0%
33,0% 30,9%
26,2% Peru 26,0%
15,8% 19,2%
24,4% Dominican 29,5%
18,4% 24,1%
14,9% Republic 18,6%
84,1% 81,2%
54,2% Spain 55,5%
73,7% 71,0%
Total cards Credit cards Debit cards
n = total per country ≈ 400
Source: prepared by Afi based on research.
Among cardholders, the preference to use them for large expenses predominates, except in Colombia and Chile, where
the majority opts for cash, Brazil being the leader with regard to the strongest preference for making all kinds of payments
by card. Meanwhile, Mexico and Peru, in line with the predominant preferences, also have a substantial proportion of card-
holders (25%) who as much as possible avoid using their cards, in line with the behaviour of cardholders in the Dominican
Republic.
Spain has the smallest number of cardholders who consider their cards a method of payment to be avoided, and, after Brazil,
it has the second highest preference for using them for all kinds of payments. In fact, Spain, the country where plastic is most
widely held, is where cards are least used, but when they are used, it is for payments of larger amounts. This invites us to
forecast that the recently inaugurated regulatory changes – limits on interchange commissions – will almost certainly con-
tribute towards modifying this behaviour in the coming years, leading to a more intense use of cards for smaller payments.
This year's Report features a quantitative study designed to identify the factors that could encourage holders to use their
credit cards, and which could encourage those who do not yet have them to acquire them. Thus, the elimination of main-
tenance commissions and the reduction of interest rates are the factors that would most stimulate the use of credit cards,
while insurance against theft or loss in purchasing is the factor that would most encourage acquisition by those who still do
not have them.
To encourage a greater use of cards, one proposal in Latin America is to offer improved information on cardholders’ spend-
ing, which shows that there is an unsatisfied demand for services to facilitate the management of personal finances, es-
pecially in Chile, Mexico, Peru and Dominican Republic. There is also evidence of an interest (especially in Colombia,
Dominican Republic and Spain) in obtaining immediate financial benefits, the absence of which is today an obstacle to the
use of this form of payment.
Meanwhile, among the key incentives to card acquisition among those who currently have no plastic is insurance - due to
the lack of experience, which translates into a fear that a financing product might be stolen or lost – especially in Colombia
and Dominican Republic - followed by refunds of purchases, exemption from payment of maintenance commissions and the
reduction of interest rates. Among those contemplating acquisition, information on their spending does not arouse interest.
11Tecnocom Report on TRENDS IN PAYMENT INSTRUMENTS 2014
Overall, Colombia and, to a lesser extent, the Dominican Republic, stand out as the countries in which the proposals could
in principle have greater success in encouraging both the acquisition and the use of cards.
Chart VIII. Assessment of proposals to increase the use of credit cards with minimum, maximum and average value
(scale 0-10)
9,0
8,5
Máx. 8.3
8,0
Máx. 7.9
7,5 Máx. 7.6 Máx. 7.6 Máx. 7.6
7.4
Máx. 7.2 7,3
7,0 Mín. 7.1 6.8 6.9 Mín. 6.8
6,5 6.7 6.7
6,0 Mín. 6.0
Mín. 5.8 Mín. 5.8
5,5
5,0 Mín. 5.0
4,5
4,0
Achieve improvements Provide information on Insurance of Gifts for points Discount coupons Refund spending
when using the card spending (dates, amounts, purchases against accumulated by for more frequent use with credit cards in
(no commissions, types of purchase and robbery or damage use of the credit card certain establishments
lower rates) comparisons)
n = Have bank or private credit card
Source: prepared by Afi based on research.
The number of users of mobile banking has doubled in the last year in Colombia and Mexico, due to the increasing owner-
ship of smartphones. Such significant growth has tended to even out the level of access to banking through mobile terminals,
today close to 50% of bank users who access internet using their mobile phone in all the countries except Brazil and Chile,
which show a certain stagnation attributable to the greater increase in the number of internet users compared to users of
mobile banking.
The Tecnocom Indicator of demand for electronic means of payment (Chart IX) shows certain improvement in some coun-
tries and deterioration in others. According to this indicator, which allows a direct comparison of the level of development of
electronic payment instruments in the countries analysed, Spain chalks up the best score; although it fell back almost half a
point with regard to the previous year, its fall has undoubtedly eased, chiefly due to the stability of its means of payment data
(above all in debit cards) and online purchases, even though mobile payments have not yet managed to consolidate as an
alternative to other electronic means of payment.
Brazil is in second place, although manifesting a certain stagnation with regard to the previous year. Penetration and use,
after growing during the last few years, have slowed, but nevertheless it maintains a very solid position within the Latin
American market. It is followed by Chile and Colombia, with the distances between them narrowing. Chile improved its result
by two points with respect to 2012, due to moderate growth in the frequency of use of cards and online purchases, despite
the loss of share detected in non-bank credit cards. However, Colombia improved by almost four points, recording the high-
est growth in the indicator this year, due to the increase in the number of card users, above all debit cards, together with the
improvement in online purchases. Mexico recorded two-point growth in the indicator, caused chiefly by the greater use of
plastic, while Peru grew less than one point, with the spread of mobile payments partly offset by stagnation in the penetra-
tion and use of cards.
121. Highlights of the Tecnocom Report 2014
Finally, the Dominican Republic maintains a sustained and positive growth of slightly more than two points, based on three
factors: improved presence of the different cards, a relative increase in their use and greater use of mobile payment and
online purchases.
Chart IX. Tecnocom Indicator of demand for electronic means of payment
Spain 77,3
74,2 73,8
66,3
Brazil 69,1 69,4
56,4 58,1
Chile 54,0
Colombia 51,4
50,0
47,6
Mexico 37,4 37,0
35,0
Peru 31,0 31,9
33,2 30,6
Dominican 28,4
Republic 26,8
2012 2013 2014
n ≈ 400 per country (2,800 in total)
Source: prepared by Afi based on research.
13Madrid Josefa Valcárcel, 26 28027 Madrid Tlf: (+34) 914 368 100 / 901 900 900 Att. Comercial. 902 135 555 Fax: (+34) 914 368 151 info@tecnocom.es www.tecnocom.es
You can also read