How Online Shoppers Pay in European Markets - JP Morgan
←
→
Page content transcription
If your browser does not render page correctly, please read the page content below

How Online Shoppers Pay in European
Markets
Which payment options do you need to offer in European countries?

An IMRG report, supported by J.P.Morgan, looking at the importance of various
payment methods across European countries.

1 | www.imrg.org                                                 Supported by:
IMRG © - September 2018

A shifting landscape
                               A certain event beginning with a capital ‘B’ is looming, with March
                               2019 only a few short months away now. The exact shape the UK’s
                               exit from the EU takes is still very open – which might have
                               business ramifications around currency fluctuations, tariffs and
                               access to non-UK workers.

                               So with all this potential disruption to come (or very little – as has
                               ever been the case with Brexit, no-one is really sure), it wouldn’t
                               appear on the face of it to be a good time to be expanding
                               internationally.

                               But – demand on UK retail sites from international shoppers
actually increased following the June 2016 referendum, as sterling fell sharply against the euro,
so EU shoppers found their cents were suddenly going farther.

Now just might be a good time after all, but trading into international markets is complex. For the
purposes of this report then, we have focussed explicitly on the penetration of payment methods
across Europe to help you understand how to structure your proposition there and where things
might be going.

Andy Mulcahy, Strategy and Insight Director, IMRG

The case for Europe
                             Awareness of changes in consumer behaviour is essential for
                             companies hoping to take advantage of the opportunities the
                             European online retail market presents. Bricks-and-mortar retail
                             sales in Europe may be relatively stagnant, but as our recent reports,
                             ‘Country Insights: The Changing Dynamic of Payments in Europe’
                             have made clear, the European ecommerce market is thriving.

                              Payment methods are constantly evolving in parallel with
                              increasingly sophisticated consumer demands and sentiment – a
positive sign of a healthy, dynamic market. Bolstered by numerous factors – including high levels
of internet connectivity, a boom in smartphone use, technological innovation and increasing
regulatory support for digital payments – many of the countries we assessed in our reports are
positioned for double-digit growth in online shopping over the next two years.

Now, more than ever, businesses of all sizes can embrace the opportunities afforded by cross-
border expansion, bolstered by a real insight into the payments landscape.

Shane Brodbin, Vice President, EU Product Solutions, J.P. Morgan Merchant Services

2 | www.imrg.org
IMRG © - September 2018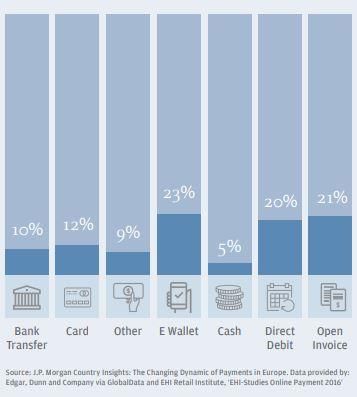
Unintended consequences
We track the percentage of online retail orders that go to cross-border destinations each month
in the IMRG MetaPack Cross-Border Index1. There are a number of individual countries tracked
within that index but, for reporting purposes, we also split the data by EU and non-EU volumes.

In recent years, this index has recorded a significant shift in the volume of packages being
delivered to EU countries, as shown in the chart below. This movement is likely correlative to the
post-June 2016 strength of the euro against sterling, making it a potentially rewarding time for
retailers to consider optimising their proposition for European markets while interest levels remain
high.

Since the back end of 2017, the percentage of cross-border orders going to EU destinations has
been consistently in the 65-70% range.

                                                  Breakdown of total cross-border volume                                                                                                           Cross-Border - EU

                                                             2 years rolling                                                                                                                       Cross-Border - Non EU
      80.0%
      70.0%
      60.0%
      50.0%
      40.0%
      30.0%
      20.0%
      10.0%
       0.0%
                                Sep-16

                                                                                      Mar-17

                                                                                                        May-17

                                                                                                                          Jul-17

                                                                                                                                                                                                  Mar-18
                                         Oct-16

                                                                    Jan-17

                                                                                                                                            Sep-17
                                                                                                                                                     Oct-17

                                                                                                                                                                                Jan-18

                                                                                                                                                                                                                    May-18
              Jul-16

                                                  Nov-16

                                                                                                                                                              Nov-17

                                                                                                                                                                                                                                      Jul-18
                       Aug-16

                                                                                               Apr-17

                                                                                                                                   Aug-17

                                                                                                                                                                                                           Apr-18
                                                                                                                 Jun-17

                                                                                                                                                                                                                             Jun-18
                                                                             Feb-17

                                                                                                                                                                                         Feb-18
                                                           Dec-16

                                                                                                                                                                       Dec-17

For the purposes of this report, we’re focussing exclusively on how customers in some of these
European countries pay for their products, for those looking to expand operations there.

Routinely sewn together into the bracket of ‘continental Europe’, you would be forgiven for thinking
that the separate countries across the Channel adhere to similar payment practices. The reality
is this: each individual market has its own payments culture which varies from country to country,
sometimes wildly so. For example, while UK customers are predominantly reliant on card

1
  IMRG MetaPack Cross-Border Index, https://www.imrg.org/data-and-reports/imrg-metapack-cross-border-
indexes/

3 | www.imrg.org
IMRG © - September 2018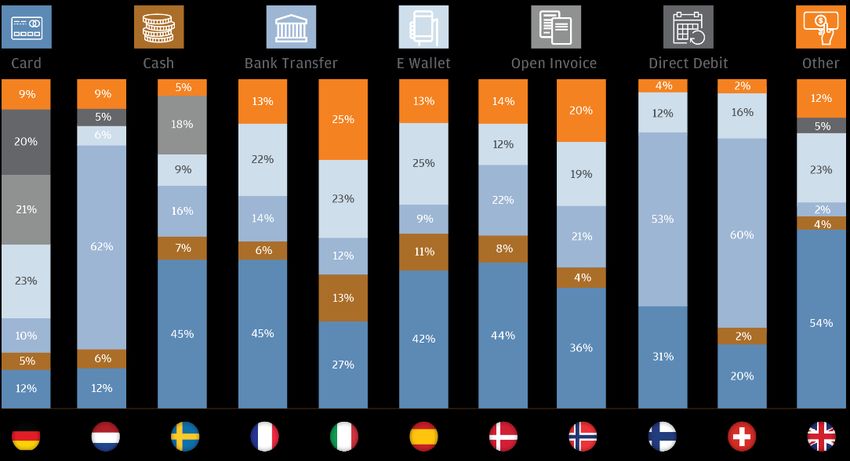
payments (54%)2, only 12%3 of shoppers in the Netherlands opt for this method, with the prevalent
choice instead being bank transfer (62%)4.

The onus, therefore, is on retailers to provide an adept payment option which coheres with the
country’s individual shopper preferences. If shoppers there do not recognise or feel comfortable
with the payment options available to them, they are unlikely to complete a purchase.

A brief overview of ecommerce in Europe
There is an essential point which needs to be addressed and borne in mind whenever cross-
border trade is being considered – which is that the payment frameworks in individual countries
should not be viewed in isolation. Each of the respective European countries are continually
oscillating on a range of factors: technological, sociological, economic, and political. Each of these
factors has a direct potential impact on payments: not only the volume of products being
purchased, but also the average basket value, demographic of purchasers, relevant regulation
and whether products are being bought in-country or externally.

Clearly, payments are only one part of any overall cross-border market strategy and, prior to
launching or ramping up activity in any country, it is recommended that you research the market
in detail to avoid making basic mistakes and give your approach the best chances of success.

IMRG provide a set of comprehensive country guides to help you with this5, but, for basic
comparison purposes here, the following table gives an overview of the most populated
ecommerce markets in Europe6:

    Country       GDP         B2C              Average online       Internet              Smartphone
                              ecommerce        spend per            penetration           Penetration
                              market value     person per year
    UK            €2.4trn     €156bn           €3,625               93%                   65%
    France        €2.3trn     €72bn            €1,780               86%                   53%
    Germany       €3.1trn     €67.3bn          €1,161               88%                   55%
    Spain         €1.23trn    €24.19bn         €1,089               82%                   82%
    Italy         €1.52trn    €20bn            €938                 65.6%                 50%
    Switzerland   €540bn      €9.8bn           €1,815               87.2%                 64%
    Netherlands   €0.73trn    €20.16bn         €1,090               94%                   64%

2
  J.P. Morgan’s Country Insights: The Changing Dynamic of Payments in Europe – Overview,
https://www.jpmorgan.com/jpmpdf/1320745634800.pdf
3
  J.P. Morgan’s Country Insights: The Changing Dynamic of Payments in Europe – The Netherlands,
https://www.jpmorgan.com/jpmpdf/1320745416256.pdf
4
  Ibid.
5
  IMRG Cross-Border eCommerce Trading Guides https://www.imrg.org/data-and-reports/cross-border-
ecommerce/
6
  J.P. Morgan’s Country Insights: The Changing Dynamic of Payments in Europe,
https://www.jpmorgan.com/europe/merchant-services/payment-insights

4 | www.imrg.org
IMRG © - September 2018
(Continued from previous page)

 Denmark         €265.3bn      €13.57bn          €3,111                96%                    68%
 Norway          €370.6bn      €9.44bn           €2,467                98%                    68%
 Finland         €215.6bn      €8bn              €2,170                92.5%                  55%
 Sweden          €0.4trn       €10.44bn          €1544                 93%                    70%

As can be seen, and as might be expected, some markets are more mature than others. However,
each can be rewarding in its own way for the right propositions, so, if one does show some degree
of promise in your particular case, how are people paying for products there?

The following chart presents an immediate answer to the question, with the rest of this report
exploring the various payment methods utilised throughout Europe in more detail.

 Source: J.P. Morgan’s Country Insights: The Changing Dynamic of Payments in Europe: Data has been provided to
            J.P. Morgan Merchant Services by Edgar, Dunn and Company via GlobalData & IMRG, 2016

Popularity of payment methods in key markets
As mentioned in the introduction, a higher proportion of orders are now going to EU destinations
post-referendum vote. Within Europe, where are the bulk of these orders actually going?

The IMRG MetaPack Cross-Border Index tracks the percentage of total cross-border volume that
goes to the top 20 global destinations from UK retailers.

5 | www.imrg.org
IMRG © - September 2018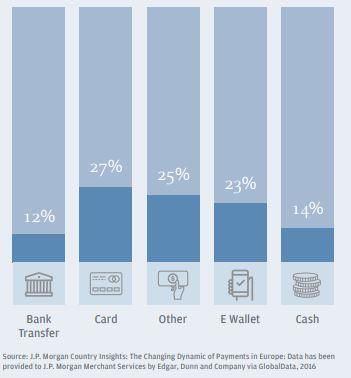
30%                                                               Feb 2018 % of total

                                                                      March 2018 % of total

    25%                                                               April 2018 % of total

                                                                      May 2018 % of total

    20%                                                               June 2018 % of total

                                                                      July 2018 % of total

    15%

    10%

    5%

    0%

The top 5 European markets (besides Ireland) are France, Germany, Spain, Italy, and The
Netherlands (though the proportion does vary from month to month and sometimes Russia is in
the top 5). According to data from Edgar, Dunn & Co7, the UK, France and Germany account for
almost 60% of all ecommerce in Europe. Interestingly, the following data from Statista shows that
Germans are not big cross-border shoppers compared to other European countries, while
Spaniards and Italians do seem to be more inclined to shop in other markets, which is perhaps
reflective of the relative maturity of those online retail markets.

7
    Edgar, Dunn & Company, September 2018

6 | www.imrg.org
IMRG © - September 2018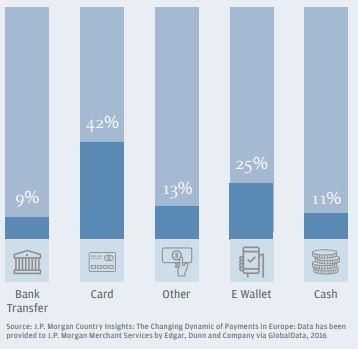
48%       48%
                          46%    45%
                                           42%
                                                     37%
                                                               34%      33%       32%
                                                                                        29%
                                                                                              27%

In the next section, we look at these top 5 European markets and how the payment infrastructure
has evolved – and is evolving – in them.

France
The French ecommerce market is worth €72bn8, the second highest in Europe, only bettered by
the UK (€156bn). With the country flourishing under strong economic growth, its ecommerce
market value is expected to reach €108.53bn by 2020. This figure paints an attractive prospect
for retailers, especially when viewed in tandem with British exports, of which 18% of total cross-
border deliveries were made to France in July 2018. So how is it that French customers are paying
for goods online?

Cards are dominant. As is demonstrated by the following chart, 45% of payments in France are
made by card. This large share is likely attributed to Cartes Bancaires (CB), a well-established
interbank payment system, with the next highest payment method being e-wallets at 22%. CB
payment cards are offered in collaboration with Mastercard or Visa, which means that a merchant
can leverage their existing card acceptance from the UK for France.

8
 J.P. Morgan’s Country Insights: The Changing Dynamic of Payments in Europe – France,
https://www.jpmorgan.com/jpmpdf/1320745162989.pdf

7 | www.imrg.org
IMRG © - September 2018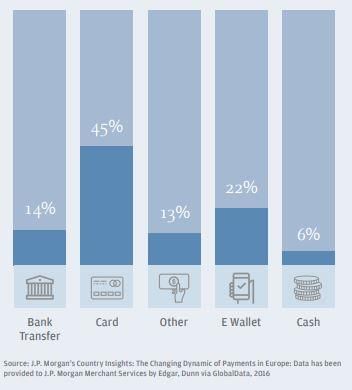
The popularity of e-wallets is increasing; the smartphone-optimised payment method accounted
for €15.8bn of transactions in 2016, an increase of 25% from the year before. And this number
needs to be viewed alongside smartphone growth in France: with a current smartphone
penetration of only 53%, mobile is the fastest-growing channel in the country, expanding at three-
times the rate of the overall ecommerce sector. E-wallet transactions should be expected to
increase in line with this and, in this regard, PayPal is the provider of choice as the leading e-
wallet in the country.

Bank transfers are also on the rise, owing to the increase in digital-only banks. In 2016 the
payment method grew by 90%, while card growth plateaued. Further to this, telecoms provider
Orange launched Orange Bank in November 2017, an online-only banking service which allows
customers to pay, check balances, and talk with advisers from their smartphones 24/7.

According to IMRG-MetaPack data, France is the largest cross-border recipient of UK goods in
the world, besides the US. Cards remain the primary payment method which UK retailers should
look to optimise when launching in the country, but with the nation currently undergoing a period
of technological innovation, smartphone payment methods are not to be discounted.

Commentary from Shane Brodbin, J.P. Morgan

“Currency is also worth mentioning: easily overlooked, retailers need to ensure that the prices of
their products are displayed in the currency native to whichever country they’re looking to
establish themselves within. This could increase the conversion rate from those particular
populations.”

8 | www.imrg.org
IMRG © - September 2018
Germany
Despite having the largest GDP in Europe, Germany is only the third-biggest ecommerce nation,
accounting for €67.3bn of online sales9. The German populace are traditionally low-spenders,
with the average online spend per-person 25% below the European average. Further to this,
Germans appear relatively hesitant when it comes to cross-border ecommerce, likely influenced
by the established ‘try before you buy’ principle in Germany: Germany has one of the largest
returns rates in Europe, and therefore any retailer would do well to ensure their returns offering is
strong when establishing a foothold in the country.

In contrast to France, Germany has a relatively low card usage (12%), as shown in the graph
below, and in 2016, card payments fell by 41% in value terms. The domestic debit card, Girocard,
is not enabled for ecommerce, and therefore German customers turn to other payment methods
to conduct online transactions.

Open invoices, where the customer pays after reception of the goods, are one of the most widely
used payment methods in Germany. While potentially presenting a challenge to retailers in terms
of reconciliation, its popularity doesn’t seem to be slowing down or being overtaken by alternative
methods: open invoices grew in value by 58.2% year-on-year in 2016. The Swedish online bank
Klarna is also now available in Germany, which can handle the tracking of invoices on behalf of
retailers.

9
 J.P. Morgan’s Country Insights: The Changing Dynamic of Payments in Europe – Germany,
https://www.jpmorgan.com/jpmpdf/1320745272912.pdf

9 | www.imrg.org
IMRG © - September 2018
Two other payment methods experiencing strong growth are direct debit and bank transfer, partly
driven by the establishment of the Single Euro Payments Area (SEPA). The implementation of
this catch-all, continent-wide innovation has streamlined the ease with which online payments can
be made, and SEPA direct debits already account for 20% of the payment market in Germany.
The most popular bank transfer methods for Germans are GiroPay and Sofort.

The last payment method worthy of mention is the e-wallet, of which the German population have
been early adopters. The country has one of the highest usage rates of mobile for ecommerce,
and an estimated 38% of online shopping is completed by mobile, this potentially explaining the
popularity of e-wallets. Of the e-wallet methods available, PayPal is once again dominant,
accounting for 20% of the market.

Germany is an affluent nation, with an increasing lean towards ecommerce as the sector becomes
more optimised. Retailers looking to establish a presence in the country should look to offer an
array of payment methods and ensure that their returns policy is clear and efficient.

Spain
eCommerce in Spain is only now taking root10. In 2016, just 4.1% of retail sales were made online,
perhaps owing to years of economic difficulties, high unemployment, and a culture which
encourages shopping and socialising outside of the home. However, rather than intending to
dissuade, the rising rate of ecommerce presents an opportunity for retailers; Spaniards look to
overseas outlets for a vast proportion of their purchases (46.6%), and many leading brands have
yet to establish a presence in the country.

As a population, the Spanish have a general lack of trust in financial security. Likely owing to this,
card payments are the preferred payment method at 42% of online transactions, as they are easily
traceable and often offer payment protections.

As shown in the following chart, the next highest payment method is the e-wallet at 25%. The
total value of e-wallet transactions grew 170% between 2014 and 2016, with PayPal once again
being the dominant provider, taking 20% of the market. This figure correlates with Spanish
smartphone habits: Spaniards are becoming on-the-move shoppers, with 31% browsing stores
on their mobile devices though only 7% finalising purchases via their smartphones.

10
  J.P. Morgan’s Country Insights: The Changing Dynamic of Payments in Europe – Spain,
https://www.jpmorgan.com/jpmpdf/1320745127975.pdf

10 | www.imrg.org
IMRG © - September 2018
Spain is an upcoming player in the European ecommerce market. Internet penetration has
increased by more than 20% in the last eight years, and with national debt rallying, the data points
towards an increase in the Spanish population’s overall expenditure. With there already being a
significant interest in foreign brands, Spain may become a worthwhile foothold in the coming
years.

Italy
At only 3% of their total retail market, Italy has one of the smallest ecommerce markets in
Europe11. The figure can be somewhat attributed to the internet penetration rate in the region,
which is one of the lowest on the continent at 65.6%. However, in spite of this, the number of
ecommerce customers doubled from 2011 to 2016 to 18.8 million, meaning there is still an
argument for retailers to consider this market as one of potential.

Repeated financial crises and an attitude of mistrust towards major banks have caused a general
boycott of cards among the Italian populace, and in corroboration of that, 8 million Italians are
unbanked. What this means is that the major payment method in Italy is not affiliated with banking:
a large proportion of the population instead opt for prepaid cards, which can be purchased with
cash and then used for online shopping. To date, more than 25 million prepaid cards have been
issued, making Italy the world’s biggest market for the payment method.

11
  J.P. Morgan’s Country Insights: The Changing Dynamic of Payments in Europe – Italy,
https://www.jpmorgan.com/jpmpdf/1320745128271.pdf

11 | www.imrg.org
IMRG © - September 2018
Of equal interest is the usage of e-wallets in the region. While by value the method sits below
cards, as shown in the chart below, by volume, the payment method is leagues beyond the rest.
In 2016, there were 203.54 million transactions made by e-wallet, while only 70.68 million
purchases were made online by cards. This is perhaps reflected in Italy’s smartphone usage,
where 30% of all ecommerce payments are made by mobile. PayPal is once again dominant in
this area, accounting for around 17% of the Italian ecommerce market.

Cash is an interesting figure to mention. Italy has one of the highest cash usages in Europe,
perhaps demonstrating their reluctance for technological innovation. Despite the Italian
association CashlessWay implementing a ‘No Cash Day’ initiative, cash has remained resilient in
the country. This presents something of a challenge to online retailers, particularly with
operational functions such as collection of funds.

Italy, while not being a leading ecommerce player in Europe as of yet, nevertheless accounts for
a significant portion of UK exports. What this represents is an opportunity for retailers to establish
themselves at the crest of Italy’s ecommerce growth, and online merchants rising to the challenge
should concentrate on payment methods optimised for smartphone.

12 | www.imrg.org
IMRG © - September 2018
The Netherlands
The Dutch population are a people who have fully embraced ecommerce12. 95% of the adult
population shopped online in 2016, with almost 40% conducting transactions on their
smartphones. Further to this, the B2C ecommerce value increased by 22.6% year-on-year in 2016
to €20.16bn, demonstrating a surging market in which online merchants may find potential for
their brands.

The Dutch are unique in their overwhelming preference for one particular payment method: the
bank transfer. As displayed in the chart below, bank transfers account for 62% of ecommerce
transactions, a sizeable 50% higher than the next closest payment method, card, at 12%.

The popularity of bank transfers can be attributed to the home-grown service iDEAL, which
accounts for 56% of the market by value. iDEAL has a large breadth of shopper coverage and
the service is also enabled for mobile transactions, underpinning its position as the singular
payment method of choice. Its ubiquity, coupled with the fact that Maestro / V-Pay cards cannot
be used online in the country, means that any online retailer looking to establish themselves in
the Netherlands needs a payment method optimised for iDEAL as a matter of necessity.

12
  J.P. Morgan’s Country Insights: The Changing Dynamic of Payments in Europe – The Netherlands,
https://www.jpmorgan.com/jpmpdf/1320745416256.pdf

13 | www.imrg.org
IMRG © - September 2018
Commentary from Shane Brodbin, J.P. Morgan

“The payments market in Europe is undergoing a period of great transformation. The continuing
growth of the ecommerce sector, technological innovation and an evolving regulatory environment
are combining to fundamentally change the way people pay for goods and services. The customer
of today wants fast, convenient and secure payment options, available on demand and on their
device of choice. As a result, online merchants are having to expand the payment methods they
work with. To be successful, retailers have to find a way to continue to extend their brand into the
digital space, based on consumer-defined, behavioural frameworks that are still emerging.”

Conclusion
Since 2016, the EU has been the dominant destination for UK online retail cross-border trade.
The strength of the euro against sterling has evidently created a surge of European interest in UK
goods.

Each country has its own culture, and intrinsic to that culture is a certain attitude towards the
various ways in which people can pay. While cards are still the most prolific payment option in
Europe, some methods have achieved good penetration, and subtle changes in technology and
user expectation can create notable shifts in usage.

Nevertheless, each individual European country is its own entity. Ultimately, payments are not
governed by the options provided, but by the economic, social, political, and technological mindset
of the population. Further to this, merchants need to assess each market, as the different payment
methods may pose additional costs and challenges to a merchant.

In order to gain insight into this changing landscape, J.P. Morgan Merchant Services conducted
a survey of eleven different markets in Europe, taking an in-depth look at how the ecommerce
sector is developing across the region and examining the changing dynamics of the payments
space. You can read all eleven reports at www.jpmorgan.com/europe/merchant-
services/payment-insights.

14 | www.imrg.org
IMRG © - September 2018
About IMRG
For over 20 years, IMRG (Interactive Media in Retail Group) has been the voice of e-retail
in the UK. We are a membership community comprising businesses of all sizes –
multichannel and pureplay, SME and multinational, and solution providers to industry.
We support our members through a range of activities – including market tracking and
insight, benchmarking and best practice sharing. Our indexes provide in-depth intelligence
on online sales, mobile sales, delivery trends and over 60 additional KPIs.
Our goal is to ensure our members have the information and resources they need to
succeed in rapidly-evolving markets – both domestically and internationally.
www.imrg.org

About J.P. Morgan
Merchant Services is the payment acceptance and merchant acquiring business of JPMorgan
Chase & Co. – a global financial services firm with assets of $2.5 trillion and operations
worldwide. It is a leading provider of payment, fraud management and data security solutions,
capable of authorising payment transactions in more than 130 currencies. J.P. Morgan, through
its Merchant Services business, has uniquely combined proven payment technology with a long
legacy of merchant advocacy that creates quantifiable value for ecommerce companies. Its
processing platforms provide integrated solutions for all major credit and debit card payments as
well as mobile payments and processed more than $1 trillion in payment transaction volume
worldwide in 2017. According to The Nilson Report, it is also the top merchant acquirer of
ecommerce transactions in Europe 1.
Source:
1
The Nilson Report, #1132, May 2018.

Chase Paymentech Europe Limited, trading as J.P. Morgan is regulated by the Central Bank of
Ireland. The information herein or any document attached hereto does not take into account
individual client circumstances, objectives or needs and is not intended as a recommendation of
a particular product or strategy to particular clients and any recipient of this document shall
make its own independent decision. Information in this document has been obtained from
sources believed to be reliable, but neither Chase Paymentech Europe Limited nor any of its
affiliates warrant the completeness or accuracy of the information contained herein.

15 | www.imrg.org
IMRG © - September 2018
You can also read