Nutritional Status Of Under-Five Children In Libya; A National Population-Based Survey
←
→
Page content transcription
If your browser does not render page correctly, please read the page content below
Original Article                                                                                               www.ljm.org.ly

                     Nutritional Status Of Under-Five Children In Libya;
                             A National Population-Based Survey
                   El Taguri Adel1, 2, Rolland-Cachera Marie-Françoise3, Mahmud Salaheddin M4,
                 Elmrzougi Najeeb5, Abdel Monem Ahmed6, Betilmal Ibrahim7 and Lenoir Gerard1
                                            1 Hôspital Necker Enfants Malades, Paris, France
                            2 Department of Family and Community Medicine, Alfateh University, Tripoli, Libya
                                         3 Center de Recherche en Nutrition Humain (CRNH), Ile
                               de France, UMR U557 Inserm/ U1125 Inra/ Cnam/ Paris 13, Bobigny, France
                          4 Department of Community Health Sciences, University of Manitoba, Winnipeg, Canada
                                      5 Industrial Pharmacy, Faculty of Pharmacy, Alfateh Universit
                                  6 Pan Arab Project for Family Health (PAPFAM), League of Arab States
                                   7 Eastern Mediterranean Regional Office, World health organization

 Abstract
 Aim: To describe the nutritional status of children under-five years of age in Libya. Population and methods: A secondary
 analysis of data of 5348 children taken from a national representative, two-stage, cluster-sample survey that was performed
 in 1995. Results: Prevalence rates of underweight, wasting, stunting, and overweight were determined using standard
 definitions in reference to newly established WHO growth charts. The study revealed that 4.3% of children were underweight,
 3.7% wasted, 20.7% stunted, and 16.2% overweight. Seventy percent of children had normal weight. Undernutrition was
 more likely to be found in males, in rural areas, and in underprivileged groups. Overweight was more likely found in urban,
 privileged groups. Wasting was more common in arid regions; stunting was more common in mountainous regions of Al-
 Akhdar, Al-Gharbi, and in Sirt. Al-Akhdar had the highest prevalence of overweight. Conclusion: The country had a low
 prevalence of underweight and wasting, moderate prevalence of stunting, and high prevalence of overweight. The country is
 in the early stages of transition with evidence of dual-burden in some regions. Similar surveys are needed to verify secular
 trends of these nutritional problems, particularly overweight.
  Key words: Libya, preschool children, nutritional status, underweight, wasting, stunting, overweight

Introduction                                                          other. For example, combating undernutrition could
  Malnutrition is one of the leading causes of disease [1].           exacerbate overnutrition and displace the whole
Globally, undernutrition is an underlying or associated               population curve to the right, generating a significant
cause in at least half of all childhood deaths [2,3]. This            proportion of overweight and obese children [9, 12].
makes prevention of undernutrition in children one of the
top priorities in efforts to reduce childhood mortality [4].            The newly published growth charts from the WHO
The effects of malnutrition on children are not limited to            Multiple Centre Growth Reference Study, which includes
physical health, but extend to mental, social and spiritual           children from diverse countries, is unique in that it
wellbeing. They could be transmitted from one generation              documents children’s growth under optimal conditions,
to another, constituting a vicious spiral [5].                        rather than merely describing growth at a particular time
                                                                      or place. This establishes a standard rather than just a
  Contrary to common use, the term malnutrition refers                reference population [13].
not only to deficiency states, but also to excess or
imbalance in the intake of calories, proteins and/or other              Although some small "regional" surveys have been
nutrients [6]. Developing nations are not exempt from the             performed in Libya [14-16], there is no nationally
upward secular trend in the pandemic of obesity. Obesity is           representative peer-reviewed data on nutritional status of
now considered by WHO as the biggest unrecognized public              preschool children. In addition, overweight and/or
health problem [7]. The prevalence of obesity in some                 obesity have not been specifically examined. The Libyan
developing countries has reached even higher levels than in           maternal and child health survey (LMCHS), undertaken as
many industrialized nations [8].                                      part of the Pan Arab project for child development
                                                                      (PAPChild), is the first and only national representative
  Stunting can coexist with underweight or with                       survey of its type ever done in Libya [17,18]. The main
overweight/obesity [9]. The WHO recommends that                       report of LMCHS contains data on the prevalence of
developing countries monitor the co-existence of stunting             underweight and stunting; however, the data and its
and overweight in children, because these are risk factors            analysis are limited. We carried out a secondary analysis
for chronic disease in adulthood [5, 10]. Management of               to give a clearer picture of the nutritional status of
many chronic diseases that may develop due to the                     preschool children.
increased incidence of obesity would be beyond the
capacity of many nations [11].                                        Population & methods
                                                                        Design: This is a stratified, two-stage, cross-sectional,
  It is equally important to identify the coexistence of both         nationally representative, probability-cluster sample
undernutrition and overnutrition, as an intervention that is          survey. It was performed during the summer of 1995.
designed to prevent only one problem could exacerbate the             The country was divided into seven regions, each

      Page 13                                                                                  Libyan J Med, AOP: 071006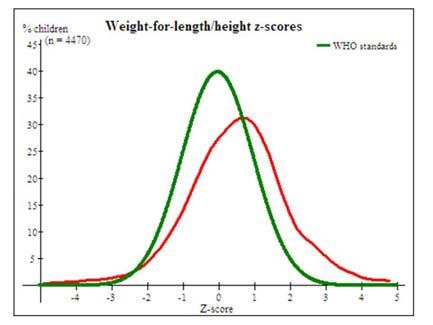
Original Article www.ljm.org.ly
subdivided into urban and rural areas. The regions were as The mean and standard deviation (SD) of the z-scores
follows (maps are available on request): was –0.07 ± 1.12 for W/A, 0.58 ± 1.42 for W/H, -0.90 ±
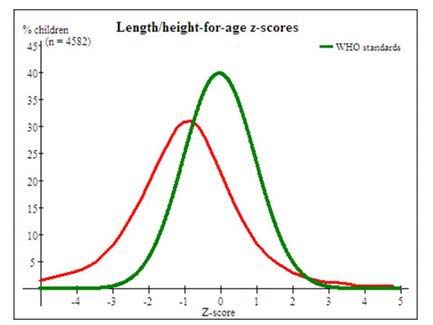
1.48 for H/A, and 0.65 ± 1.53 for BMI/A (Figures 2 a-d).
• two mountainous areas, Al-Djabal Al-Akhdar (Al- Equivalent curves comparing boys to girls were similar to
Akhdar) in the northeastern part, and Al-Djabal Al-Gharbi those of the whole population; no gender differences
(Al-Gharbi) in the northwestern part; were found. Examination of mean z-score and CI95% for
• two large and mainly desert areas with low population all these indicators for boys versus girls, even within
density: Khalij-Sirt (Sirt) and Sabha regions; different subgroups (regional, urban/rural, and
• three coastal regions, (a) Sahel Benghazi (Benghazi), a socioeconomic status), also showed no statistically
narrow coastal strip southwest of the eastern Al-Akhdar significant differences between sexes.
Mountains, (b) Tripoli region, the most densely populated
region in Libya, which contains the capital and two of the Table 1: Basic attributes of children participating in the
five major cities, and (c) Al-Zawia region, a littoral area study.
west of Tripoli. Variable Frequency (%)
In the first stage, 307 sampling units were selected from Socio-economic classification
Advantaged 1879 (35.1)
the seven regions. Each sampling unit was then divided into
Intermediate 1833 (34.3)
five segments of equal size, of which one was randomly Disadvantaged 1635 (30.6)
selected. All households in the selected segment were Gender
included in the sample, and all children aged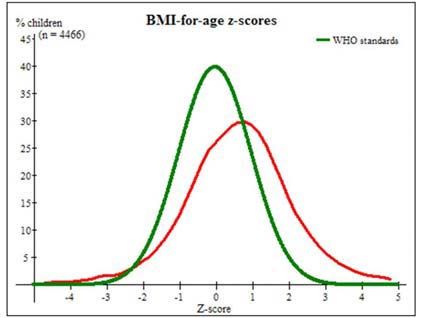
Original Article                                                                                            www.ljm.org.ly

Figure 2a: Comparison of the distribution of z-score for weight-for-   Figure 2d: Comparison of the distribution of z-score of BMI-for-
age of Libyan under-five children to WHO child growth standards.       age of Libyan under-five children to WHO child growth
                                                                       standards.

                                                                         Rural areas had lower mean H/A z-scores than urban
                                                                       areas (-1.01 versus -0.83). The more underprivileged
                                                                       groups had lower H/A z-scores than privileged groups (-
                                                                       1.04 versus -0.72). Mean z-score and CI95% for H/A
                                                                       showed statistically significant differences between
                                                                       regions. The two mountain regions had the lowest H/A z-
                                                                       scores (Figure 3a).
                                                                         All regions had positive BMI/A z-score values,
                                                                       especially Al-Akhdar region, with the exception of the arid
                                                                       Sabha region, which had a score of about zero (Figure
                                                                       3b).

Figure 2b: Comparison of the distribution of z-score for weight-for-
length of Libyan under-five children to WHO child growth
standards.

                                                                       Figure 3a: Mean and 95% Confidence Interval (95% CI) of
                                                                       height for age (H/A) z-scores in different regions.

Figure 2c: Comparison of the distribution of z-score of height-for-
age of Libyan under-five children to WHO child growth standards.

                                                                       Figure 3b: Mean and 95% Confidence Interval (95% CI) of body
                                                                       mass index for age (BMI/A) z-scores in different regions.

       Page 15                                                                                 Libyan J Med, AOP: 071006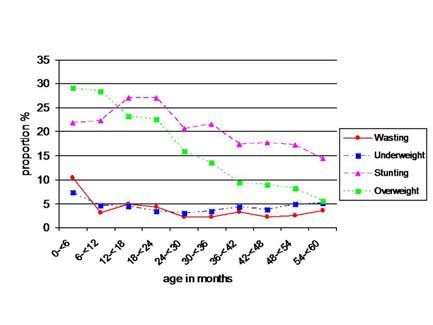
Original Article                                                                                                                   www.ljm.org.ly

                    Table 2: Prevalence rates of nutritional indicators according to basic demographic attributes

                                                               Number of cases (Prevalence rates %)
                   Category
                                                               Underweight                Wasting             Stunting                 Overweight

   Socio-economic Class
                                                               63 (3.9)                   56 (3.6)            283 (18.4)               273 (17.7)
        Advantaged Intermediate
                                                               57 (3.6)                   45 (3.0)            320 (20.8)               239 (15.6)
        Disadvantaged
                                                               82 (5.6)                   62 (4.4)            325 (23.0)               212 (15.0)

   Gender
       Boys                                                    111 (4.7)                  86 (3.9)            495 (22.2)               389 (17.5)
       Girls                                                   91 (3.9)                   77 (3.4)            434 (19.1)               335 (14.8)
   Area
       Urban                                                   133 (4.1)                  102 (3.3)           613 (19.6)               502 (16.2)
       Rural                                                   69 (4.9)                   60 (4.4)            316 (23.2)               221 (16.1)
   Geographical region
       Al-Akhdar
       Benghazi                                                24   (4.0)                 15   (2.7)          154 (27.9)               128 (23.1)
       Sirt gulf                                               22   (3.6)                 18   (3.0)          89 (14.7)                67 (11.2)
       Tripoli & Khoms                                         37   (5.7)                 43   (6.8)          157 (24.9)               80 (12.8)
       Al-Zaouia                                               52   (3.4)                 32   (2.1)          268 (17.7)               272 (18.2)
       Al-Gharbi                                               22   (4.8)                 18   (4.3)          86 (21.1)                76 (18.6)
       Sabha                                                   27   (5.3)                 19   (3.9)          122 (24.9)               74 (15.1)
                                                               19   (6.0)                 19   (6.4)          52 (17.3)                26 (8.7)

Table 3: Ranking of different geographical regions according to
importance of different malnutrition problems. For undernutrition:                                 This was mainly due to a high prevalence of wasting in
 Low level,  Intermediate level,  high level. For                                          the arid areas and stunting in mountain areas.
  Overnutrition:  Low level,  Intermediate level,  High level.                             Interestingly, the mountainous areas also had high
                          Level of the malnutritional problem                                    prevalence of overweight (Table 3).

                                                                                                   In the youngest children, overweight and stunting were
                          Underweight

                                                                             Overweight

                                                                                                 the most common malnutritional problems (Figure 4).
                                                    Stunting
                                         Wasting

                                                                                                 Overweight decreased by age, but stunting peaked in the
 Geographical
 region                                                                                          second year of life and then decreased, though it
                                                                                                 continued to be an important malnutritional problem.
   Al-Akhdar
                                                                                                   When mild stunting was added to the pool of stunted
   Benghazi                                                                                  cases, the proportion of stunted children increased
     Sirt gulf                                                                          substantially. The prevalence of mild, moderate, and
    Tripoli &                                                                              severe stunting was 25.9%, 13.2%, and 7.2%,
      Khoms                                                                               respectively, with mild stunting accounting for more than
   Al-Zaouia                                                                            half of all stunting. The contribution of mild cases
   Al-Gharbi                                                                              increased with age, while that of moderate cases
      Sabha                                                                                     remained fairly constant and severe cases decreased
                                                                                               almost to half by five years of age (Figure 5).

                                                                                                    In early infancy, the prevalence of stunting was higher
  The prevalence of malnutritional problems was higher in                                        among boys, but by the end of five years of age, the
boys, in rural areas, and in underprivileged groups. The                                         prevalence became higher in girls (Figure 6). Although
only exception was overweight, which was more common                                             prevalence rates were higher in rural areas, the
in urban areas and in privileged groups (Table 2). The                                           contribution from urban areas and larger cities, such as
higher prevalence of overweight in urban and in privileged                                       Tripoli, to the overall pool of malnutrition was
groups was even more prominent when overweight alone                                             quantitatively more important. As an example, in spite of
was considered (data not shown).                                                                 increased prevalence of stunting in rural areas, 60.5% of
                                                                                                 stunted children lived in urban areas. These urban areas
  The prevalence of these malnutritional problems varied                                         also contained 63.6% of overweight children.
with geographic area (Table 2). Underweight was more
common in arid areas, such as Sirt and Sabha, and in
mountain areas of Al-Akhdar and Al-Gharbi.

       Page 16                                                                                                         Libyan J Med, AOP: 071006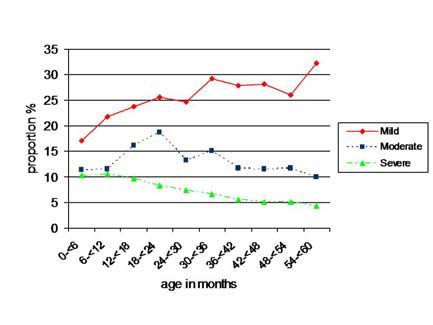
Original Article                                                                                        www.ljm.org.ly

                                                                    rather than a low prevalence area. When the data was
                                                                    collected in 1995, almost half of the children in the
                                                                    disadvantaged parts of the world were underweight
                                                                    and/or moderately or severely stunted [2,5,21]. In the
                                                                    same year, the average prevalence of overweight children
                                                                    in the developing countries, as revealed by weight for
                                                                    hight in reference to NCHS/WHO standards was 3.3%
                                                                    (0.1%-14.4%) [22].

                                                                       In developing countries and marginalized groups in
                                                                    affluent societies, undernutrition is increasing as a result
                                                                    of the debt crisis and consequent economic adjustment
                                                                    policies [9]. On the other hand, the rapid growth of some
                                                                    economies and changes in lifestyles, including diet and
Figure 4: Changes in the prevalence of main forms of malnutrition   physical      activity    patterns,    contribute   to   other
with age.                                                           malnutritional problems at the other end of the spectrum
                                                                    [9]. In fact, obesity is no longer considered a disease of
                                                                    industrialized nations only. Libya is a middle-income
                                                                    country, and improving the nutritional status and reducing
                                                                    health inequalities were at the centre of the government
                                                                    health policy during the seventies. Efforts were made to
                                                                    secure food for all populations by short and intermediate
                                                                    term measures, such as food subsidy programs and free
                                                                    distribution of breast milk substitutes to mothers., One of
                                                                    the important aspects of this survey, besides being the
                                                                    first of its kind, is that it was performed during the peak of
                                                                    political and economic difficulties that faced the country in
                                                                    the 1990s due to UN sanctions.

                                                                       In contrast to many African and Asian countries where
Figure 5: Prevalence rates of different degrees of stunting         rates of wasting were reported, in 2000, to be 2.5–3.5
according to age.                                                   times higher than rates of overweight [22], from the
                                                                    current study, both stunting and overweight are important
                                                                    public health nutritional problems in Libya, In the Libyan
                                                                    population as a whole, both W/H and BMI/A z-score
                                                                    curves were shifted to the right, the W/A z-score curve
                                                                    was about zero, and the H/A z-score curve was shifted to
                                                                    the left. Low prevalence of undernutrition and high
                                                                    prevalence of overweight in children indicates a
                                                                    population-wide shift and nutritional transition. The wide
                                                                    difference in the prevalence rates of wasting and stunting
                                                                    in Libya indicates an early phase of transition [23]. The
                                                                    most disadvantaged countries usually have higher
                                                                    prevalence rates of both wasting and stunting. In middle
                                                                    income countries, acute forms start to decrease first,
                                                                    whereas the most advantaged countries show lower
Figure 6: Gender differences in prevalence rates of stunting by
                                                                    prevalence rates of both acute and chronic forms [24,25].
age.
                                                                       Stunting (low H/A) is a public health problem worldwide.
Discussion                                                          It is a measure of cumulative deficient growth and a
   Knowing the prevalence rates of underweight, wasting,            feature of a complex syndrome including developmental
and stunting is important for determining the overall               delay, impaired immune function, reduced cognitive
health of the community and for monitoring achievements             development,      metabolic     disturbance    leading   to
toward mid-decade goals for nutrition and child health set          accumulation of body fat, loss of lean mass, and risk of
by international organizations [19,20]. Based on the main           hypertension [3,26]. Several nutritional deficiencies occur
report of the LMCHS, which used the NCHS/WHO                        simultaneously in stunted children and all may be
reference population (according to WHO criteria), Libya             responsible for stunting [27], but these were not studied
was considered as a low prevalence area for underweight,            in the current survey. Though mild forms of stunting have
wasting, and stunting. Currently, using the newly                   a lower risk of death than moderate/severe undernutrition
published WHO standards, we found that 70% of children              [28], we included mild stunting in our analysis because of
had normal weight, 4.3% were underweight, 3.7% were                 its impact on mild and moderate undernutrition, and on
wasted, 20.7% were stunted, and 16.2% were                          the overall disease burden at the community level [29,30].
overweight. The 20.7% prevalence rate of stunting                      Disaggregated data in this analysis showed that the
classifies the country as a moderate prevalence area                prevalence rates of indicators of undernutrition were

       Page 17                                                                              Libyan J Med, AOP: 071006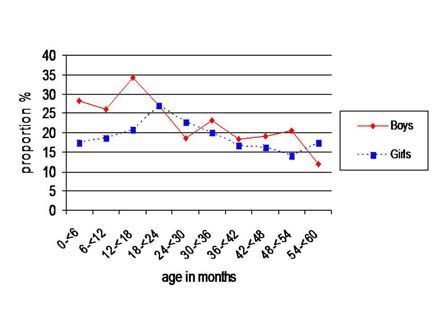
Original Article                                                                                       www.ljm.org.ly

higher among boys, in underprivileged groups of the             Overweight was reported in only one of these studies
population, and in rural areas. Equity is one of the four       [16], but that study was not representative as only two
basic principles of primary health care as declared in the      regions were included (3% in Al-Gharbi and 7% in Tripoli).
Alma Ata declaration [32]. Beside socioeconomic classes,        The definition used for overweight was not the same (W/H
an important dimension of equity is gender equity. An           z-score rather than BMI/A z-score).
equal degree of undernutrition among boys and girls less
than age of five by the year 2020 is accepted                      The proportional contribution of each category to the
internationally as a mean for evaluating equity in different    burden of these problems is different from the prevalence
societies [19, 20]. As in previous regional studies in Libya,   of each malnutrition factor. Most cases of malnutrition
girls were at less risk of undernutrition. Similar              were among urban dwellers. This has implications in
observations in other African countries have shown that all     service delivery planning. In many countries the nutritional
forms of undernutrition were higher among boys [33].            status of lower socioeconomic children is worse among all
However, disaggregated data showed that by age five,            urban groups and poorer than the rural average [21].
there were more stunted girls than boys. This was due to        Slums have not existed in Libya since the late 1970s, but
a decrease in the prevalence of stunting among older boys       urban areas remain unequal in living conditions. The
rather than an increase among girls (Figure 6).                 relative division in urban areas living conditions was not
                                                                incorporated in this study. An equity-motivated policy
  As seen in the current analysis, the second year of life is   during the 1970s had driven the authorities in Libya to
a critical period for undernutrition, because the child is      expand services horizontally, with the advantage to rural
dependent      on    someone     for   nutritional  intake,     areas. It may be time to reconsider horizontal equity in
complimentary foods are introduced, and the child is            urban regions similar to vertical equity in rural areas.
exposed to food-borne pathogens [35,36]. As shown in            There was a low prevalence of underweight and wasting,
the current study, stunting is known to decrease by age         moderate levels of stunting, and high levels of overweight.
four to five. This seems to be true for moderate and            Although this makes the nutritional status of preschool
severe stunting, but not for mild stunting. Other studies       children in Libya better than that in many developing
have shown increased stunting with age [37-39]. This            countries, there is room for much improvement. A
could signify that while the detrimental environmental          particular finding was the pattern of obesity together with
effects diminish with age, they do not completely               stunting, more common in certain regions. It is important
disappear. The high prevalence of mild stunting would still     to monitor nutritional status over time to assess the
be considered even if the accepted theoretical 13% of          effects of major socioeconomic changes in the country,
cases from the normal distribution curve were excluded.         and to evaluate micronutrient status of our population.
                                                                The consequence of failing to do so will likely produce
   An important finding from the disaggregated data was         negative outcomes.
the variable geographical distribution, especially the high
incidence of both stunting and overweight in mountainous        References:
regions and wasting in arid areas, and low prevalence of           1. Ezzati M, Lopez AD, Rodgers A, Vander Hoorn S, Murray CJ.
stunting in the arid area of Sabha. These regional              Selected major risk factors and global and regional burden of
differences could be related to climate, altitude, dietary      disease. Lancet 2002; 360:1347-60.
                                                                   2. de Onis M, Blossner M, Borghi E, Frongillo EA, Morris R.
habits, ethnic origins, or sociocultural factors [37,40].
                                                                Estimates of global prevalence of childhood underweight in 1990
Inhabitants in the more arid areas of Sabha and Sirt            and 2015. Jama 2004; 291:2600-6.
traditionally have diets that consist primarily of food of         3. Branca F, Ferrari M. Impact of micronutrient deficiencies on
animal origin, which could explain their low rates of           growth: the stunting syndrome. Ann Nutr Metab 2002; 46 Suppl
stunting. Inhabitants of both mountainous areas rely            1:8-17.
heavily on cereals. People in the eastern parts of the             4. Caulfield LE, de Onis M, Blossner M, Black RE. Undernutrition
country consume considerable amounts of food of animal          as an underlying cause of child deaths associated with diarrhea,
origin, while in western mountainous areas they consume         pneumonia, malaria, and measles. Am J Clin Nutr 2004; 80:193-8.
                                                                   5. Gillespie S, Mason J, Martorell R: How Nutrition Improves.
a wide range of whole grain cereals and dried fruits.
                                                                In: State of the Art series. United Nations Administrative
Further studies are needed to verify possible regional          Committee       on    Coordination-Subcommittee      on   Nutrition
differences.                                                    (ACC/SCN): Geneva; 1993.
                                                                   6. Child Growth Standards. World Health Organization.
   In this analysis, the highest dual burden (stunting          [http://who.int/childgrowth]; 2006.
combined with overweight) at the individual level was              7. James PT, Leach R, Kalamara E, Shayeghi M. The worldwide
seen in Al-Akhdar Mountains. Combined overweight and            obesity epidemic. Obes Res 2001; 9 Suppl 4:228S-233S.
stunting is more likely to be associated with central              8. Obesity. Preventing and Managing the Global Epidemic:
                                                                World Health Organization; 2000. Report No.: 894.
obesity and its metabolic effects. Regionally, the highest
                                                                   9. Doak CM, Adair LS, Bentley M, Monteiro C, Popkin BM. The
dual burden was seen in Al-Zaouia, Al-Gharbi and Al-            dual burden household and the nutrition transition paradox. Int J
Akhdar regions. It is in these regions that interventions       Obes (Lond) 2005; 29:129-36.
designed for one form of malnutrition might exacerbate             10. World Health Organization. The World Health Report:
another. We found that the proportion of stunting among         Reducing Risk, Promoting Healthy Life. Geneva: WHO; 2002.
overweight children was quite high in comparison to data           11. Moore TR. Adolescent and adult obesity in women: a tidal
from other transitional countries [41].                         wave just beginning. Clin Obstet Gynecol 2004; 47:884-9;
                                                                discussion 980-1.
                                                                   12. Uauy R, Kain J. The epidemiological transition: need to
  The reported undernutrition indicators from previous
                                                                incorporate obesity prevention into nutrition programmes. Public
regional studies were comparable to our data [14-16].           Health Nutr 2002; 5:223-9.

       Page 18                                                                            Libyan J Med, AOP: 071006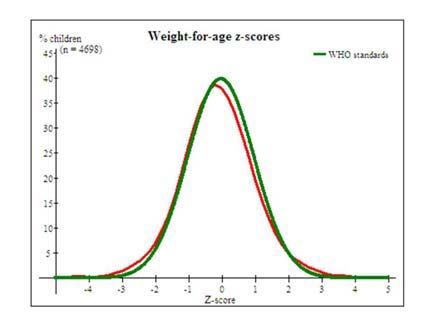
Original Article                                                                                             www.ljm.org.ly

   13. MGRS. Enrolment and baseline characteristics in the WHO        Collaborative Research Support Program. Kenya and Egypt
Multicentre Growth Reference Study. Acta Paediatr Suppl 2006;         studies. Eur J Clin Nutr 1994; 48 Suppl 1:S90-102.
450:7-15.                                                                36. Frongillo EA, Jr. Symposium: Causes and Etiology of
   14. Budejaja A SR, Amanullah Khan, Gupta BS. Anthropometric        Stunting. Introduction. J Nutr 1999; 129(2S Suppl):529S-530S.
measurements in children up to five years of age in Bouhadema            37. Behrman JR, Skoufias E. Correlates and determinants of
area, Benghazi. Garyounis Med J 1980; 3:163-73.                       child anthropometrics in Latin America: background and overview
   15. EL-Tajouri RF. Cross sectional study of growth in urban        of the symposium. Econ Hum Biol 2004; 2:335-51.
pre-school children in Libya [Ph.D. Dissertation]: University of         38. Khuwaja S, Selwyn BJ, Shah SM. Prevalence and correlates
Zurich; 1979.                                                         of stunting among primary school children in rural areas of
   16. Hameida J, Billot L, Deschamps JP. Growth of preschool         southern Pakistan. J Trop Pediatr 2005; 51:72-7.
children in the Libyan Arab Jamahiriya: regional and                     39. El-Sayed N, Mohamed AG, Nofal L, Mahfouz A, Zeid HA.
sociodemographic differences. East Mediterr Health J 2002;            Malnutrition among pre-school children in Alexandria, Egypt. J
8:458-69.                                                             Health Popul Nutr 2001; 19:275-80.
   17. Arab Maternal and Child Health Survey. League of Arab             40. Dang S, Yan H, Yamamoto S. High altitude and early
States. The Pan Arab Project for Child Development (PAPChild).        childhood growth retardation: new evidence from Tibet. Eur J Clin
League of Arab States. Last accessed 28 august, 2007.                 Nutr 2007, Mar 7; [Epub ahead of print].
   18. The Arab Libyan Maternal and Child Health Survey. League          41. Jinabhai CC, Taylor M, Sullivan KR. Implications of the
of Arab States - The Pan Arab Project for Child Development:          prevalence of stunting, overweight and obesity amongst South
Principle Report: The General People's Committee for Health and       African primary school children: a possible nutritional transition?
Social Affaires; 1996.                                                Eur J Clin Nutr 2003; 57:358-65.
   19. Bloss E, Wainaina F, Bailey RC. Prevalence and predictors
of underweight, stunting, and wasting among children aged five
and under in western Kenya. J Trop Pediatr 2004; 50:260-70.
   20. Measuring Progress towards the Health Millennium
Development Goals. World Health Organization; 2006.
   21. Ghosh S, Shah D. Nutritional problems in urban slum
children. Indian Pediatr 2004; 41:682-96.
   22. de Onis M, Blossner M. Prevalence and trends of
overweight among preschool children in developing countries. Am
J Clin Nutr 2000; 72:1032-9.
   23. Martorell R TJH. Child Survival: Strategies for Research.
Malnutrition, Morbidity, and Mortality. Popul Dev Rev 1984;
10(Supp 84):49-68.
   24. Mamabolo RL, Alberts M, Mbenyane GX, Steyn NP,
Nthangeni NG, Delemarre-Van De Waal HA, et al. Feeding
practices and growth of infants from birth to 12 months in the
central region of the Limpopo Province of South Africa. Nutrition
2004; 20:327-33.
   25. Shgair H AA, Sharshoor S. Nutritional Status of Children in
some Arab Countries. Arab Congress for Maternal & Child Health.
PAPChild - League of Arab States; 1999; 1999.
   26. Martins PA, Hoffman DJ, Fernandes MT, Nascimento CR,
Roberts SB, Sesso R, et al. Stunted children gain less lean body
mass and more fat mass than their non-stunted counterparts: a
prospective study. Br J Nutr 2004; 92:819-25.
   27. Ibrahim SA, Abd el-Maksoud A, Nassar MF. Nutritional
stunting in Egypt: which nutrient is responsible? East Mediterr
Health J 2002; 8:272-80.
   28. Schroeder DG, Brown KH. Nutritional status as a predictor
of child survival: summarizing the association and quantifying its
global impact. Bull World Health Organ 1994; 72:569-79.
   29. de Onis M, Garza C, Habicht JP. Time for a new growth
reference. Pediatrics 1997; 100:E8.
   30. Pelletier DL. The potentiating effects of malnutrition on
child mortality: epidemiologic evidence and policy implications.
Nutr Rev 1994; 52:409-15.
   31. Armstrong J, Dorosty AR, Reilly JJ, Emmett PM.
Coexistence of social inequalities in undernutrition and obesity in
preschool children: population based cross sectional study. Arch
Dis Child 2003; 88:671-5.
   32. Declaration of Alma-Ata. International Conference on
Primary Health Care, Alma-Ata, USSR, 1978.
   33. Wamani H, Astrom AN, Peterson S, Tumwine JK, Tylleskar
T. Boys are more stunted than girls in sub-Saharan Africa: a
meta-analysis of 16 demographic and health surveys. BMC Pediatr
2007; 7:17.
   34. Caputo A, Foraita R, Klasen S, Pigeot I. Undernutrition in
Benin-an analysis based on graphical models. Soc Sci Med 2003;
56:1677-91.
   35. Neumann CG, Harrison GG. Onset and evolution of stunting
in infants and children. Examples from the Human Nutrition

       Page 19                                                                                  Libyan J Med, AOP: 071006
You can also read