Superintendent Release 0.5.2 - Jan Freyberg
←
→
Page content transcription
If your browser does not render page correctly, please read the page content below
superintendent
     Release 0.5.2

     Jan Freyberg

         Jan 10, 2021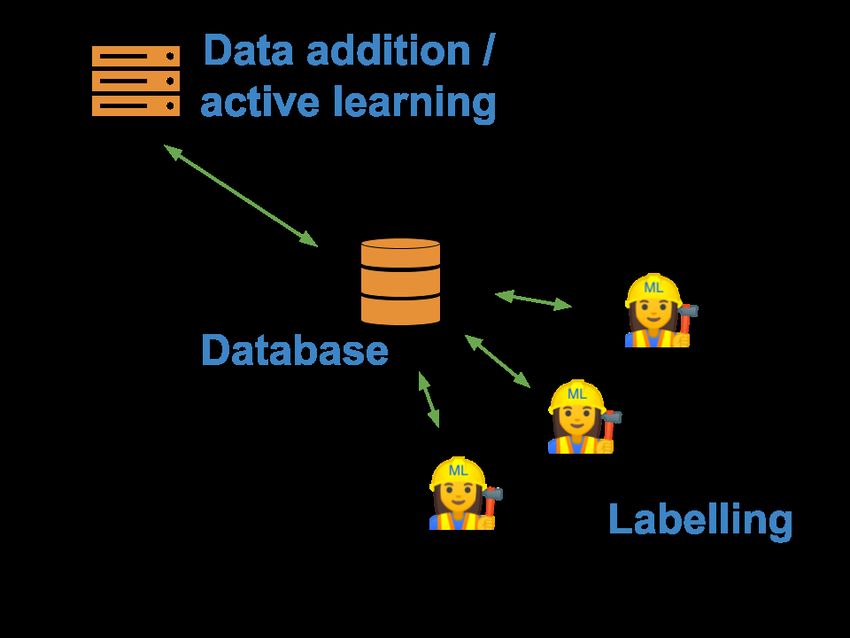
CONTENTS:

1   Installation                                                                                                                                                               3
    1.1 Development installation . . . . . . . . . . . . . . . . . . . . . . . . . . . . . . . . . . . . . . . . .                                                             3

2   Labelling data with superintendent                                                                                                                                         5
    2.1 Getting started: labelling data points . . . . . . . . . . . . . . . . . . . . . . . . . . . . . . . . . . .                                                           5
    2.2 Assigning more than one label per data point . . . . . . . . . . . . . . . . . . . . . . . . . . . . . .                                                               8

3   Active learning with superintendent                                                                                                                                       11
    3.1 What is active learning? . . . . . . . . . . . . .    .   .   .   .   .   .   .   .   .   .   .   .   .   .   .   .   .   .   .   .   .   .   .   .   .   .   .   .   11
    3.2 Active learning in superintendent . . . . .           .   .   .   .   .   .   .   .   .   .   .   .   .   .   .   .   .   .   .   .   .   .   .   .   .   .   .   .   12
    3.3 Active learning strategies . . . . . . . . . . . .    .   .   .   .   .   .   .   .   .   .   .   .   .   .   .   .   .   .   .   .   .   .   .   .   .   .   .   .   14
    3.4 Active learning for multi-output widgets . . . .      .   .   .   .   .   .   .   .   .   .   .   .   .   .   .   .   .   .   .   .   .   .   .   .   .   .   .   .   14
    3.5 Preprocessing data before passing it to the model     .   .   .   .   .   .   .   .   .   .   .   .   .   .   .   .   .   .   .   .   .   .   .   .   .   .   .   .   14
    3.6 What model to choose . . . . . . . . . . . . . .      .   .   .   .   .   .   .   .   .   .   .   .   .   .   .   .   .   .   .   .   .   .   .   .   .   .   .   .   15

4   Scaling labelling and active learning                                                                                                                                     17
    4.1 Distributing the labelling of images across people . . . . . . . . . . . . . . . . . . . . . . . . . . . .                                                            18
    4.2 Retrieving data from the distributed widget . . . . . . . . . . . . . . . . . . . . . . . . . . . . . . .                                                             20
    4.3 Doing active learning during distributed labelling . . . . . . . . . . . . . . . . . . . . . . . . . . . .                                                            20

5   Elements of a superintendent widget                                                                                                                                       23

6   API Reference                                                                                                                                                             25
    6.1 Data labelling widgets . . . . . . . . . . . . . . . . . . . . . . . . . . . . . . . . . . . . . . . . . .                                                            25
    6.2 Distributed data labelling widgets . . . . . . . . . . . . . . . . . . . . . . . . . . . . . . . . . . . .                                                            26
    6.3 Active learning functions . . . . . . . . . . . . . . . . . . . . . . . . . . . . . . . . . . . . . . . . .                                                           30

7   Examples                                                                                                                                                                  31
    7.1 Labelling text . . . . . . . . . . . . . . . . . . . . . . . . . . . . . . . .                            .   .   .   .   .   .   .   .   .   .   .   .   .   .   .   31
    7.2 Labelling images with superintendent . . . . . . . . . . . . . . . .                                      .   .   .   .   .   .   .   .   .   .   .   .   .   .   .   32
    7.3 Labelling images with active learning . . . . . . . . . . . . . . . . . . .                               .   .   .   .   .   .   .   .   .   .   .   .   .   .   .   32
    7.4 Preprocessing data before passing it to the model . . . . . . . . . . . . .                               .   .   .   .   .   .   .   .   .   .   .   .   .   .   .   33
    7.5 Using docker-compose to serve a superintendent interface to many users                                    .   .   .   .   .   .   .   .   .   .   .   .   .   .   .   35

8   Indices and tables                                                                                                                                                        43

Index                                                                                                                                                                         45

                                                                                                                                                                               i
ii
superintendent, Release 0.5.2

Superintendent provides two things: it allows you to interactively label your data, and it allows you to do this labelling
“actively”, i.e. with a statistical or machine learning model supporting you.
superintendent is a set of ipywidget-based interactive labelling tools for your data. It allows you to flexibly
label all kinds of data.
It also allows you to combine your data-labelling task with a statistical or machine learning model to enable quick and
practical active learning.

CONTENTS:                                                                                                               1
superintendent, Release 0.5.2

2                               CONTENTS:
CHAPTER

                                                                                                                ONE

                                                                                                  INSTALLATION

The simplest way to install superintendent is to use pip:

pip install superintendent

This will install superintendet alongside all the other libraries that you will need to run it.
If you want to use keyboard shortcuts, then you will also need to configure the ipyevents notebook extension.
Simply run on the command line:

jupyter nbextension enable --py --sys-prefix ipyevents

If you also want to run the examples, you need three additional packages: requests, bs4 and wordcloud. You
can install them via pip by running pip install superintendent[examples].

1.1 Development installation

If you want to contribute to superintendent, you will need to install the test dependencies as well. You can do so
with pip install superintendent[tests,examples].

Note: This page will display what superintendent widgets look like, but not respond to user input (as it’s not connected
to a backend).

                                                                                                                      3
superintendent, Release 0.5.2 4 Chapter 1. Installation
CHAPTER

                                                                                                                     TWO

                                                  LABELLING DATA WITH SUPERINTENDENT

    One of the most important activities in a machine learning problem can be the data labelling stage. If you start out
    with completely unlabelled data, you can either use unsupervised learning techniques, or you can label data, and either
    use semi-supervised or supervised machine learning techniques.
    superintendent was built with this in mind: labelling data as part of a data science / machine learning project.
    Because the aim of this package is to integrate with existing workflows as much as possible, superintendent is
    designed to work in the interactive python ecosystem: in jupyter notebooks and jupyter lab.
    The idea behind this approach - putting data labelling right in the notebook - is that it allows users to very easily and
    quickly prototype their machine learning models, with self-created labels, without leaving their working environment.
    Since jupyter notebooks run in a web browser, all widgets inside superintendent can also be deployed as web applica-
    tions, using the notebook-to-website tool ``voila` `__.
    Superintendent provides the following widgets for general-purpose class labelling:
       1. superintendent.ClassLabeller, for assigning one label per data point
       2. superintendent.MultiClassLabeller, for assigning multiple labels per data point
    Both of these classes allow users to do active learning, meaning you can leverage a machine learning model to reduce
    the number of labels you have to create before you get to good levels of accuracy.
    For detailed examples, take a look at the examples gallery.

    2.1 Getting started: labelling data points

    A common use-case is this: you want to assign a label for every data point. You can use the SemiSupervisor
    widget for this:

[1]: from superintendent import ClassLabeller

    For all superintendent widgets, you provide data using the features argument:

[2]: widget = ClassLabeller(
         features=[
             "First datapoint",
             "Second datapoint",
             "Third datapoint",
         ],
         options=[
             "First option",
             "Second option",
                                                                                                        (continues on next page)

                                                                                                                              5
superintendent, Release 0.5.2
(continued from previous page)
]
)
To display a superintendent widget, you simply have to put it as the last statement in a jupyter notebook cell.
[3]: widget
VBox(children=(HBox(children=(FloatProgress(value=0.0, description='Progress:', max=1.
˓→0),)), Box(children=(Out...
Note: An alternative way to display the widget is to explicitly call the IPython.display.display function.
Once you have labelled points, you can get your new labels with the new_labels attribute:
[4]: widget.new_labels
[4]: ['First option', 'Second option', None]
Read the documentation for SemiSupervisor to find the different options you can provide.
2.1.1 Customising your input options
What options you provide to the person doing the labelling can have big effects on how your data will be labelled.
superintendent therefore allows you to modify a lot of aspects of the “Input widget”.
Other text field input
By default, a text field is available for users to submit additional labels. Once submitted, these labels are presented to
the user as buttons as well.
If you want to prevent people from being able to submit a “Other” option, you can do so with the allow_freetext
keyword argument:
[5]: ClassLabeller(
features=[
"First datapoint",
"Second datapoint",
"Third datapoint",
],
options=[
"First option",
"Second option",
],
allow_freetext=False,
)
VBox(children=(HBox(children=(FloatProgress(value=0.0, description='Progress:', max=1.
˓→0),)), Box(children=(Out...
6 Chapter 2. Labelling data with superintendentsuperintendent, Release 0.5.2
Displaying options as buttons or dropdowns
You can provide as many options as you want for your labelling task. However, if there are too many, displaying
them as buttons won’t look good anymore, so by default, superintendent will switch to displaying options as a
dropdown eventually.
[6]: ClassLabeller(
features=[
"First datapoint",
"Second datapoint",
"Third datapoint",
],
options=range(15),
)
VBox(children=(HBox(children=(FloatProgress(value=0.0, description='Progress:', max=1.
˓→0),)), Box(children=(Out...
2.1.2 Customising how your data is displayed
By default, superintendent will display your data in the same way jupyter notebooks display your data when you return
it at the end of a notebook cell: Using the IPython.display.display function.
However, in many cases, you will want to customise the data that gets displayed. You can provide a custom display
function to all superintendent widgets for this purpose.
For example, if you wanted the text to be displayed with a normal font, rather than a monospaced font, you could
define a function to do so:
[7]: from IPython.display import display, Markdown
def display_text(data):
display(Markdown(data))
[8]: ClassLabeller(
features=[
"First datapoint",
"Second datapoint",
"Third datapoint",
],
display_func=display_text
)
VBox(children=(HBox(children=(FloatProgress(value=0.0, description='Progress:', max=1.
˓→0),)), Box(children=(Out...
You can also perform custom pre-processing by passing a function as the display_preprocess argument.
[9]: ClassLabeller(
features=[
"First datapoint",
"Second datapoint",
"Third datapoint",
],
display_func=display_text,
display_preprocess=lambda x: x.lower()
)
2.1. Getting started: labelling data points 7superintendent, Release 0.5.2
VBox(children=(HBox(children=(FloatProgress(value=0.0, description='Progress:', max=1.
˓→0),)), Box(children=(Out...
The display function can be anything that shows something in a jupyter notebook. For more ways of displaying data,
you can take a look at the IPython documentation.
2.2 Assigning more than one label per data point
If you are, say, classifying text, you often encounter the situation that a data point falls into more than one category. In
machine learning, this is often referred to as a “multi-output” problem: You’d like to eventually build models that can
assign more than one label to each data point.
In Superintendent, this is achieved with the MultiClassLabeller widget, which functions identically to the
ClassLabeller widget except it allows you to label each data point with multiple options.
[11]: from superintendent import MultiClassLabeller
widget = MultiClassLabeller(
features=[
"First datapoint",
"Second datapoint",
"Third datapoint",
],
options=[
"Option 1",
"Option 2",
"Option 3",
"Option 4",
]
)
widget
VBox(children=(HBox(children=(FloatProgress(value=0.0, description='Progress:', max=1.
˓→0),)), Box(children=(Out...
In this case, the labels created are actually a list of lists:
[12]: widget.new_labels
[12]: [['Option 1', 'Option 2'], ['Option 3'], None]
Similar to the single-label widget, when there are too many options to display neatly as buttons, the widget will change
to a multi-select input:
[13]: from superintendent import MultiClassLabeller
MultiClassLabeller(
features=[
"First datapoint",
"Second datapoint",
"Third datapoint",
],
options=[
"Option {}".format(i)
for i in range(15)
(continues on next page)
8 Chapter 2. Labelling data with superintendentsuperintendent, Release 0.5.2
(continued from previous page)
]
)
VBox(children=(HBox(children=(FloatProgress(value=0.0, description='Progress:', max=1.
˓→0),)), Box(children=(Out...
Note: This page will display what superintendent widgets look like, but not respond to user input (as it’s not connected
to a backend).
2.2. Assigning more than one label per data point 9superintendent, Release 0.5.2 10 Chapter 2. Labelling data with superintendent
CHAPTER

                                                                                                       THREE

                                          ACTIVE LEARNING WITH SUPERINTENDENT

3.1 What is active learning?

Active learning is a semi-supervised machine learning approach that involves labelling data to optimally train a ma-
chine learning model.
This means a human and a machine learning algorithm interact, with the human labelling cases the machine learning
algorithm is most unsure about.
A common implementation is what is known as “pool-based” active learning: You label a few cases, train your model,
make predictions about the unlabelled data, and then label the points for which your model is not (yet) producing
high-probability predictions.
The rough steps are:

                                                                                                                 11
superintendent, Release 0.5.2
This approach is generally more efficient than labelling data points at random, and it allows you to reach a better model
performance faster.
3.2 Active learning in superintendent
The active learning process in superintendent is easy. superintendent is designed to work with any machine
learning model that outputs continuous probabilities and follows the scikit-learn interface (i.e. the model implements
a fit and predict_proba method).
You then simply pass the model, as well as a method of re-ordering the data, to a superintendent widget. This
then gives you a button that allows you to re-train a model.
To demonstrate this, we’ll create manual labels for the MNIST dataset, which we can download using scikit-learn’s
datasets module. For simplicity, we will only use the first 500 images.
[1]: from sklearn.datasets import load_digits
digits = load_digits().data[:500, :]
print(digits.shape)
(500, 64)
These are 8x8 pixel images, but the 64 pixels have been “flattened” into the second array dimension, which we can
undo:
12 Chapter 3. Active learning with superintendentsuperintendent, Release 0.5.2
[2]: digits = digits.reshape(-1, 8, 8)
print(digits.shape)
(500, 8, 8)
Now, in most applications these days, you would likely classify images using a convolutional neural network. But for
now, we can take a stab at it using a simple logistic regression model, which isn’t great, but fairly good.
[3]: from sklearn.linear_model import LogisticRegression
model = LogisticRegression(
solver="lbfgs",
multi_class="multinomial",
max_iter=5000
)
In addition, all scikit-learn models expect data to be “rectangular”. This means we need to preprocess the data that
goes into our model. We can pass an arbitrary pre-processing function to superintendent - as long as it accepts the
features and labels, and returns the transformed features and labels:
[4]: def preprocess_mnist(x, y):
return x.reshape(-1, 64), y
Now that we have a dataset, as well as a supervised machine learning model we want to train on our dataset, we can
pass both to superintendent’s ClassLabeller. This will create an interface for us to label data, retrain our
model, and benefit from active learning.
Since we are using images, we can use the from_images class constructor that sets the correct display function for
us.
[5]: from superintendent import ClassLabeller
data_labeller = ClassLabeller.from_images(
canvas_size=(200, 200),
features=digits,
model=model,
options=range(10),
acquisition_function='entropy',
model_preprocess=preprocess_mnist
)
data_labeller
VBox(children=(HBox(children=(HBox(children=(FloatProgress(value=0.0, description=
˓→'Progress:', max=1.0),), lay...
Whenever you re-train a model, if you have also specified the acquisition_function keyword argument, the
data will be automatically re-ordered in a way prioritise the optimal subsequent data points.
Additionally, the widget will display your accuracy on the data you have already labelled. This is evaluated as the
mean model score across three folds of cross-validated evaluation.
3.2. Active learning in superintendent 13superintendent, Release 0.5.2
3.3 Active learning strategies
Superintendet currently implements the following strategies:
entropy(probabilities) Sort by the entropy of the probabilities (high to low).
margin(probabilities) Sort by the margin between the top two predictions (low
to high).
certainty(probabilities) Sort by the certainty of the maximum prediction.
You can implement your own strategy: the functions should simply take in a numpy array (shape n_samples, n_classes)
of probabilities of each class for each sample, and return a ranking of the rows of that array.
For example, if sorting by margin, an input of:
0 1 2
0.1 0.8 0.1
0.3 0.3 0.4
0.33 0.33 0.34
0.01 0.01 0.98
Should produce an output of:
[2, 1, 0, 3]
because the third entry has the lowest margin, then the second entry, then the first, and then the last.
3.4 Active learning for multi-output widgets
When you pass a model into a multi-labelling widget, superintendent will wrap your model in a MultiOutput-
Classifier wrapper class.
The active learning strategy will average the metric used for prioritisation (e.g. certainty, margin) across the different
classes.
3.5 Preprocessing data before passing it to the model
In general, you will often want to pass different parts of your data to your display function and your model. In general,
superintendent does not provide “pre-model” hooks. Instead, any pre-processing that is specific to your model or your
display function, can be specified in the display_func, or in a scikit-learn Pipeline object.
You can find an example of this here
14 Chapter 3. Active learning with superintendentsuperintendent, Release 0.5.2 3.6 What model to choose The choice of model is ultimately driven by the same factors that should drive your model choice if you had a complete set of labelled data and wanted to build a supervised machine learning model. Note: This page will display what superintendent widgets look like, but not respond to user input (as it’s not connected to a backend). 3.6. What model to choose 15
superintendent, Release 0.5.2

16                              Chapter 3. Active learning with superintendent
CHAPTER

                                                                                                                FOUR

                                      SCALING LABELLING AND ACTIVE LEARNING

One of the main challenges about labelling data is that it can take a lot of time.
To get around this, many people want to distribute the task across multiple people - potentially even outsourcing it to
a crowd platform - and this is challenging using a standard in-memory python object.
In superintendent, you can get around this by using the superintendent.distributed submodule. The
labelling widgets effectively replicate the widgets in the main superintendet module, but do so using a database
to store the “queue” of objects, as well as the results of the labelling.
The distributed submodule stores and retrieves data from a SQL database, serialising / deserialising it along the way.
You simply pass your data in the same way you do with superintendent widgets, and can retrieve the labels in
the same way. In theory, other than having to set up the database, everything else should be the same.

 Warning: For demonstration purposes, this example uses an SQLite file as a database. However, this is unsuitable
 for real distribution of labelling, as if it is on a shared file-system, it will break. In production, a database server
 is recommended. In the past, superintendent has been used successfully with PostgreSQL, but any database that
 works with SQLAlchemy should work.

The use case ultimately looks a bit like this:

                                                                                                                       17
superintendent, Release 0.5.2
This allows you to ask your colleagues to label data for you. By removing the labelling process from the active
learning process, it also allows you to scale the compute that does the active learning, e.g. use a server with GPUs to
train complex models, while the labelling user can just use a laptop.
Ultimately, the database architecture also means that you have more persistent storage, and are more robust to crashes.
4.1 Distributing the labelling of images across people
superintendent uses SQLAlchemy to communicate with the database, and all you need to provide is a “connec-
tion url”.
First, we make sure that we are using a completely fresh database:
[1]: import os
if os.path.isfile("demo.db"):
os.remove("demo.db")
Then, we can load the MNIST data using scikit-learn. To make sure we display them correctly, we’ll also define a
pre-processing function that reshapes the data:
[2]: from sklearn.datasets import load_digits
import numpy as np
digits = load_digits().data
(continues on next page)
18 Chapter 4. Scaling labelling and active learningsuperintendent, Release 0.5.2
(continued from previous page)
def display_preprocessing(x):
return x.reshape(8, 8)
To create a “distributed” superintendent widget, all we have to do is import it from the distributed submodule,
and pass a database connection string:
[3]: from superintendent.distributed import ClassLabeller
widget = ClassLabeller.from_images(
connection_string="sqlite:///demo.db",
options=range(10),
canvas_size=(200, 200),
display_preprocess=display_preprocessing
)
We can then add data to the database. Because every widget connects to the DB, we should only run this code once:
[4]: widget.add_features(digits[:1000, :])
We can then start labelling data:
[5]: widget
VBox(children=(HBox(children=(FloatProgress(value=0.0, description='Progress:', max=1.
˓→0),)), Box(children=(Out...
You can inspect by using the widget.queue attribute, which encapsulates the database connection and the methods
for retrieving and submitting data.
[6]: with widget.queue.session() as session:
print(session.query(widget.queue.data).count())
1000
[7]: from pprint import pprint
with widget.queue.session() as session:
pprint(session.query(widget.queue.data).first().__dict__)
{'_sa_instance_state': ,
'completed_at': datetime.datetime(2020, 1, 13, 10, 18, 13, 547383),
'id': 1,
'input': '{"__type__": "__np.ndarray__", "__content__": [0.0, 0.0, 5.0, 13.0, '
'9.0, 1.0, 0.0, 0.0, 0.0, 0.0, 13.0, 15.0, 10.0, 15.0, 5.0, 0.0, '
'0.0, 3.0, 15.0, 2.0, 0.0, 11.0, 8.0, 0.0, 0.0, 4.0, 12.0, 0.0, 0.0, '
'8.0, 8.0, 0.0, 0.0, 5.0, 8.0, 0.0, 0.0, 9.0, 8.0, 0.0, 0.0, 4.0, '
'11.0, 0.0, 1.0, 12.0, 7.0, 0.0, 0.0, 2.0, 14.0, 5.0, 10.0, 12.0, '
'0.0, 0.0, 0.0, 0.0, 6.0, 13.0, 10.0, 0.0, 0.0, 0.0]}',
'inserted_at': datetime.datetime(2020, 1, 13, 10, 18, 9, 677772),
'output': '"0"',
'popped_at': datetime.datetime(2020, 1, 13, 10, 18, 9, 809329),
'priority': None,
'worker_id': None}
As you can see, superintendent added our entries into the database. The format of this row is not necessarily
important, as you can retrieve the data needed using superintendent itself - this will convert it back to python
4.1. Distributing the labelling of images across people 19superintendent, Release 0.5.2
objects.
For your information, data is serialised as JSON, with custom JSON encoders for numeric data such as numpy arrays
or pandas objects.
4.2 Retrieving data from the distributed widget
Any superintendent connected to the database can retrieve the labels using widget.new_labels:
[8]: pprint(widget.new_labels[:30])
['0',
'1',
'2',
'3',
'4',
'5',
'6',
'7',
'8',
'9',
'0',
'1',
None,
None,
None,
None,
None,
None,
None,
None,
None,
None,
None,
None,
None,
None,
None,
None,
None,
None]
4.3 Doing active learning during distributed labelling
One of the great benefits of using the distributed submodule is that you can perform active learning, where the labelling
of data and the training of the active learning model are split across different machines. You can achieve this by creating
a widget object that you don’t intend to use for labelling - only for orchestration of labelling by others:
[11]: from sklearn.linear_model import LogisticRegression
model = LogisticRegression(
multi_class='auto',
solver='lbfgs',
max_iter=5000
(continues on next page)
20 Chapter 4. Scaling labelling and active learningsuperintendent, Release 0.5.2
(continued from previous page)
)
widget = ClassLabeller(
connection_string="sqlite:///demo.db",
model=model,
acquisition_function='margin'
)
Note: By default, the orchestration runs forever. You might not want this - for example, you might be interested in
running the orchestration using cron scheduling. You can do that the way I am doing it below: by passing None as
the interval_seconds keyword argument.
In either case, the orchestration is best run from a python script from the command line, rather than from a jupyter
notebook.
[12]: widget.orchestrate(interval_seconds=None)
/Users/jan/personal-projects/oss/superintendent/.venv/lib/python3.7/site-packages/
˓→sklearn/model_selection/_split.py:667: UserWarning: The least populated class in y
˓→has only 2 members, which is less than n_splits=3.
% (min_groups, self.n_splits)), UserWarning)
Score: 0.853
Note: This page will display what superintendent widgets look like, but not respond to user input (as it’s not connected
to a backend).
4.3. Doing active learning during distributed labelling 21superintendent, Release 0.5.2 22 Chapter 4. Scaling labelling and active learning
CHAPTER

                                                                                                                       FIVE

                                             ELEMENTS OF A SUPERINTENDENT WIDGET

    The labelling widgets that superintendent supplies are fairly complex and have many components, but at the top level,
    they are fairly modular and it is relatively easy to make your own.
    The superintendent.Labeller class, from which all labelling widgets inherit, contains four elements:
       1. The input widget
       2. The display area
       3. The progress bar / retraining widgets
       4. The data queue
    Only the first three are visible, and I’ll just highlight them here:

[1]: from superintendent import MultiClassLabeller

    widget = MultiClassLabeller(
        features=["data point 1", "data point 2", "data point 3"],
        options=["option 1", "option 2"],
    )

    widget.input_widget.layout.border = "4px solid green"
    widget.feature_display.layout.border = "4px solid yellow"
    widget.top_bar.layout.border = "4px solid orange"

    widget
    MultiClassLabeller(children=(HBox(children=(FloatProgress(value=0.0, description=
     ˓→'Progress:', max=1.0),), layo...

    The input_widget is in fact an argument to superintendent.Labeller.
    superintendent.MultiClassLabeller does little more than pass the superintendent.controls.
    MulticlassSubmitter widget as the input widget.
    Therefore, if you want to customise the labelling process, you can do so. In fact, this is deliberately designed like this
    because I wanted to develop input widgets in separate, standalone packages separate to superintendent.
    One such widget is ipyannotations.PolygonAnnotator.
    So, to create a superintendent labelling tool, all I need to do is pass this new input widget as an argument.
    In this case, I will start by loading an instagram picture, taken at the VDNKh in Moscow:

[2]: from ipyannotations import PointAnnotator
     from superintendent import Labeller

                                                                                                         (continues on next page)

                                                                                                                             23
superintendent, Release 0.5.2
(continued from previous page)
input_widget = PointAnnotator(options=["pigeon"])
labeller = Labeller(
features=["img/vdnkh.jpg"] * 2,
input_widget=input_widget,
display_func=input_widget.display
)
labeller
Labeller(children=(HBox(children=(FloatProgress(value=0.0, description='Progress:',
˓→max=1.0),)), Box(children=...
The data that superintendent stores for you is defined by the input widget, and since we are creating rich data
annotations here, each label is in fact a list of point annotations:
[4]: labeller.new_labels
[4]: [[{'type': 'point', 'label': 'pigeon', 'coordinates': (142, 264)},
{'type': 'point', 'label': 'pigeon', 'coordinates': (237, 284)},
{'type': 'point', 'label': 'pigeon', 'coordinates': (243, 374)},
{'type': 'point', 'label': 'pigeon', 'coordinates': (374, 262)},
{'type': 'point', 'label': 'pigeon', 'coordinates': (451, 266)},
{'type': 'point', 'label': 'pigeon', 'coordinates': (388, 303)},
{'type': 'point', 'label': 'pigeon', 'coordinates': (340, 377)},
{'type': 'point', 'label': 'pigeon', 'coordinates': (518, 235)}],
None]
Let’s unpack this a bit.
We’ve created an input widget: ipyannotations.PolygonAnnotator. The only requirements on this widget
is that it implements the following 3 methods:
on_submit, on_undo, on_skip. These methods are used to register superintendent’s functionality as the thing
that will happen when people click on the different buttons and widgets.
Also, usually the argument to display_func needs to be “just” a function, such as IPython.display.
display. However, in this case, the input actually happens on the image. It’s very easy to solve this: the input
widget has a display method, which displays an image inside the input widget; which is completely OK.
What this means is that we are very flexible when it comes to how we compose our labelling widget.
The default options for single-/multi-class labelling are helpful, but aren’t helpful if we want more information about
any given data point. By simply devising our own input widget, which complies with superintendent interfaces -
on_submit, on_undo, on_skip - we can still take advantage of superintendent’s active learning and distribution
/ orchestration functionality.
24 Chapter 5. Elements of a superintendent widgetCHAPTER
SIX
API REFERENCE
6.1 Data labelling widgets
class superintendent.ClassLabeller(*, features=None, labels=None, options=(), al-
low_freetext=True, hints=None, display_func='default',
model=None, eval_method=None, acqui-
sition_function=None, shuffle_prop=0.1,
model_preprocess=None, display_preprocess=None)
A widget for labelling your data.
This class is designed to label data for (semi-)supervised learning algorithms. It allows you to label data. In the
future, it will also allow you to re-train an algorithm.
add_features(features, labels=None)
Add data to the widget.
This adds the data provided to the queue of data to be labelled. You Can optionally provide labels for each
data point.
Parameters
• features (Any) – The data you’d like to add to the labelling widget.
• labels (Any, optional) – The labels for the data you’re adding; if you have labels.
classmethod from_images(*, canvas_size=(500, 500), **kwargs)
Generate a labelling widget from images.
This is a convenience function that creates a widget with an image display function. All other arguments
for creating this widget need to be passed.
Parameters canvas_size (tuple) – The width / height that the image will be fit into. By
default 500 by 500.
retrain(button=None)
Re-train the classifier you passed when creating this widget.
This calls the fit method of your class with the data that you’ve labelled. It will also score the classifier and
display the performance.
Parameters button (widget.Widget, optional) – Optional & ignored; this is passed
when invoked by a button.
25superintendent, Release 0.5.2
class superintendent.MultiClassLabeller(features=None, labels=None, options=(),
allow_freetext=True, hints=None, dis-
play_func='default', model=None,
eval_method=None, acquisition_function=None,
shuffle_prop=0.1, model_preprocess=None,
display_preprocess=None)
A widget for labelling your data.
This class is designed to label data for (semi-)supervised learning algorithms. It allows you to label data. In the
future, it will also allow you to re-train an algorithm.
add_features(features, labels=None)
Add data to the widget.
This adds the data provided to the queue of data to be labelled. You Can optionally provide labels for each
data point.
Parameters
• features (Any) – The data you’d like to add to the labelling widget.
• labels (Any, optional) – The labels for the data you’re adding; if you have labels.
classmethod from_images(*, canvas_size=(500, 500), **kwargs)
Generate a labelling widget from images.
This is a convenience function that creates a widget with an image display function. All other arguments
for creating this widget need to be passed.
Parameters canvas_size (tuple) – The width / height that the image will be fit into. By
default 500 by 500.
retrain(button=None)
Re-train the classifier you passed when creating this widget.
This calls the fit method of your class with the data that you’ve labelled. It will also score the classifier and
display the performance.
Parameters button (widget.Widget, optional) – Optional & ignored; this is passed
when invoked by a button.
6.2 Distributed data labelling widgets
class superintendent.distributed.ClassLabeller(*, connec-
tion_string='sqlite:///:memory:',
worker_id=False, ta-
ble_name='superintendent', **kwargs)
A class for labelling your data.
This class is designed to label data for (semi-)supervised learning algorithms. It allows you to label data. In the
future, it will also allow you to re-train an algorithm.
Parameters
• connection_string (str) – A SQLAlchemy-compatible database connection string.
This is where the data for this widget will be stored, and where it will be retrieved from for
labelling.
• features (list, np.ndarray, pd.Series, pd.DataFrame, optional)
– An array or sequence of data in which each element (if 1D) or each row (if 2D) represents
one data point for which you’d like to generate labels.
26 Chapter 6. API Referencesuperintendent, Release 0.5.2
• labels (list, np.ndarray, pd.Series, pd.DataFrame, optional) –
If you already have some labels, but would like to re-label some, then you can pass these in
as labels.
• worker_id (bool, str) – Whether or not to prompt for a worker_id (if it’s boolean),
or a specific worker_id for this widget (if it’s a string). The default is False, which means
worker_id will not be recorded at all.
• table_name (str) – The name for the table in the SQL database. If the table doesn’t
exist, it will be created.
• options (tuple, list) – The options presented for labelling.
• classifier (sklearn.base.ClassifierMixin, optional) – An object that
implements the standard sklearn fit/predict methods. If provided, a button for retraining the
model is shown, and the model performance under k-fold crossvalidation can be read as you
go along.
• display_func (callable, optional) – A function that will be used to display the
data. This function should take in two arguments, first the data to display, and second the
number of data points to display (set to 1 for this class).
• eval_method (callable, optional) – A function that accepts the classifier, fea-
tures, and labels as input and returns a dictionary of values that contain the key ‘test_score’.
The default is sklearn.model_selection.cross_validate, with cv=3. Use functools.partial to
create a function with its parameters fixed.
• reorder (str, callable, optional) – One of the reordering algorithms specified
in superintendent.prioritisation. This describes a function that receives input
in the shape of n_samples, n_labels and calculates the priority in terms of information value
in labelling a data point.
• shuffle_prop (float) – The proportion of points that are shuffled when the data points
are re-ordered (see reorder keyword-argument). This controls the “exploration vs exploita-
tion” trade-off - the higher, the more you explore the feature space randomly, the lower, the
more you exploit your current weak points.
• keyboard_shortcuts (bool, optional) – If you want to enable ipyevent-
mediated keyboard capture to use the keyboard rather than the mouse to submit data.
add_features(features, labels=None)
Add data to the widget.
This adds the data provided to the queue of data to be labelled. You Can optionally provide labels for each
data point.
Parameters
• features (Any) – The data you’d like to add to the labelling widget.
• labels (Any, optional) – The labels for the data you’re adding; if you have labels.
classmethod from_images(*, canvas_size=(500, 500), **kwargs)
Generate a labelling widget from images.
This is a convenience function that creates a widget with an image display function. All other arguments
for creating this widget need to be passed.
Parameters canvas_size (tuple) – The width / height that the image will be fit into. By
default 500 by 500.
6.2. Distributed data labelling widgets 27superintendent, Release 0.5.2
orchestrate(interval_seconds: Optional[float] = None, interval_n_labels: int = 0, shuffle_prop:
float = 0.1, max_runs: float = inf )
Orchestrate the active learning process.
This method can either re-train the classifier and re-order the data once, or it can run a never-ending loop
to re-train the model at regular intervals, both in time and in the size of labelled data.
Parameters
• interval_seconds (int, optional) – How often the retraining should occur, in
seconds. If this is None, the retraining only happens once, then returns (this is suitable) if
you want the retraining schedule to be maintained e.g. by a cron job). The default is 60
seconds.
• interval_n_labels (int, optional) – How many new data points need to have
been labelled in between runs in order for the re-training to occur.
• shuffle_prop (float) – What proportion of the data should be randomly sampled
on each re- training run.
• max_runs (float, int) – How many orchestration runs to do at most. By default
infinite.
Returns
Return type None
retrain(button=None)
Re-train the classifier you passed when creating this widget.
This calls the fit method of your class with the data that you’ve labelled. It will also score the classifier and
display the performance.
Parameters button (widget.Widget, optional) – Optional & ignored; this is passed
when invoked by a button.
class superintendent.distributed.MultiClassLabeller(*, connec-
tion_string='sqlite:///:memory:',
worker_id=False, ta-
ble_name='superintendent',
**kwargs)
A class for labelling your data.
This class is designed to label data for (semi-)supervised learning algorithms. It allows you to label data. In the
future, it will also allow you to re-train an algorithm.
Parameters
• connection_string (str) – A SQLAlchemy-compatible database connection string.
This is where the data for this widget will be stored, and where it will be retrieved from for
labelling.
• features (list, np.ndarray, pd.Series, pd.DataFrame, optional)
– An array or sequence of data in which each element (if 1D) or each row (if 2D) represents
one data point for which you’d like to generate labels.
• labels (list, np.ndarray, pd.Series, pd.DataFrame, optional) –
If you already have some labels, but would like to re-label some, then you can pass these in
as labels.
• options (tuple, list) – The options presented for labelling.
• classifier (sklearn.base.ClassifierMixin, optional) – An object that
implements the standard sklearn fit/predict methods. If provided, a button for retraining the
28 Chapter 6. API Referencesuperintendent, Release 0.5.2
model is shown, and the model performance under k-fold crossvalidation can be read as you
go along.
• display_func (callable, optional) – A function that will be used to display the
data. This function should take in two arguments, first the data to display, and second the
number of data points to display (set to 1 for this class).
• eval_method (callable, optional) – A function that accepts the classifier, fea-
tures, and labels as input and returns a dictionary of values that contain the key ‘test_score’.
The default is sklearn.model_selection.cross_validate, with cv=3. Use functools.partial to
create a function with its parameters fixed.
• reorder (str, callable, optional) – One of the reordering algorithms specified
in superintendent.prioritisation. This describes a function that receives input
in the shape of n_samples, n_labels and calculates the priority in terms of information value
in labelling a data point.
• shuffle_prop (float) – The proportion of points that are shuffled when the data points
are re-ordered (see reorder keyword-argument). This controls the “exploration vs exploita-
tion” trade-off - the higher, the more you explore the feature space randomly, the lower, the
more you exploit your current weak points.
• keyboard_shortcuts (bool, optional) – If you want to enable ipyevent-
mediated keyboard capture to use the keyboard rather than the mouse to submit data.
add_features(features, labels=None)
Add data to the widget.
This adds the data provided to the queue of data to be labelled. You Can optionally provide labels for each
data point.
Parameters
• features (Any) – The data you’d like to add to the labelling widget.
• labels (Any, optional) – The labels for the data you’re adding; if you have labels.
classmethod from_images(*, canvas_size=(500, 500), **kwargs)
Generate a labelling widget from images.
This is a convenience function that creates a widget with an image display function. All other arguments
for creating this widget need to be passed.
Parameters canvas_size (tuple) – The width / height that the image will be fit into. By
default 500 by 500.
orchestrate(interval_seconds: Optional[float] = None, interval_n_labels: int = 0, shuffle_prop:
float = 0.1, max_runs: float = inf )
Orchestrate the active learning process.
This method can either re-train the classifier and re-order the data once, or it can run a never-ending loop
to re-train the model at regular intervals, both in time and in the size of labelled data.
Parameters
• interval_seconds (int, optional) – How often the retraining should occur, in
seconds. If this is None, the retraining only happens once, then returns (this is suitable) if
you want the retraining schedule to be maintained e.g. by a cron job). The default is 60
seconds.
• interval_n_labels (int, optional) – How many new data points need to have
been labelled in between runs in order for the re-training to occur.
6.2. Distributed data labelling widgets 29superintendent, Release 0.5.2
• shuffle_prop (float) – What proportion of the data should be randomly sampled
on each re- training run.
• max_runs (float, int) – How many orchestration runs to do at most. By default
infinite.
Returns
Return type None
retrain(button=None)
Re-train the classifier you passed when creating this widget.
This calls the fit method of your class with the data that you’ve labelled. It will also score the classifier and
display the performance.
Parameters button (widget.Widget, optional) – Optional & ignored; this is passed
when invoked by a button.
6.3 Active learning functions
superintendent.acquisition_functions.entropy(probabilities: numpy.ndarray) →
numpy.ndarray
Sort by the entropy of the probabilities (high to low).
Parameters probabilities (np.ndarray) – An array of probabilities, with the shape
n_samples, n_classes
Other Parameters shuffle_prop (float (default=0.1)) – The proportion of data points that should be
randomly shuffled. This means the sorting retains some randomness, to avoid biasing your new
labels and catching any minority classes the algorithm currently classifies as a different label.
superintendent.acquisition_functions.margin(probabilities: numpy.ndarray) →
numpy.ndarray
Sort by the margin between the top two predictions (low to high).
Parameters probabilities (np.ndarray) – An array of probabilities, with the shape
n_samples, n_classes
Other Parameters shuffle_prop (float) – The proportion of data points that should be randomly
shuffled. This means the sorting retains some randomness, to avoid biasing your new labels and
catching any minority classes the algorithm currently classifies as a different label.
superintendent.acquisition_functions.certainty(probabilities: numpy.ndarray)
Sort by the certainty of the maximum prediction.
Parameters probabilities (np.ndarray) – An array of probabilities, with the shape
n_samples, n_classes
Other Parameters shuffle_prop (float) – The proportion of data points that should be randomly
shuffled. This means the sorting retains some randomness, to avoid biasing your new labels and
catching any minority classes the algorithm currently classifies as a different label.
30 Chapter 6. API ReferenceCHAPTER
SEVEN
EXAMPLES
These examples showcase how superintendent can work for you.
Note: This page will display what superintendent widgets look like, but not respond to user input (as it’s not connected
to a backend).
7.1 Labelling text
Let’s assume we have a text dataset that contains some labelled sentences and some unlabelled sentences. For example,
we could get the headlines for a bunch of UK news websites (the code for this comes from the great github project
compare-headlines by isobelweinberg):
[1]: import requests
from bs4 import BeautifulSoup
import datetime
headlines = []
labels = []
r = requests.get('https://www.theguardian.com/uk').text #get html
soup = BeautifulSoup(r, 'html5lib') #run html through beautiful soup
headlines += [headline.text for headline in
soup.find_all('span', class_='js-headline-text')][:10]
labels += ['guardian'] * (len(headlines) - len(labels))
soup = BeautifulSoup(requests.get('http://www.dailymail.co.uk/home/index.html').text,
˓→'html5lib')
headlines += [headline.text.replace('\n', '').replace('\xa0', '').strip()
for headline in soup.find_all(class_="linkro-darkred")][:10]
labels += ['daily mail'] * (len(headlines) - len(labels))
[2]: from superintendent import ClassLabeller
import pandas as pd
from IPython import display
labelling_widget = ClassLabeller(
features=headlines,
display_func=lambda x: display.display(display.Markdown("# " + x)),
options=['professional', 'not professional'],
(continues on next page)
31superintendent, Release 0.5.2
(continued from previous page)
)
labelling_widget
VBox(children=(HBox(children=(FloatProgress(value=0.0, description='Progress:', max=1.
˓→0),)), Box(children=(Out...
Note: This page will display what superintendent widgets look like, but not respond to user input (as it’s not connected
to a backend).
7.2 Labelling images with superintendent
Since labelling images is a frequent use case, there is a special factory method for labelling images that are stored in
numpy arrays:
[1]: from sklearn.datasets import load_digits
from superintendent import ClassLabeller
import numpy as np
digits = load_digits().data.reshape(-1, 8, 8)
[3]: widget = ClassLabeller.from_images(
features=digits[:100, ...],
canvas_size=(200, 200),
options=range(10)
)
widget
VBox(children=(HBox(children=(FloatProgress(value=0.0, description='Progress:', max=1.
˓→0),)), Box(children=(Out...
Note: This page will display what superintendent widgets look like, but not respond to user input (as it’s not connected
to a backend).
7.3 Labelling images with active learning
Often, we have a rough idea of an algorithm that might do well on a given task, even if we don’t have any labels at all.
For example, I know that for a simple image set like MNIST, logistic regression actually does surprisingly well.
In this case, we want to do two things: 1. We want to keep track of our algorithm’s performance 2. We want to leverage
our algorithm’s predictions to decide what data point to label.
Both of these things can be done with superintendent. For point one, all we need to do is pass an object that conforms
to the fit / predict syntax of sklearn as the classifier keyword argument.
For the second point, we can choose any function that takes in probabilities of labels (in shape n_samples,
n_classes), sorts them, and returns the sorted integer index from most in need of labelling to least in need of
32 Chapter 7. Examplessuperintendent, Release 0.5.2
labelling. Superintendent provides some functions, described in the superintendent.prioritisation sub-
module, that can achieve this. One of these is the entropy function, which calculates the entropy of predicted
probabilities and prioritises high-entropy samples.
As an example:
[1]: from sklearn.linear_model import LogisticRegression
from sklearn.datasets import load_digits
from superintendent import ClassLabeller
digits = load_digits()
data_labeller = ClassLabeller.from_images(
canvas_size=(200, 200),
features=digits.data[:500, :],
model=LogisticRegression(solver="lbfgs", multi_class="multinomial", max_
˓→iter=5000),
options=range(10),
acquisition_function='entropy',
display_preprocess=lambda x: x.reshape(8, 8)
)
data_labeller
VBox(children=(HBox(children=(HBox(children=(FloatProgress(value=0.0, description=
˓→'Progress:', max=1.0),), lay...
Note: This page will display what superintendent widgets look like, but not respond to user input (as it’s not connected
to a backend).
7.4 Preprocessing data before passing it to the model
In general, you will often want to pass different parts of your data to your display function and your model. In general,
superintendent does not provide “pre-model” hooks. Instead, any pre-processing that is specific to your model or your
display function, can be specified in the display_func, or in a scikit-learn Pipeline object.
For example, imagine you have a pandas dataframe of emails, which contains some metadata that you would like to
display during labelling. However, you want to build a model that is agnostic to that information.
7.4.1 Data
First, let’s create some dummy data:
[1]: import random
import string
import pandas as pd
n_rows = 50
example_emails = [
"Hi John,\nthis is just to say nice work yesterday.\nBest,\nJim",
"Hi Mike,\nthis is just to say terrible work yesterday.\nBest,\nJim",
]
(continues on next page)
7.4. Preprocessing data before passing it to the model 33superintendent, Release 0.5.2
(continued from previous page)
example_recipients = ["John", "Mike"]
example_timestamps = ["2018-02-01 15:00", "2018-02-01 15:03"]
example_df = pd.DataFrame({
'email': example_emails,
'recipient': example_recipients,
'timestamp': example_timestamps
})
display(example_df)
email recipient \
0 Hi John,\nthis is just to say nice work yester... John
1 Hi Mike,\nthis is just to say terrible work ye... Mike
timestamp
0 2018-02-01 15:00
1 2018-02-01 15:03
7.4.2 Display function
In the display function, we’ll re-format the data.
[2]: from IPython.display import display, Markdown
def display_email(row):
"""
The display function gets passed your data - in the
case of a dataframe, it gets passed a row - and then
has to "display" your data in whatever way you want.
It doesn't need to return anything
"""
display(Markdown("**To:** " + row["recipient"]))
display(Markdown("**At:** " + row["timestamp"]))
display(Markdown(row["email"].replace("\n", "\n\n")))
7.4.3 Model Pipeline
We only want to pass the E-Mail text to our model, and to achieve this we can write a small pre-processing function
that is applied to both the features and labels whenever a model is fit.
We then can write a model that uses scikit-learn’s feature-vectorizer and applies a logistic regression.
[3]: from sklearn.feature_extraction.text import TfidfVectorizer
from sklearn.base import TransformerMixin
from sklearn.linear_model import LogisticRegression
from sklearn.pipeline import Pipeline
def preprocessor(x, y):
# only take Email column, leave everything else
(continues on next page)
34 Chapter 7. Examplessuperintendent, Release 0.5.2
(continued from previous page)
return x["email"], y
model = Pipeline([
('tfidf_vectorizer', TfidfVectorizer()),
('logistic_regression', LogisticRegression())
])
7.4.4 The widget
Now that we have assembled the necessary components, we can create our widget:
[4]: from superintendent import ClassLabeller
widget = ClassLabeller(
features=example_df,
model=model,
model_preprocess=preprocessor,
display_func=display_email,
options=['positive', 'negative'],
acquisition_function='margin'
)
widget
VBox(children=(HBox(children=(HBox(children=(FloatProgress(value=0.0, description=
˓→'Progress:', max=1.0),), lay...
7.5 Using docker-compose to serve a superintendent interface to
many users
The documentation already shows how distributed labelling using a SQL database to distribute the data can be used
pretty effectively (see Scaling labelling and active learning).
However, setting up a database can be difficult; and although even for hundreds of labellers even a small database
instance would suffice, there will be some costs associated with it in the cloud.
However, more and more organisations have docker running on a server; and even if your organisation does not have
their own hardware or runs docker in the cloud, all of the popular cloud providers offer docker (and, in particular,
docker-compose) as a service.
This means it becomes relatively easy for you to manage a database as a back-end, a jupyter server as a front-end, and
a model-training server to support active learning.
7.5. Using docker-compose to serve a superintendent interface to many users 35superintendent, Release 0.5.2
7.5.1 docker-compose
Docker-compose allows you to specify “multi-container” (i.e. multi-machine) applications that you can then all start
and stop at the same time.
You should make sure you have docker and docker-compose installed before continuing.
Here, we are going to start four machines, and the configuration file will look like this:
version: '3.1'
services:
db:
image: postgres
restart: always
environment: &environment
POSTGRES_USER: superintendent
POSTGRES_PASSWORD: superintendent
POSTGRES_DB: labelling
volumes:
- ./postgres-data:/var/lib/postgresql/data
ports:
- 5432:5432
adminer:
image: adminer
restart: always
ports:
- 8080:8080
orchestrator:
build:
context: .
dockerfile: tensorflow.Dockerfile
restart: always
depends_on:
- "db"
environment: *environment
entrypoint: python /app/orchestrate.py
volumes:
- ./orchestrate.py:/app/orchestrate.py
notebook:
build:
context: .
dockerfile: voila.Dockerfile
restart: always
depends_on:
- "db"
environment: *environment
volumes:
- ./voila-interface.ipynb:/home/anaconda/app/app.ipynb
ports:
- 8866:8866
Let’s go through each item.
• db
36 Chapter 7. Examplessuperintendent, Release 0.5.2
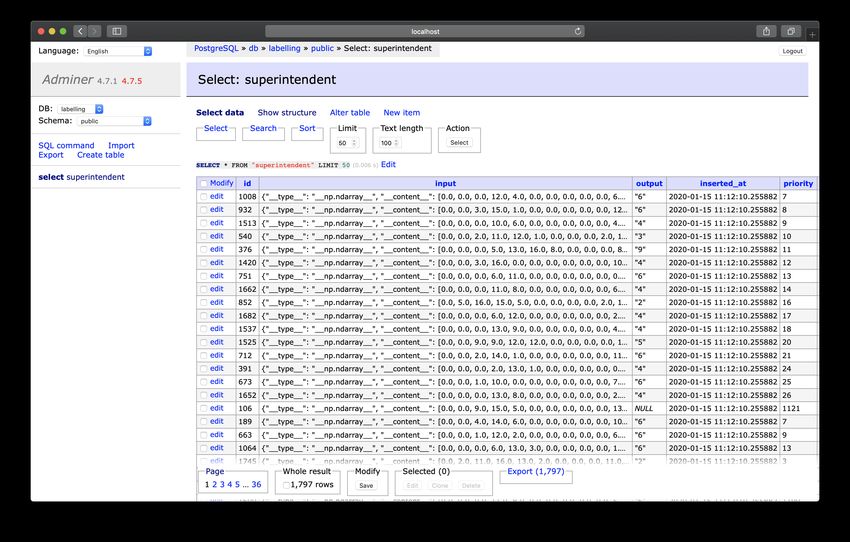
The database server. This will use an official (PostgreSQL)[https://www.postgresql.org/] docker image. You
can see that we are providing a “volume”, meaning all the data inside the database is stored in the directory
./postgres-data.
Note: The username / password here are just as examples; and you should use some randomly generated strings
for safety.
• adminer
this is purely to be able to have a graphical interface to the database.
• notebook:
This is the server that will actually server our notebook as a website. It uses an image called voila - which
actually doesn’t exist yet; we will create that soon.
Note that we’re placing a notebook into the home folder; this means the container will know what to serve
Note also that we’re giving this server the same environment variables as the databse server (which we captures
using &environment)
• orchestrator
This server will run an orchestration script (which we are mounting as a volume) that will re-train and re-order
the data in the database.
7.5.2 The notebook (our webapp)
To make superintendent read from the database and display the images (we’ll be using MNIST again. . . ), we need one
notebook with the following content:
./voila-interface.ipynb
import os
from superintendent.distributed import ClassLabeller
user = os.getenv('POSTGRES_USER', "superintendent")
pw = os.getenv('POSTGRES_PASSWORD', "superintendent")
db_name = os.getenv('POSTGRES_DB', "labelling")
db_string = f"postgresql+psycopg2://{user}:{pw}@db:5432/{db_name}"
widget = ClassLabeller.from_images(
canvas_size=(200, 200),
connection_string=db_string,
options=range(10),
display_preprocess=lambda x: x.reshape(8, 8),
)
widget
7.5. Using docker-compose to serve a superintendent interface to many users 37You can also read