A slice classification model-facilitated 3D encoder-decoder network for segmenting organs at risk in head and neck cancer
←
→
Page content transcription
If your browser does not render page correctly, please read the page content below
Journal of Radiation Research, Vol. 62, No. 1, 2021, pp. 94–103
        doi: 10.1093/jrr/rraa094
        Advance Access Publication: 8 October 2020

                A slice classification model-facilitated 3D
            encoder–decoder network for segmenting organs at
                       risk in head and neck cancer
             Shuming Zhang1 , Hao Wang1 , Suqing Tian1 , Xuyang Zhang1,4 , Jiaqi Li1,5 ,
           Runhong Lei1 , Mingze Gao2 , Chunlei Liu2 , Li Yang2 , Xinfang Bi2 , Linlin Zhu2 ,

                                                                                                                                                                              Downloaded from https://academic.oup.com/jrr/article/62/1/94/5917392 by guest on 23 March 2021
                            Senhua Zhu2 , Ting Xu3 and Ruijie Yang1, *
                                                 1 Department of Radiation Oncology, Peking University Third Hospital, Beijing, China
                                                               2 Beijing Linking Medical Technology Co., Ltd, Beijing, China
                               3 Institute of Science and Technology Development, Beijing University of Posts and Telecommunications, Beijing, China
                                                    4 Cancer Center, Beijing Luhe Hospital, Capital Medical University, Beijing, China
                                          5 Department of Emergency, Beijing Children’s Hospital, Capital Medical University, Beijing, China

          *Corresponding author. Department of Radiation Oncology, Peking University Third Hospital, 49 North Garden Road, Haidian District, Beijing, 100191, P R
                                           China. Tel: +86-010-82264926; Fax: 86-01-62017700; Email: ruijyang@yahoo.com
                                          (Received 5 March 2020; revised 30 May 2020; editorial decision 6 September 2020)

                                                                                       ABSTRACT
                     For deep learning networks used to segment organs at risk (OARs) in head and neck (H&N) cancers, the class-
                     imbalance problem between small volume OARs and whole computed tomography (CT) images results in delin-
                     eation with serious false-positives on irrelevant slices and unnecessary time-consuming calculations. To alleviate this
                     problem, a slice classification model-facilitated 3D encoder–decoder network was developed and validated. In the
                     developed two-step segmentation model, a slice classification model was firstly utilized to classify CT slices into six
                     categories in the craniocaudal direction. Then the target categories for different OARs were pushed to the different
                     3D encoder–decoder segmentation networks, respectively. All the patients were divided into training (n = 120),
                     validation (n = 30) and testing (n = 20) datasets. The average accuracy of the slice classification model was 95.99%.
                     The Dice similarity coefficient and 95% Hausdorff distance, respectively, for each OAR were as follows: right eye
                     (0.88 ± 0.03 and 1.57 ± 0.92 mm), left eye (0.89 ± 0.03 and 1.35 ± 0.43 mm), right optic nerve (0.72 ± 0.09 and
                     1.79 ± 1.01 mm), left optic nerve (0.73 ± 0.09 and 1.60 ± 0.71 mm), brainstem (0.87 ± 0.04 and 2.28 ± 0.99 mm),
                     right temporal lobe (0.81 ± 0.12 and 3.28 ± 2.27 mm), left temporal lobe (0.82 ± 0.09 and 3.73 ± 2.08 mm),
                     right temporomandibular joint (0.70 ± 0.13 and 1.79 ± 0.79 mm), left temporomandibular joint (0.70 ± 0.16 and
                     1.98 ± 1.48 mm), mandible (0.89 ± 0.02 and 1.66 ± 0.51 mm), right parotid (0.77 ± 0.07 and 7.30 ± 4.19 mm) and
                     left parotid (0.71 ± 0.12 and 8.41 ± 4.84 mm). The total segmentation time was 40.13 s. The 3D encoder–decoder
                     network facilitated by the slice classification model demonstrated superior performance in accuracy and efficiency in
                     segmenting OARs in H&N CT images. This may significantly reduce the workload for radiation oncologists.
                     Keywords: automatic segmentation; deep learning; head and neck; organs at risk; radiotherapy

                                     INTRODUCTION                                                  OARs in radiotherapy [2]. However, OARs segmentation, which is
        During the rapid development of radiotherapy technology in the last                        usually performed manually by radiation oncologists, is tedious and
        decades, high precision radiotherapy techniques such as intensity-                         time-consuming [3]. Moreover, the accuracy of manual segmentation
        modulated radiation therapy (IMRT) and volumetric modulated                                is highly dependent on the knowledge and experience of the radiation
        arc therapy (VMAT) have been widely used in head and neck                                  oncologists [4], and there exists remarkable inter-observer variation
        (H&N) cancer [1]. Accurate organs at risk (OARs) segmentation                              for manual segmentation [5]. So, it is necessary and pressing to develop
        is a prerequisite to precisely delivering dose to the tumor while sparing                  an auto-segmentation model for OARs delineation.

© The Author(s) 2020. Published by Oxford University Press on behalf of The Japanese Radiation Research Society and Japanese Society for Radiation Oncology.
This is an Open Access article distributed under the terms of the Creative Commons Attribution Non-Commercial License (http://creativecommons.org/licenses/by-
nc/4.0/), which permits non-commercial re-use, distribution, and reproduction in any medium, provided the original work is properly cited. For commercial re-use,
please contact journals.permissions@oup.com

                                                                                                                                                                    • 94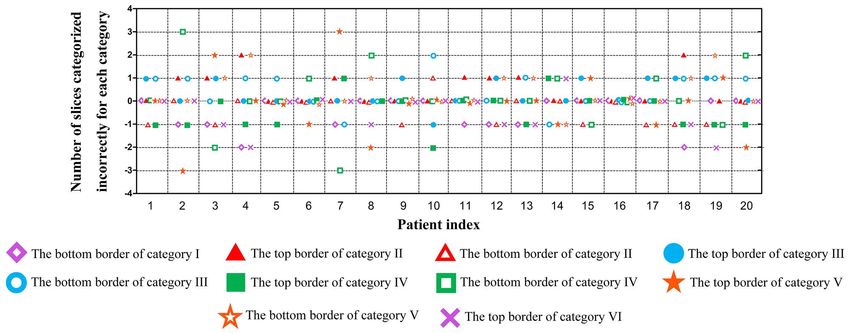
Auto-segmentation of OARs using two-step approachS. • 95

    Auto-segmentation models based on deep learning have developed           170 patients with all the above OARs that were intact and not invaded
rapidly in recent years [6, 7]. Ibragimov and Xing [8] used convolu-         by the primary tumor or metastatic lymph nodes were included
tional neural networks (CNN) for the segmentation of OARs in H&N             in this study (brain metastases: 46, nasopharyngeal carcinoma: 40,
CT images. They used the Dice similarity coefficient (DSC) to evaluate       lymphoma: 18, laryngeal carcinoma: 15, hypopharyngeal carcinoma:
the segmentation result. They found that DSC was superior for the            9, tongue cancer: 4, maxillary sinus carcinoma: 4, other H&N cancer:
OARs with a large volume (e.g. mandible: 0.895) while it was inferior        34). All patients were immobilized with a thermoplastic mask in
for the OARs with a small volume (e.g. left optic nerve: 0.639 and right     the supine position and scanned from cranium to clavicle on a
optic nerve: 0.645). To improve the segmentation accuracy of small           CT simulator (Brilliance Big Bore, Philips Medical Systems). Both
volume OARs, Tong et al. [9] proposed a shape representation model           enhanced and unenhanced CT images were scanned. The CT images
to learn the shape representation of OARs, which could constrain             were axially reconstructed, and the scan matrix was 512 × 512. The
the results of fully convolutional neural networks (FCNN). However,          resolution of all axial plane images was between 0.69 and 1.34 mm,
though their results demonstrated that the shape representation model        and the slice thickness varied between 1.5 and 3.0 mm. Magnetic
improved the segmentation accuracy for all OARs, the accuracy of             Resonance images were also acquired to assist manual segmentation.
optic nerves were still dissatisfactory (left optic nerve: 0.653 and right

                                                                                                                                                         Downloaded from https://academic.oup.com/jrr/article/62/1/94/5917392 by guest on 23 March 2021
optic nerve: 0.689). Liang et al. [10] added a detection model to detect     Image labelling
the structures in the axial plane of the CT image and constrain the
                                                                             OARs delineation
segmentation region. The results were improved by adding a detection
                                                                                 All the OARs were delineated on the CT images for each patient
model, but the DSC was still inferior for small volume OARs (e.g. optic
                                                                             by experienced radiation oncologists according to the recommended
nerves: 0.689).
                                                                             guidelines [16]. These OARs delineations, called ground truth, were
    Some other studies were also devoted to improving the segmenta-
                                                                             used for segmentation model training.
tion results of small volume structures by modifying the network loss
                                                                             Slice classification
function [11] or augmenting training data [12]. All these endeavors
                                                                                 The CT slices of each patient were classified into six categories
stated that it was difficult to gain a matched segmentation accuracy
                                                                             (Fig. 1) in the z-direction (craniocaudal direction) by experienced radi-
for both small and large volume structures simultaneously. This class-
                                                                             ation oncologists with the following boundary definitions according
imbalance problem of OARs segmentation in H&N becomes more
                                                                             to the position and anatomy features of the landmark structures on
serious when the task is to segment small OARs from all the CT images
                                                                             images. The boundary between categories I and II was the first slice
[11]. In this case, most of the CT slices uncovering a specific OAR
                                                                             of the skull; the boundary between categories II and III was the first
are redundant for the OARs segmentation model and may result in a
                                                                             slice of the eyes; the boundary between categories III and IV was the
time-consuming calculation. Cascaded networks consisting of a coarse
                                                                             last slice of the eyes; the boundary between categories IV and V was
and fine network were also developed for small OARs segmentation
                                                                             the last slice of the cerebellum; and the boundary between categories
[13–15]. The coarse network was used to detect and/or coarsely seg-
                                                                             V and VI was the last slice of the mandible.
ment the OARs, which reduced the redundant region, and then the fine
network finely segmented the OARs based on the results of the coarse
network. However, these methods still did not solve the false-positives                                Preprocessing
problems on irrelevant slices [14].                                          The resolution of axial plane images was resampled to 1 × 1 mm
    In this study, a slice classification model was proposed to classify     using bilinear interpolation. To improve the generalization ability of
CT slices into six categories in the craniocaudal direction. Then the        the segmentation network, both random rotation within 20 degrees
slices in the corresponding categories were pushed to a refined 3D seg-      and random axial translation within 20 pixels were used to augment
mentation network for target OARs segmentation. The redundant CT             the diversity of training image data.
slices that were useless for target OARs segmentation were excluded.
This method provides a way to solve the class-imbalance problem and
                                                                                                    Experimental setup
false-positives on irrelevant slices. This two-step segmentation model
                                                                             To evaluate the effect of the slice classification model, we developed
is expected to improve the segmentation accuracy of OARs in H&N
                                                                             two auto-segmentation models: the segmentation model with
and reduce segmentation time.
                                                                             slice classification model (two-step segmentation model) and the
                                                                             segmentation model without slice classification model (segmentation-
                 MATERIALS AND METHODS                                       only model). The deep learning networks were constructed and
                         Data preparation                                    implemented with Keras [17] using a TensorFlow [18] backend. All
This study was approved by our Institutional Review Board (approval          computations were implemented on a computer with an Intel® Core™
no. LM2018118). All the image data were de-identified by anonymiza-          i7–7700 CPU, hard disk of 4 TB, RAM of 64 GB and a Nvidia GTX
tion and analyzed retrospectively.                                           1080 GPU.

Image data acquisition                                                       Slice classification model
Twelve OARs were included in this study [brainstem, right/left eye,          The slice classification network mainly consisted of depth-wise separa-
right/left optic nerve, right/left temporal lobe, right/left parotid,        ble convolution [19] and max-pooling layers (Fig. 2). Global average
right/left temporomandibular joint (TMJ) and mandible]. A total of           pooling was used to generate the classification tensor and reduce the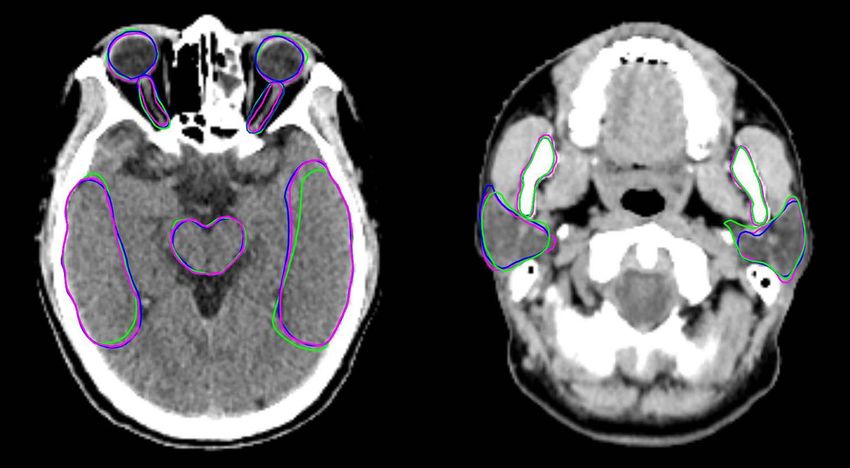
96 • Zhang et al.
Segmentation model
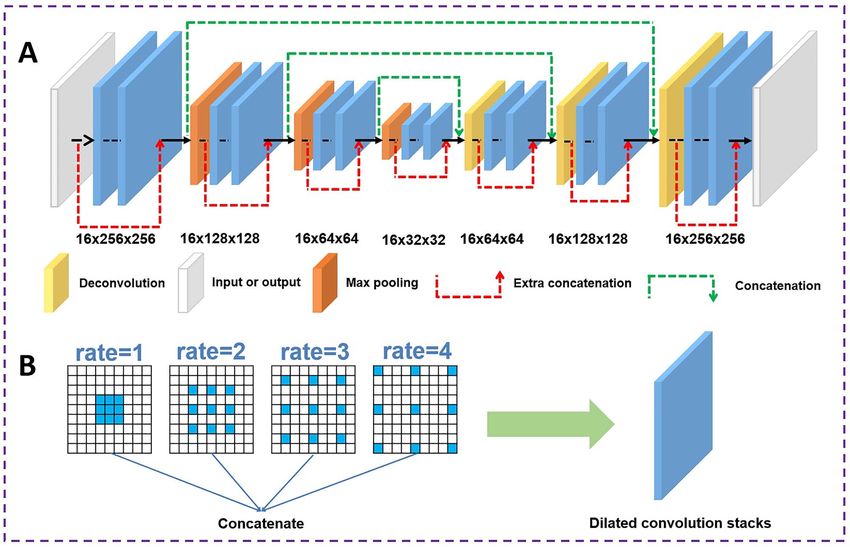
The segmentation network (Fig. 3A) was refined based on the
encoder–decoder architecture of a 3D encoder–decoder. We first
constructed a 3D encoder–decoder network, which consisted of
an encoder path (7 down-sampling dilated convolution stacks) and
a decoder path (7 up-sampling dilated convolution stacks). Four
convolution modules with different dilation rates (rates = 1, 2, 3, 4)
were used in the dilated convolution stacks to extract context features
at different scales (Fig. 3B). In the segmentation model, the network
accepted a CT volume of size 16 × 256 × 256 as the input. The
three dimensions of the CT volume represented the z, x and y-axes,
respectively. The CT slices of a patient were divided into several
volumes sequentially with an overlay of 3 slices in the z-axis. For the
Downloaded from https://academic.oup.com/jrr/article/62/1/94/5917392 by guest on 23 March 2021
case in which the number of slices was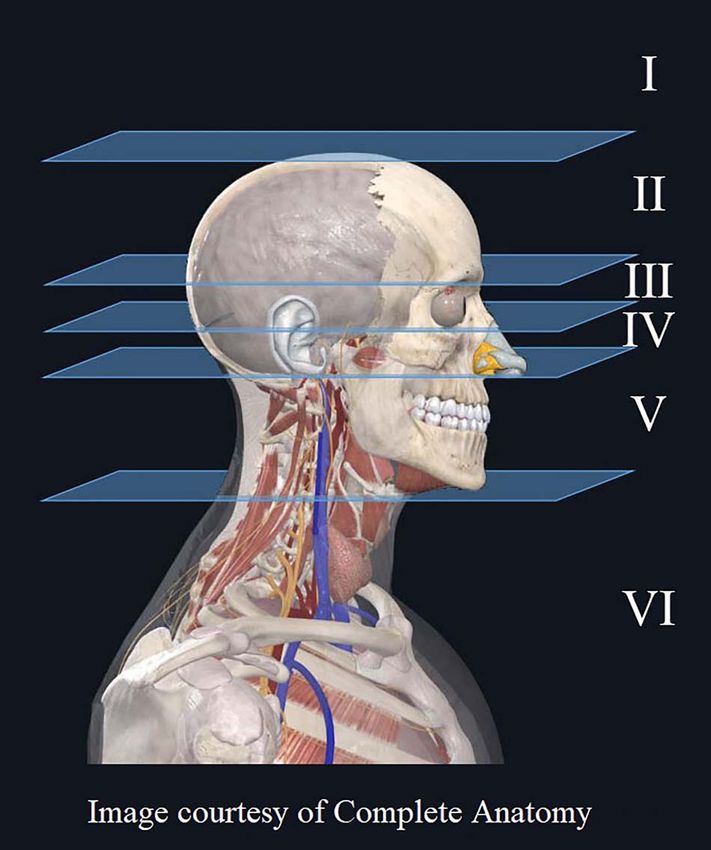
Auto-segmentation of OARs using two-step approachS. • 97

                                                                                                                                                            Downloaded from https://academic.oup.com/jrr/article/62/1/94/5917392 by guest on 23 March 2021
Fig. 2. The architecture of the slice classification model. It mainly consisted of separable convolution, max-pooling and global
average pooling modules. The concatenations between two separable convolutions were used to merge the front and rear feature
maps to extract more features.

    Particularly, the early-stop mechanism was used to monitor the net-       were finally gained by carrying out edge detection on the smoothed
work iteration process, and it stopped the network training when the          OARs masks.
network performance on the validation dataset was not continuing to
improve. The model parameters giving the best network performance                                 Performance evaluation
on the validation dataset were saved and tested on the testing dataset.       The accuracy of the slice classification model was evaluated using the
                                                                              percentage of correct classification of all the slices in each category and
Network testing. For the segmentation-only model, the original
                                                                              the number of slices categorized incorrectly for each category at the
preprocessed CT images of each patient were used as the input of
                                                                              boundary. Also, the number of CT slices excluded/extracted by the
the segmentation model. In contrast, for the two-step segmentation
                                                                              slice classification model for each OAR was counted.
model, the segmentation network was the same as the one used in the
                                                                                  DSC [24] and 95% Hausdorff distance (95HD) [25] were used
segmentation-only model, but the CT images feed for segmentation
                                                                              to evaluate segmentation accuracy. DSC [equation (3)] is a metric to
were additionally processed by the slice classification model. In detail,
                                                                              measure the volumetric overlap between the ground truth and auto-
the original preprocessed CT images of each patient were firstly passed
                                                                              segmentation. Its value was between 0 and 1 (0 = no overlap, 1 = com-
through the slice classification model, and then the slices containing
                                                                              plete overlap). HD is the maximum distance from a point in A to the
target OARs recognized by the slice classification model were pushed
                                                                              nearest point in B, and it is defined as
into the segmentation network. Additionally, considering that the
accuracy of the slice classification model may not achieve 100%, 5
extra slices [13] at the top and bottom boundary were appended to                   HD (A, B) = max (h (A, B) , h (B, A))                            (4)
the original target categories CT slices to guarantee that the target
OARs were completely covered in the slices. For example, during the                 h (A, B) = maxmin a − b                                        (5)
                                                                                                 a∈A b∈B
testing phase, the slices in category III and 5 extra slices at the top and
bottom boundary were pushed to the segmentation network for eye               where points a and b belong to A and B respectively, and ||a − b|| is
segmentation.                                                                 the Euclidean distance. Smaller value usually means high segmentation
                                                                              accuracy. However, outliers have a great influence on HD and result in
                                                                              questionable values [26]. Therefore, 95HD was used in this study to
Postprocessing                                                                avoid this problem. The 95HD was defined as the 95th percentile of
OARs probability maps produced by the segmentation network were               the distance between points on the boundary of A and B [27].
binarized at the threshold of 0.5 to get the OARs masks. Then mor-                The differences in segmentation performance between the two-
phological processing, including erosion and dilation (circular shaped        step segmentation model and the segmentation-only model were
kernel with a radius of 2 pixels and one iteration) was sequentially          evaluated by paired Student’s t-test or non-parametric Wilcoxon
applied on the masks to smooth the OARs edges. The OARs contours              signed-rank test according to the test of normality (Shapiro–Wilk
98 •     Zhang et al.

                                                                                                                                                      Downloaded from https://academic.oup.com/jrr/article/62/1/94/5917392 by guest on 23 March 2021
Fig. 3. The architecture of the refined 3D encoder–decoder network. (A) The refined 3D encoder–decoder network was
constructed with a down-sampling path and an up-sampling path in which the dilated convolution stacks were used to extract
image features. (B) The dilated convolution stack consisted of four convolution modules with different dilation rates (rate = 1, 2,
3, 4).

test). Values are presented as mean with standard deviation (SD). The          Table 1. Percentage of correct classification of all the slices in
statistical analyses were carried out with the Statistical Package for         each category
Social Science software (SPSS, version 24.0, IBM) and the statistical
significance level was set at α = 0.05.                                        Category                                     Accuracy
                                                                               I                                            99.12%
                                                                               II                                           97.26%
                              RESULTS                                          III                                          92.53%
                        Classification results                                 IV                                           89.78%
The percentage of correct classification of all the slices in each category    V                                            98.21%
is shown in Table 1. The slice classification model showed the highest         VI                                           99.01%
accuracy on category I (99.12%) and the lowest accuracy on category
IV (89.78%). The average accuracy was 95.99%.
    The number of slices categorized incorrectly for each category at
the boundary is shown in Fig. 4. The positive value (+n) indicated that       were 20, 10, 14 and 19, respectively. The average number of CT slices
there were n redundant slices in this category at the boundary, and the       that was pushed/not pushed to the segmentation model of two-step
negative value (−m) indicated that there were m missed slices in this         segmentation model for the testing data is shown in Fig. 5. The white
category at the boundary. The maximum number of slices categorized            area (first number) indicates the number of CT slices that was not
incorrectly at the boundary was 3, which appeared in two patients.            pushed to the segmentation model of the two-step segmentation
Fewer than 2 slices were categorized incorrectly in 90% of the tested         model. The gray area (second number) indicates the number of CT
patients.                                                                     slices that was pushed to the segmentation model of the two-step
    The average total number of CT slices for one patient was 127.            segmentation model. For example, the number of CT slices for the eye
The average numbers of CT slices for categories II, III, IV and V             that were pushed to the segmentation model of two-step segmentation
Auto-segmentation of OARs using two-step approachS. • 99
Downloaded from https://academic.oup.com/jrr/article/62/1/94/5917392 by guest on 23 March 2021
Fig. 4. The number of slices categorized incorrectly for each category at the boundary for each testing patient. The positive value
(+n) indicated that there were n redundant slices in this category at the boundary, and the negative value (−m) indicated that
there were m missed slices in this category at the boundary.
Fig. 5. The average number of CT slices that was pushed/not pushed to the segmentation model of two-step segmentation model
for the testing data. The white area (first number) indicated the number of CT slices that was not pushed to the segmentation
model of two-step segmentation model. The gray area (second number) indicated the number of CT slices that was pushed to the
segmentation model of two-step segmentation model.
model was 20, which included 10 slices in category III and 5 extra slices proportion for brainstem, optic nerve, temporal lobe, parotid,
slices at the top and bottom boundary, respectively. The remaining mandible and TMJ was 57.48 (73/127), 84.25 (107/127), 57.48
107 CT slices were not pushed to the segmentation model. This (73/127), 66.14 (84/127), 66.14 (84/127) and 81.10% (103/127)
means that 84.25% (107/127) of CT slices were excluded from the respectively. The average excluded CT slices proportion for one OAR
segmentation using the slice classification model. The excluded CT was 70.98%.100 • Zhang et al.
Table 2. Results of DSC for the 3D encoder–decoder network with or without the slice classification model; values are given as
mean ± standard deviation
DSC
OARs With Without P
Right eye 0.88 ± 0.03 0.87 ± 0.04 0.111
Left eye 0.89 ± 0.03 0.84 ± 0.11 0.022∗
Right optic nerve 0.72 ± 0.09 0.69 ± 0.09 0.027∗
Left optic nerve 0.73 ± 0.09 0.70 ± 0.10 0.013∗
Brainstem 0.87 ± 0.04 0.80 ± 0.08Auto-segmentation of OARs using two-step approachS. • 101
Downloaded from https://academic.oup.com/jrr/article/62/1/94/5917392 by guest on 23 March 2021
Fig. 6. Visual comparison of auto segmentation and ground truth of the brainstem, eyes, optic nerves, temporal lobes, mandible
and parotids. The blue and green lines denote the delineation results generated by the two-step segmentation model and
segmentation-only model, respectively. The purple lines indicate the ground truth labeled by experienced radiation oncologists.
Table 4. Results of segmentation time for the 3D preceding slice classification model, the total segmentation time
encoder–decoder network with or without the slice decreased 21.16%, which indicated a remarkable increase in the
classification model segmentation efficiency of the two-step segmentation model. In this
study, a 3D encoder–decoder network rather than 2D architecture
Time (s)
was used in the segmentation model. The underlying assumption was
Steps With Without that the 3D convolution kernel could capture the context information
Slice classification 4.47 / across the slices, which was helpful for the network to learn the
Segmentation 7.55 13.08 organ shape in the z-direction. Based on the 3D encoder–decoder
Post-processing 28.11 37.82 network architecture, we further employed dilated convolutions to
Total time 40.13 50.90 aggregate multi-scale contextual information without systematically
losing resolution.
To improve the accuracy of auto-segmentation, several methods
Segmentation time have been proposed to optimize the segmentation model, such as inter-
The average time of segmenting all the twelve OARs for the leaving CNNs [28], developing a new loss function [11], and adding
segmentation-only model was 50.90 s (Table 4). By contrast, it was an attention-based strategy [29]. Besides optimizing the models, the
only 40.13 s for the two-step segmentation model, in which 4.47 s were multi-model approaches aroused people’s interest. They were used to
spent on slice classification. The average segmentation time showed an improve the accuracy of auto-segmentation, such as the shape repre-
efficiency improvement of 21.16%. sentation model combined FCNN [9], the detection model combined
segmentation model [10], CNN cascades (simple region detector and
fine segmentation unit) [13], hierarchical neural networks (coarse and
DISCUSSION fine stage CNN) [14], and the automatic anatomy recognition system
A slice classification-facilitated 3D encoder–decoder segmentation [15,30]. All these studies consisted of two models, the first model
network for segmenting H&N OARs automatically was developed and detecting and/or coarsely segmenting the OARs and the second model
validated in this study. The average accuracy of the slice classification segmenting OARs based on the results of the first model. However,
model was up to 95.99%, which indicated that the slice classification all the first models in these studies worked in the axial plane (detect-
network could be used as the prefixed model of the segmentation ing and/or segmenting the OARs slice by slice). If the first model
network. The average DSC and 95HD of all the OARs for the two- had a wrong detection on irrelevant slices, the second model had a
step segmentation model were superior to the segmentation-only high probability of a wrong delineation. The critical problem, false-
model. These results demonstrated that the two-step segmentation positives on irrelevant slices, has not been properly solved. Also, the
model performed well with good consistency with ground truth. The areas incorrectly segmented during the first model would enlarge the
representative example in Fig. 6 also demonstrated that the delineation search space in the incorrect areas, increase unnecessary computation,
of the two-step segmentation model was more consistent with ground and decrease the segmentation efficiency of the second model [14].
truth than the segmentation-only model. Finally, by recruiting the Although these false-positives on irrelevant slices could be somehow102 • Zhang et al.
alleviated using postprocessing [8], it was difficult to prevent false- still remarkably reduced. The average proportion of reduced CT slices
positives on irrelevant slices [14]. Some studies also added a cropping for one OAR was 70.98%.
step between the first and second models, which was used to crop target The two-step segmentation model in this study can be further opti-
structure from the original image. Feng et al. [31] proposed a 3D U- mized in the future. Several strategies, such as attention-based strategy
Net to localize each organ in the axial plane. The original images were (which was used to extract the most relevant features to identify organ
cropped to contain only one organ and served as the input to each boundaries), boosting-based strategy (which was used to improve the
individual organ segmentation network. They found that although the performance of a weak classifier) [32] and lifelong learning (which
cropping step addressed GPU memory and efficiency issues, the inter- was used to transfer knowledge acquired on old tasks to new ones to
organ information was lost during cropping as the related information improve generalization and facilitate model convergence) [33], could
might help improve segmentation accuracy. be added to the segmentation model to improve the accuracy of seg-
In this study, the developed two-step segmentation model had the mentation further. The main limitation was that each of the 12 OARs
main characteristic. The slice classification model was designed to was segmented separately with different 3D networks. During the train-
classify CT slices into six categories in the craniocaudal direction, and ing phase of OAR-specific models, the spatial relationship among these
only the target categories for different OARs were pushed to the cor- OARs was excluded from the model learning phase. The segmentation
Downloaded from https://academic.oup.com/jrr/article/62/1/94/5917392 by guest on 23 March 2021
responding 3D encoder–decoder segmentation network, respectively. results gained from these independent models may cause the delin-
The advantage of this method was to completely prevent the appear- eated organ edges between the OARs to overlap. In the next step, we
ance of false-positives on irrelevant slices. The slice classification model will use a multi-label segmentation model [34, 35], such as segmenting
was developed to provide a new direction to improve the accuracy eyes and optic nerves together, to avoid this overlap problem. The
and efficiency in segmenting OARs. We defined five boundaries in segmentation performance can be expected to be further improved by
the z-direction (not the axial plane). If the number of categories was learning the spatial context embedded among the global structures.
increased, the number of slices in each category would be decreased. Overall, the refined 3D encoder–decoder network with the slice
Each OAR would cross more categories, which increased unnecessary classification model demonstrated superior performance in accuracy
classification. If the number of categories was decreased, the number of and efficiency in automatically segmenting OARs in H&N CT images.
slices in each category would be increased. Each category contained a It should be possible to significantly reduce the workload of OARs
large range, which was not beneficial for OARs localization. According segmentation for radiation oncologists.
to the location characteristics of OARs, five boundaries were selected.
The first and last boundaries were used to exclude CT slices that
did not contain target OARs. The second and third boundaries were ACKNOWLEDGMENTS
the top and bottom border of eyes, and a lot of OARs were in or We would like to thank Jingfei Wang (Beijing Linking Medical Tech-
adjacent to this category, such as eye, optic nerve, optic chiasm and nology Co., Ltd, China) for the data screening, and Dunrui Chang,
pituitary. The fourth boundary was the boundary between intracranial Deqi Cui and Hua Zhang (Beijing Linking Medical Technology Co.,
and extracranial. The slice classification model achieved a satisfactory Ltd, China) for their suggestions with regard to writing.
accuracy for distinguishing the six slice categories. The average accu-
racy was 95.99%. Although the accuracy of category IV wasAuto-segmentation of OARs using two-step approachS. • 103
4. Lorenzen EL, Taylor CW, Maraldo M et al. Inter-observer varia- 19. Chollet F. Xception: Deep learning with Depthwise separable
tion in delineation of the heart and left anterior descending coro- convolutions. arXiv 2017;1610:02357v3.
nary artery in radiotherapy for breast cancer: A multi-Centre study 20. Zhang Z, Sabuncu MR. Generalized cross entropy loss for training
from Denmark and the UK. Radiother Oncol 2013;108:254–8. deep neural networks with noisy labels. arXiv 2018;1805:07836.
5. Sharp G, Fritscher KD, Pekar V et al. Vision 20/20: Perspectives 21. Kingma DP, Ba JL, Adam A. Method for stochastic optimization.
on automated image segmentation for radiotherapy. Med Phys arXiv 2014;1412:6980v9.
2014;41:050902. 22. Klambauer G, Unterthiner T, Mayr A et al. Self-normalizing neu-
6. Kosmin M, Ledsam J, Romera-Paredes B et al. Rapid advances in ral networks. Advances in neural information processing systems
auto-segmentation of organs at risk and target volumes in head and 2017arXiv;1706:02515v5.
neck cancer. Radiother Oncol 2019;135:130–40. 23. Sudre CH, Li W, Vercauteren T et al. Generalised dice overlap as a
7. Cardenas CE, Yang J, Anderson BM et al. Advances in auto- deep learning loss function for highly unbalanced segmentations.
segmentation. Semin Radiat Oncol 2019;29:185–97. arXiv 2017;1707:03237v3.
8. Ibragimov B, Xing L. Segmentation of organs-at-risks in head and 24. Crum WR, Camara O, Hill DLG. Generalized overlap measures
neck CT images using convolutional neural networks. Med Phys for evaluation and validation in medical image analysis. IEEE
Downloaded from https://academic.oup.com/jrr/article/62/1/94/5917392 by guest on 23 March 2021
2017;44:547–57. Trans Med Imaging 2006;25:1451–61.
9. Tong N, Gou S, Yang S et al. Fully automatic multi-organ segmen- 25. Huttenlocher DP, Klanderman GA, Rucklidge WJ. Comparing
tation for head and neck cancer radiotherapy using shape repre- images using the Hausdorff distance. IEEE Trans Pattern Anal
sentation model constrained fully convolutional neural networks. Mach Intell 1993;15:850–63.
Med Phys 2018;45:4558–67. 26. Taha AA, Hanbury A. Metrics for evaluating 3D medical image
10. Liang S, Tang F, Huang X et al. Deep-learning-based detection and segmentation: Analysis, selection, and tool. BMC Med Imaging
segmentation of organs at risk in nasopharyngeal carcinoma com- 2015;15:29.
puted tomographic images for radiotherapy planning. Eur Radiol 27. Raudaschl PF, Zaffino P, Sharp GC et al. Evaluation of segmenta-
2019;29:1961–7. tion methods on head and neck CT: Auto-segmentation challenge
11. Zhu W, Huang Y, Zeng L et al. AnatomyNet: Deep learning for 2015. Med Phys 2017;44:2020–36.
fast and fully automated whole-volume segmentation of head and 28. Ren X, Xiang L, Nie D et al. Interleaved 3D-CNNs for joint
neck anatomy. Med Phys 2019;46:576–89. segmentation of small-volume structures in head and neck CT
12. Thyreau B, Sato K, Fukuda H et al. Segmentation of the hip- images. Med Phys 2018;45:2063–75.
pocampus by transferring algorithmic knowledge for large cohort 29. Tang H, Chen X, Liu Y et al. Clinically applicable deep learning
processing. Med Image Anal 2018;43:214–28. framework for organs at risk delineation in CT images. Nat Mach
13. Men K, Geng H, Cheng C et al. Technical note: More accurate and Intell 2019;1:480–91.
efficient segmentation of organs-at-risk in radiotherapy with con- 30. Udupa JK, Odhner D, Zhao L et al. Body-wide hierarchical fuzzy
volutional neural networks cascades. Med Phys 2018;46:289–92. modeling, recognition, and delineation of anatomy in medical
14. Tappeiner E, Pröll S, Hönig M et al. Multi-organ segmentation of images. Med Image Anal 2014;18:752–71.
the head and neck area: An efficient hierarchical neural networks 31. Feng X, Qing K, Tustison NJ et al. Deep convolutional neural
approach. Int J Comput Assist Radiol 2019;14:745–54. network for segmentation of thoracic organs-at-risk using cropped
15. Wu X, Udupa JK, Tong Y et al. AAR-RT - a system for auto- 3D images. Med Phys 2019;46:2169–80.
contouring organs at risk on CT images for radiation therapy 32. Zhong T, Huang X, Tang F et al. Boosting-based cascaded con-
planning: Principles, design, and large-scale evaluation on head- volutional neural networks for the segmentation of CT organs-at-
and-neck and thoracic cancer cases. Med Image Anal 2019;54: risk in nasopharyngeal carcinoma. Med Phys 2019; [Online ahead
45–62. of print].
16. Brouwer CL, Steenbakkers RJ, Bourhis J et al. CT-based delin- 33. Chan JW, Kearney V, Haaf S et al. A convolutional neural network
eation of organs at risk in the head and neck region: DAHANCA, algorithm for automatic segmentation of head and neck organs at
EORTC, GORTEC, HKNPCSG, NCIC CTG, NCRI, NRG risk using deep lifelong learning. Med Phys 2019;46:2204–13.
oncology and TROG consensus guidelines. Radiother Oncol 34. Fu H, Cheng J, Xu Y et al. Joint optic disc and cup segmenta-
2015;117:83–90. tion based on multi-label deep network and polar transformation.
17. Chollet, F. keras, GitHub. (2015) https://github.com/fchollet/ IEEE Trans Med Imaging 2018;37:1597–605.
keras 35. Nouranian S, Ramezani M, Spadinger I et al. Learning-based
18. Abadi M, Agarwal A, Barham P et al. TensorFlow: Large-scale multi-label segmentation of transrectal ultrasound images for
machine learning on heterogeneous systems. Software 2015; avail- prostate brachytherapy. IEEE Trans Med Imaging 2016;35:
able from tensorflow.org. 921–32.You can also read