Open Research Online The Open University's repository of research publications and other research outputs
←
→
Page content transcription
If your browser does not render page correctly, please read the page content below
Open Research Online
The Open University’s repository of research publications
and other research outputs

Weather-it missions: a social network analysis perspec-
tive of an online citizen inquiry community
Conference Item
 How to cite:
 Aristeidou, Maria; Scanlon, Eileen and Sharples, Mike (2015). Weather-it missions: a social network
 analysis perspective of an online citizen inquiry community. In: European Conference on Technology Enhanced
 Learning (ECTEL 2015), 15-18 Sept 2015, Toledo, Spain (forthcoming), Springer.

For guidance on citations see FAQs.

c 2015 Springer

Version: Accepted Manuscript

Copyright and Moral Rights for the articles on this site are retained by the individual authors and/or other copy-
right owners. For more information on Open Research Online’s data policy on reuse of materials please consult
the policies page.

                                         oro.open.ac.uk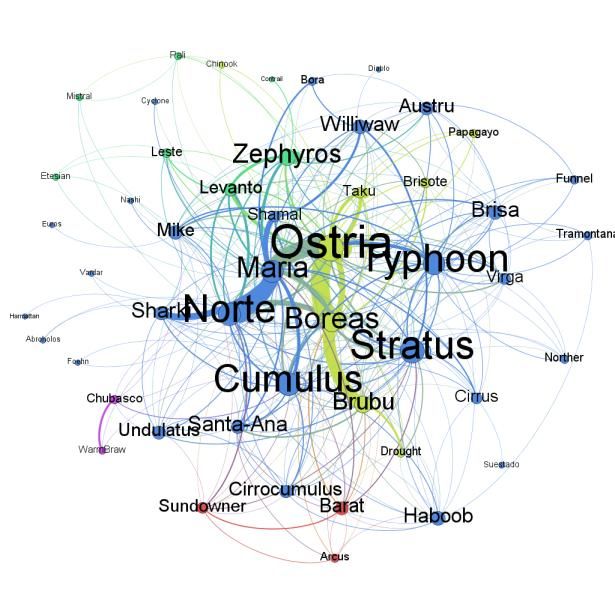
Weather-it missions: a Social Network Analysis
    Perspective of an Online Citizen Inquiry Community

                     Maria Aristeidou, Eileen Scanlon, Mike Sharples

                Institute of Educational Technology, The Open University, U.K.
 { Mar i a. Ar i st ei dou, Ei l een. Scanl on, Mi ke. Shar pl es} @ open. ac. uk

        Abstract. Citizen inquiry is an innovative informal science learning approach,
        which engages members of the general public in scientific investigations
        sparked by their personal experience of everyday science, and to which other
        members can contribute. This paper aims to describe the network of interactions
        and contributions of Weather-it, an online Citizen Inquiry community accom-
        modated by the nQuire-it platform, which involves people in creating and main-
        taining their own weather missions (investigations). The interaction patterns
        within Weather-it are mainly explored through social network analysis of com-
        munity members and missions. The results indicate the quiet and active mem-
        bers within the community, their splitting into sub-communities, and their con-
        tribution and data collection methods and preferences. These results provide in-
        sight into the behaviour of people in such public engagement projects.

        Keywords: Citizen Inquiry, Engagement with Science, Online Community,
        Weather Investigations, Social Interactions, Social Network Analysis

1       Introduction

The term ‘Citizen Science’ describes the research collaborations between scientists
and the public with the latter being volunteer non-experts. Inquiry-based Learning
constitutes a powerful learning and teaching approach for gaining knowledge about
the natural and social world [1]. Citizen Inquiry is an innovative method of informal
science learning that aims to enable the engagement of citizens in online scientific
investigations [2]. It combines aspects from Citizen Science and Inquiry-based Learn-
ing, such as knowledge sharing and peer review (Citizen Science) and experimenta-
tion, discovery, critique and reflection (Inquiry-based Learning). Citizen Inquiry in-
volves people in planning and implementing their own investigations, sparked by
their personal experience of everyday science, to which other people can contribute.
This ownership over the investigation and its practices may lead to greater and active
involvement and may add to the enhancement of competence, performance and rec-
ognition [3] and finally lead to subjects reaching higher levels of engagement [4].
    However, while a number of existing studies explore the motivations around public
engagement in projects that involve citizens with scientific investigation (e.g. [5]) and
its impact in specific science fields (e.g. [6]), no current study explores the network of

adfa, p. 1, 2011.
© Springer-Verlag Berlin Heidelberg 2011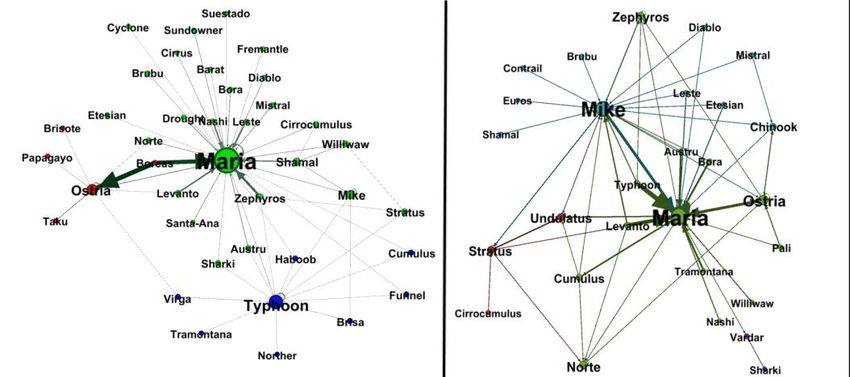
interaction and contributions between the project members. The aim of this study is
to explore the patterns in interactions between the Weather-it members, a community
of people conducting weather investigations. The key question is what is the nature of
interactions in an online community of investigation where citizens create and main-
tain their own projects to which other members can contribute? Social network analy-
sis will be used as the primary method of analysis in order to gain insight into the
relations of the community members with other members and the recourses.

2      Weather-it

Weather-it is a Citizen Inquiry project which aims to explore the creation of an active
and sustainable community for citizens around the world to engage in online investi-
gations. The members of the Weather-it community are people, experts and non-
experts, interested in weather.
   For the enrolment of members, invitations were released in different types of
community. Some examples are the Royal Meteorological Society (RMetS) and the
Tornado and Storm Research Organisation (TORRO) which have supported the pro-
ject and helped in employing some weather experts. For the recruitment of less expert
weather lovers, announcements were added to social networks (e.g. Facebook, Twit-
ter) and other communities interested in weather (e.g. Flyer, OU modules), education
(e.g. teachers forum) or Citizen Science (e.g. iSpot).

2.1    NQuire Toolkit
The Weather-it community is accommodated by the nQuire toolkit which consists of
the online Citizen Inquiry platform nQuire-it and the Sense-it Android app. The
nQuire toolkit has been designed as part of the project nQuire: Young Citizen Inquiry
[7] and scaffolds the needs of Citizen Inquiry by assisting citizens in conducting their
own science investigations, enhancing the social investigation aspect and promoting
scientific thinking and exploration of the world.
    The Sense-it Android app (available from the Play Store) activates the existing
sensors of Android smartphones and tablets (e.g., light, humidity, pressure, and tem-
perature sensors). It allows users to select sensors for measurements and then visual-
ize, store and download the sensor data log files onto their mobile devices. Sense-it
also creates profiles that can be connected to Citizen Inquiry investigations hosted at
the nQuire-it platform, which uploads measurements to the platform automatically.
    The nQuire-it platform (Fig. 1) offers three types of investigation (missions), with
different methods of data collection, for the members to make their research more
interesting, and a forum for further discussion. The three types of missions are Sense-
it, Spot-it and Win-it: Sense-it missions are connected to the Sense-it Android appli-
cation; Spot-it missions use uploaded pictures for the data collection; and Win-it mis-
sions have research questions which require text as an answer. Any member of
nQuire-it can create a new mission for others to join by filling out a form with details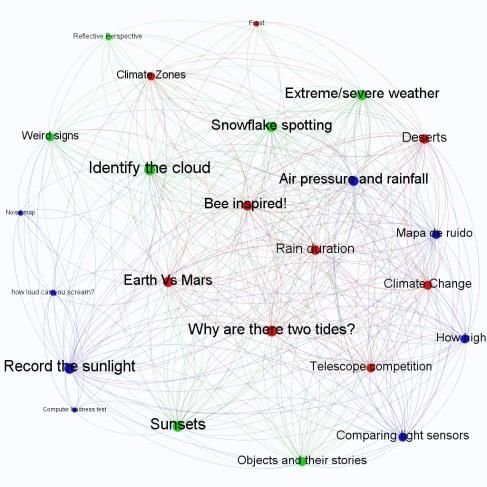
of the mission and uploading a cover image. Creating a Sense-it mission involves also
specifying the sensors to be used and how the data will be processed and displayed.
Fig. 1. The nQuire-it platform – www.nquire-it.org
2.2 Weather-it Activity
As Citizen Inquiry has the potential to encourage informal learning, the presence of
both experts and non-experts in the community promotes the collaboration and
knowledge sharing. Consequently, a member can discuss and exchange knowledge
and methods, collaborate with weather experts to improve their investigation, or help
non-experts.
The weather-missions can be weather questions which members have in their eve-
ryday life, a phenomenon they want to investigate, or something related to climate.
Some examples from the Weather-it missions are:
Record the sunlight (Sense-it mission): The members use the Sense-it Android app.
to record and compare the sunlight daily, in different European countries at the
same time.
Identify the cloud (Spot-it mission): The members take pictures of clouds and up-
load them in order to identify the type of the cloud in collaboration with other
members in the community.
Earth vs Mars (Win-it mission): A member asks a challenging question aiming to
research the climate differences between Earth and Mars. The investigator sets and
adjusts the fields that the participants have to complete (methods, data, resources,
etc.), and the timeline of the research (proposal, voting and outcome stage). The
most voted answer wins a prize.
The participants, of all levels of weather expertise, can create or join weather missions
and invite their network to join too. When becoming members of a mission, they can
add their comments to the mission, or to specific data (i.e. pictures, sensor readings)
(Fig. 2), and vote for their favourite data and response. In addition to the mission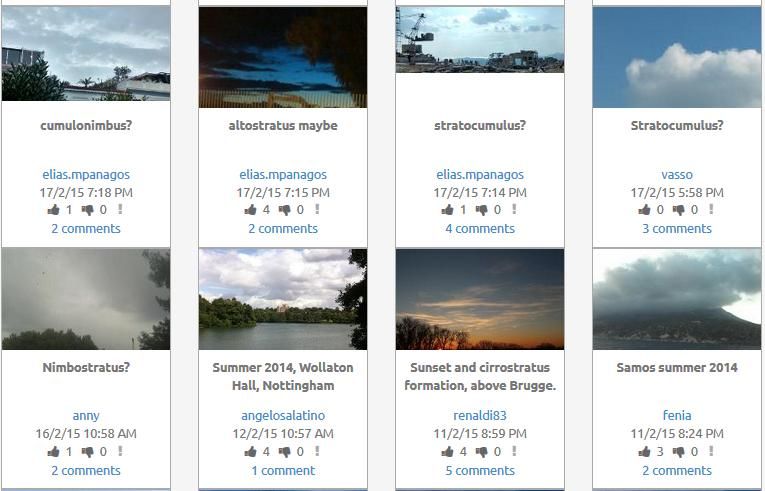
activities, they can create forum topics related to weather discussion, further discus-
sion on the missions and off-topic threads for chat.
Fig. 2. Comments on the “Identify the Cloud” mission pictures
3 Methods
For the exploration of the Weather-it interactions a social network analysis (SNA)
approach was taken. SNA can be used in the context of learning to explore and pro-
mote collaborative links between the learners and the resources, in order to help them
develop their capabilities [8]. The analysis of the structure of social networks of in-
formal learning networks, such as educational blogs, has also been featured in the past
[9]. SNA should help appreciate the structure of the Weather-it community, the par-
ticipation of members (who are active and peripheral participants), and the detection
of sub-communities, to understand the patterns of interactions between the members
and the missions, and answer questions like who contributed to whose data. Some of
the findings are then supported and qualitatively described via data logs.
SNA conceptualizes individuals or resources as nodes, which will be connected by
ties if a link exists between two nodes [10]. The SNA methodology has been applied
to the interactions of the Weather-it community:
Part I: The members are represented as nodes in graphs demonstrating who-
contributed-to-whom. A directed tie is present between two nodes if one member
contributed to the data of another member. The contribution may be (a) member-
ship in missions, (b) data to missions, (c) comments to missions or posts, (d) liking
posts, and (e) posting to the forum. Figure 3 (left) shows an example of this; Mem-
ber A contributed three times to Member B, Member B twice to Member C and
Member C once to Member A. The size of the nodes corresponds to their degree
centrality (the number of their ties) and it means that the bigger the node, the more
contributions the member received and sent. The ties are also weighted (thickened)
according to the number of contributions from the one member to the other.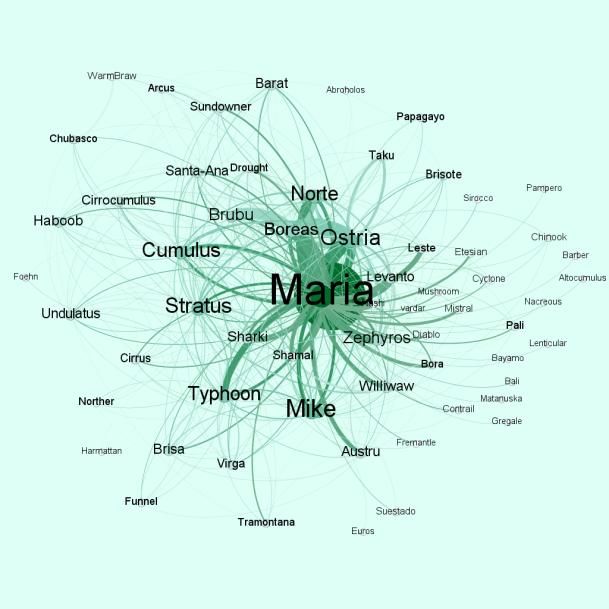
Part II: The missions are represented as nodes in a graph demonstrating co-joined
missions. An undirected tie is present between two nodes if one member has joined
both missions. Figure 3 (right) shows members A, B and C joining Missions 1, 2
and 3.
Fig. 3. Who-contributed-to-whom example (Left), Co-joined missions by members (right)
3.1 Preparing the Data
Although Weather-it missions continue to be available on the nQuire-it platform, in
order to explore the interactions within the community, data from 14 weeks
(23/11/2014-1/3/2015) were exported from the nQuire-it database. For the use of
these data, the members of the community have given their consent for observation
during that specific time interval. Prior to the analysis of the data, the names mem-
bers used on the platform were changed to ones inspired by cloud and wind types (e.g.
Cumulus, Zephyros). The final number of the contributions from the community
members, including the two moderators, can be found in the table below (Table 1):
Table 1. Weather-it contributions
Weather-it Missions Mission Data Comments Forum
Registrations Memberships Creation Posts
101 24 206 422 441 188
The participants who registered for Weather-it but did not register with the nQuire-
it platform (23) are excluded from the SNA as well as the members who did not join
any mission or forum topic (15), as they are not able to create a tie in the network.
Among the contributors there were some users who did not register with Weather-it
and thus there was no access to their user ID and no consent to use their data; those
were also excluded from the network. As a result, for part I, data from 63 members
were included for constructing the whole network graph for who-contributed-to-
whom. For further analysis of the interactions, and the community and hub detection
and description, the contributions towards the moderators of the community (Maria
and Mike) were excluded, in order to spot the hubs created by the members. Thus, for
the sub-communities network graph 50 members were included.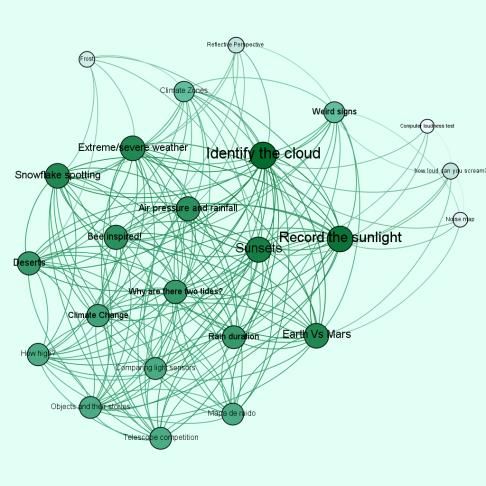
For constructing the network graphs of specific type of contributions (missions,
data, and forum posts) moderators were included in order to capture the contributions
of members towards them. Thus, there are 40 members for the who-contributed-data-
to-whose-mission, 36 for the who-commented-to-whose-data, and 29 for the who-
posted-to-whose-forum-post.
For the part II and the co-joined missions, memberships from 57 members (mod-
erators included) were added to the network. The lists of missions each member has
joined were then rearranged to make pairs of co-joined missions, similarly to the
method followed for co-studied massive open online course subjects [11] and the
terms co-occurrence network [12]. The undirected ties that link two missions show
that a member joined both of these missions. Duplicates were allowed in order to
produce a weighted graph (showing the importance of the link between the missions),
however, in some cases the members were “leaving” the mission and then re-joining;
these kinds of duplicate were excluded from the data.
3.2 Importing to Gephi
The data were then imported into the Gephi visualization tool in a spreadsheet, creat-
ing a directed network for part I and undirected for part II. The network for part I
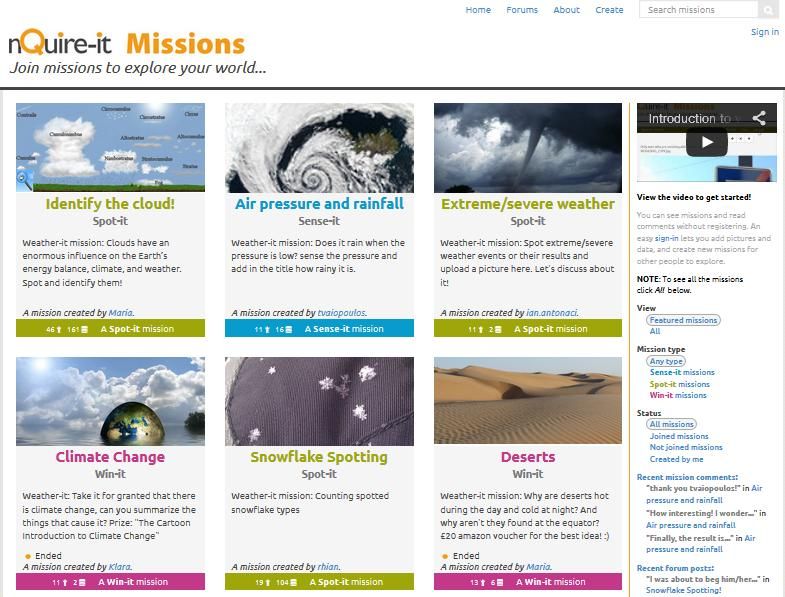
consists of 63 nodes (members) and 421 ties. The network graph which indicates the
whole network for who-contributed-to-whom is shown in Figure 4 and it is obvious
that the central person in the community is the moderator (Maria), with the most of
the contributions directed towards her. The sub-communities network graph consists
of 50 nodes and 338 ties; the missing nodes (13) were contributions from members
only towards the moderators. The modularity algorithm was then used in order to
detect communities [13] of members and their hubs. Further networks exclusively for
the data creation, the comments and the forum posts were also produced, including 39
nodes and 63 ties, 41 nodes and 184 ties, and 28 nodes and 66 ties, respectively.
These are all weighed networks in order to indicate the contribution preferences
within the community. Basic social network analysis metrics were also used, such as
centrality degree, betweeness centrality, and weighted degree to give insight for the
members who are in direct contact to others, lie in the middle of other members, and
are the most active people within the community, respectively [10].
The network for part II comprised 24 nodes (missions) and 186 ties. The number
of the Weather-it missions is 13 but as the members were also allowed to take part in
other missions available on the nQuire-it platform, the final number reached 24 mis-
sions. In part II the membership interconnection is being explored, measuring the
average frequency and the standard deviation of the frequency of members joining
missions and then spotting the dominant and peripheral missions within the weighted
degree graph of co-joined missions. Finally, the modularity algorithm is used to detect
groups of missions based on their “type of mission” attribute (Sense-it, Spot-it, Win-
it). Taking into consideration the mission memberships helps in understanding
whether the members of the community were only interested in weather investigation
or they were open to any kind of investigation, their preferences towards the types of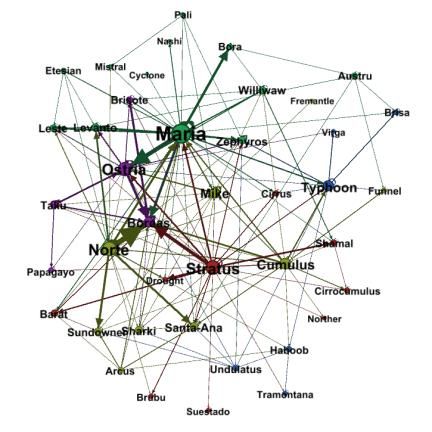
missions (and thus the data collection method), and their motivations for joining and
staying in the community.

     Fig. 4. Visualization of the whole network of who-contributed-to-whom in Weather-it. The
    nodes represent members, the ties the contributions, and the thickness of a tie corresponds to
                                   the volume of the contributions.

4         Results Part I

This section describes the results of part I who-contributed-to-whom. The graphs in
this section represent Weather-it members and their ties according to their contribu-
tions to other members. The results in this section are divided into three main parts,
the whole network, the sub-communities and the contribution by type.

4.1       Whole Network
Visualising the community, it is easy to identify the popular and the peripheral mem-
bers of Weather-it. From the graph in Figure 4 we can see that one of the Weather-it
moderators, Maria, is notably the most important member in the community. Besides
Maria and the second moderator, Mike, some other members (Ostria, Stratus, Cumu-
lus, Norte, Typhoon, Boreas and Brubu) also seem to be high in the degree centrality
ranking and thus ‘where the action is’ [10]. The rest of members have about the same
level of importance overall at a lower degree of centrality, and finally there are thir-
teen members having a single tie – and the least importance. The moderators will be
excluded in the following interpretation of the network. In the betweeness centrality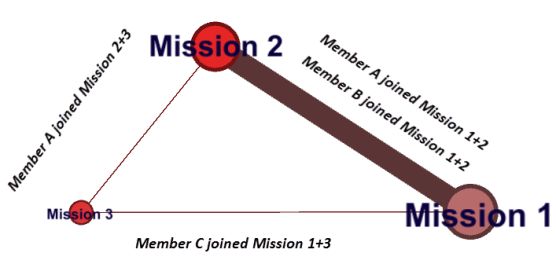
and the weighted-in degree Ostria seems to come to the first place and becomes the
most central member in the community and the member with the most received con-
tributions. However, the results of the weighted-out degree helped in calculating the
most active person of the community, indicating Boreas as the one. The eight mem-
bers with the greatest weighted degree (both in and out), who are also bolder in Figure
4 are shown in the Table 2.
Table 2. Members with greatest weighted degree values in Weather-it
1. Ostria 3. Norte 5. Zephyros 7. Stratus
2. Boreas 4. Typhoon 6. Cumulus 8. Brubu
From the log data it is shown that Ostria had created a Spot-it mission “Snowflake
Spotting” and she maintained it, receiving many data contributions and providing
feedback to her participants. Similarly, Typhoon had created a Spot-it mission in rela-
tion to “Sunsets”. Boreas tended to post data (pictures) to both Ostria’s mission and to
“Identify the cloud” mission, created by a moderator. Brubu is a fan of Boreas’ pic-
tures and voted for almost all of them. Stratus, Cumulus and Zephyros were adding
data and comments to all of the missions. Finally, Norte had created and maintained a
Win-it mission “Rainfall duration”, and at the same time he commented to almost all
of Boreas’ pictures. Whereas the most active participants create missions, contribute
with data, comments and even votes, nine out of ten members with the smallest
weighted degree value had joined a mission each, but had not contributed any further
to it. The tenth member created a forum topic upon joining.
4.2 Sub-communities
Detecting sub-communities in the Weather-it contribution network effectively draws
sub-communities of members that collaborated more often with each other. Gephi has
detected five communities and they are represented in Figure 5 in different colours.
The graph (Fig. 5) shows the in-degree centrality and thus recognises the received
contributions and indicates the “hubs” of the sub-communities. The modularity algo-
rithm result is 0.2, suggesting no dense connections within the sub-communities and
more connections with the other sub-communities. Thus, some of the members belong
in more than one community and as a result their ties are coloured in different ways.
For this analysis, the groups have not been given more meaningful labels, as the clus-
ters were derived directly from the SNA data. Further investigation of the log files for
contributions within the sub-communities showed that:
Purple: The two members, Chubasco and WarmBraw, had only joined and contrib-
uted to a single mission, the “Deserts” Win-it mission, which included a prize for
the winner.
Green: The members who belong to the green sub-community (Zephyros, Levanto,
etc.) were among the first Weather-it members and thus developed further ties with
each other. Also, some of them may have stopped being active and did not get the
chance to collaborate with newer community members.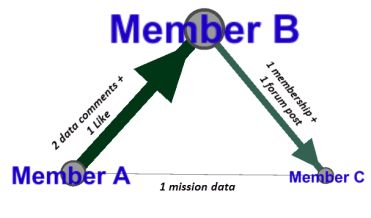
Red: Sundowner, Barat and Arcus have mainly contributed to the “Identify the
Cloud” Spot-it mission and tended to collaborate with each other.
Yellow: This sub-community consists of people whose base was the “Snowflake
Spotting” Spot-it mission. Ostria, the creator of the mission, seems to be the hub of
this group with the greater in-degree centrality value in the graph.
Blue: The most of the members belong to this sub-community. Typhoon, Norte,
Santa-Ana, Cumulus and Stratus have the greatest number of received contribution
and thus the size of their nodes is the biggest constituting the hubs of this group.
Typhoon had many contributions to her Spot-it mission “Sunsets” and Norte has
also received many contributions to his “Rainfall duration” Win-it mission. Cumu-
lus and Stratus have also created missions, the “Climate Change” Win-it mission
and the “Extreme/Severe Weather” Spot-it mission respectively, but with fewer
contributions. These four missions, in contrast to others (e.g. Snowflake Spotting)
attracted a wide range of members. Santa-Ana has contributed interesting pictures
to the “Identify the Cloud” Spot-it mission, becoming the focus of comments from
a large number of members.
Fig. 5. Sub-communities in different colours detected in Weather-it. The sizes of the nodes
(member names) indicate the hubs within the sub-communities.
On the whole, the creation of sub-communities may be related to the time of registra-
tion and the membership duration, the motivation for joining the community, the
preference towards some mission topics or interesting data, or the wide range of con-
tributions one may have. Analysis of interview data, currently underway, may provide
further insight into motivations and preferences of participants.4.3 Data Creation, Comments and Forum Posts
The data creation graph (Fig. 6) shows the weighted ties between the data contributors
and the mission creators, separated in groups of different colours, that the modularity
algorithm has detected. The green one, which is the largest one, has the moderator as
its central member, as she has created the largest number of missions and thus most of
the data have been created for those missions. The hub of the red group is the member
Ostria, who managed to attract to her mission “Snowflake Spotting” members who
also contributed to the moderator’s missions (Norte, Boreas, Levanto) but also mem-
bers who were not engaged in the missions created by the moderator (Papagayo, Bri-
sote, Taku, Virga). Typhoon from the blue group, in the same way as Ostria, has at-
tracted members who were only interested in contributing data to her mission “Sun-
sets” (Tramontana, Norther).
Comparing the graphs in Figure 6, Figure 7 and Figure 8, we can say from their
size that the Weather-it members interacted more through mission and data comments
rather than forum posts. Only fifteen forum threads were created by the Weather-it
members and there were not many contributions towards them. The most frequent
post by the forum contributors was to the “Introducing myself” thread created by a
moderator (Mike). In general, the most successful forum topics were related to off-
topic discussion rather than weather and missions discussion.
Fig. 6. Network graph: Who-contributed-to-whose-mission (left). Fig. 7. Network graph: Who-
contributed-to-whose-forum-post (right
The comments are the most popular way for the Weather-it members to contribute,
indicated by the size of the graph in Figure 8. The comments were directed either to a
mission (a mission creator) or a data item (a data creator) and thus, the more mis-
sions/data one has contributed the bigger the chance of receiving a comment. The top
contributors are the members Ostria, Boreas, Zephyros and Norte. An exception in
this rule is the member Santa-Ana who had not added many data items but her few
contributions were interesting enough (e.g. “Waterspout, Java Sea”) to gather many
comments and spark discussion around them.Fig. 8. Network graph: who-contributed-to-whose-data (comments) From the above, we can draw some conclusions regarding the preference of members in relation to the type of contribution. Few members made use of the forum for their interaction with other participants. Also, the data logs show that those who used the forum mainly contributed off-topic chat, rather than discussing the investigations. The preferred way for the members to contribute is by giving feedback and responses to missions and their data items. However, there are some exceptions (e.g. Boreas) who preferred to contribute data rather than commenting and discussing on other data. 5 Results Part II This section describes the results of part II co-joined missions. The graphs in this section represent Weather-it missions and their undirected ties show co-membership between missions. The results in this section are divided into two main parts, the dis- cussion around co-joined missions and the groups created according to the type of every mission. 5.1 Missions Members in Weather-it joined a minimum of 1 mission and a maximum of 17 mis- sions, with an average of three missions (mean=3.6) and a high distribution (SD=3.4) as the frequency of members joining a single mission was 19 and for joining 17 mis- sions was one. The mission with the largest number of memberships was the “Identify the cloud” Spot-it mission, with 38 memberships from Weather-it people. The second most popular mission is “Record the sunlight” Sense-it mission with 27 Weather-it members. The third place is shared by three missions and 16 members each: “Snow- flake spotting” and “Sunsets” Spot-it missions, and “Earth Vs Mars” Win-it mission.
Fig. 9. Co-joined missions by Weather-it members

Figure 9 shows the interconnection between the co-joined missions, with the largest
memberships also being the most weighted. The least connected missions, which are
also shown to be peripheral in the graph are “Frost”, a new Win-it mission, and four
non-Weather-it missions joined by Weather-it members (Computer loudness test,
Noise map, reflective perspective, how loud can you scream?). The “Bee inspired”
Win-it mission, although it is a non-Weather-it mission, seems to be well intercon-
nected with the Weather-it missions and preferred by the members. However, the
Google Analytics page-view reveals that the largest number of pages that visitors
looked at on the nQuire-it site is for the Spot-it missions “Identify the cloud”, “Snow-
flake spotting” and “Sunset” with 2525, 1001 and 435 views, respectively.
    Figure 10 shows the missions which tend to be chosen together, separated in
Sense-it (blue), Spot-it (green) and Win-it (red) mission types. The graph suggests
that none of the mission types is dominant as they cover almost equal percentages:
Win-it 37.5%, Sense-it 33.3%, and Spot-it 29.2%. Moreover, the modularity algo-
rithm equals to 0.08, indicating weaker ties within the mission types and stronger ties
with other mission types.
    We can see that the Weather-it members may be interested in a single Weather-it
mission and this might also be the reason they have joined the community, but we can
also see members who are interested in general in investigation and they join not only
weather missions, but also other missions available on nQuire-it platform. The three
Spot-it missions that have the greatest page-views from Google Analytics, may also
indicate that this kind of mission attracts many visitors to nQuire-it platform. How-
ever, a Sense-it mission which required daily participation for a month possesses the
second spot within the Weather-it preferences. Finally, the overlap between the mis-
sions of different types shows that the Weather-it members are interested in joining
missions of any type of data collection.

adfa, p. 12, 2011.
© Springer-Verlag Berlin Heidelberg 2011
Fig. 10. Co-joined missions, colour-coded according to the mission type 6 Conclusions and Further Work This paper has looked at the visualised patterns of interactions of the online Citizen Inquiry community Weather-it. This preliminary analysis has been made with the social network analysis method and helped identify the structure of the community and the interactions between the members and the missions. The results of this re- search could indicate the types of activities a member of such a public engagement project is interested in. The contribution behaviour of Weather-it members varied according mainly to their investigation preferences. Members may be interested in any available mission, in Weather-it missions, in a specific type of mission (Sense-it, Spot-it, Win-it) and in a particular mission. Although we can recognise the most popular missions, there is an interconnection between the mission memberships and type of missions, which does not allow us to draw a pattern for co-joining missions and considering a specific type of mission as dominant.. The sub-communities within Weather-it grow mainly around the members who have created missions or contributed many data rendering them the community hubs. The creation of those sub-communities depends not only on the contribution prefer- ences but also on the time of registration. Moreover, some members had more active contribution than others, creating missions or/and offering data to those missions, while some others contenting oneself in providing feedback and comments. Addition- ally, some contributions by some members are focused on missions or data by a single member - and in most cases that is the moderator. A last group of members that re- mained silent during the project is also spotted on the graphs, providing information on what attracted them initially to the community. However, the results of this study raise more questions, such as the relationship be- tween weighted degree and time, as the members with the greatest weighted degree values seem to have joined the community during the first six weeks. Dynamic visu-
alization of interactions between the members and the missions should be formed in
future work, in order to study the evolution of the community over time, track indi-
vidual engagement, the drop outs, the new users, and the changes in the sub-
communities and the mission memberships. Alongside the activity in terms of num-
bers and sizes, the visualisation of words should provide insight to the vocabulary of
the community and initiate a further qualitative analysis on the engagement of mem-
bers with weather investigations and its learning outcome.

References
 1. de Jong, T.: Technological advances in inquiry learning. Science, 312 (5773), 532-533
    (2006)
 2. Aristeidou, M., Scanlon, E., Sharples, M.: A design-based study of Citizen Inquiry for ge-
    ology. In: Katherine, M., Tomaž, K. (eds.) Proceeding of the Doctoral Consortium at the
    European Conference on Technology Enhanced Learning co-located with the EC-TEL
    2013 conference. CEUR, pp.7-13. (2013)
 3. Jordan, R., Crall, A., Gray, S., Phillips, T., Mellor, D.: Citizen Science as a Distinct Field
    of Inquiry. BioScience, biu217 (2015)
 4. Nov, O., Arazy, O., Anderson, D.: Technology-Mediated Citizen Science Participation: A
    Motivational Model. In: Proceedings of the AAAI International Conference on Weblogs
    and Social Media (ICWSM 2011), pp. 249-256 (2011)
 5. Raddick, M. J., Bracey, G., Gay, P. L., Lintott, C. J., Murray, P., Schawinski, K., Szalay,
    A. S., Vandenberg, J.: Galaxy Zoo: Exploring the Motivations of Citizen Science Volun-
    teers. Astronomy Education Review, 9 (1), 101-103 (2010)
 6. Cooper, C. B., Shirk, J., Zuckerberg, B.: The invisible prevalence of citizen science in
    global research: migratory birds and climate change. PloS one, 9(9), (2014)
 7. Herodotou, C., Villasclaras-Fernández, E., Sharples, M.: Scaffolding citizen inquiry sci-
    ence learning through the nQuire toolkit. In: Proceedings of EARLI SIG 20: Computer
    Supported Inquiry Learning, pp. 9-11. Malmö, Sweden (2014)
 8. Haythornthwaite, C., de Laat, M.: Social networks and learning networks: using social
    network perspectives to understand social learning. In: 7th International Conference on
    Networked Learning. Aalborg, Denmark (2010)
 9. Pham, M. C., Derntl, M., Cao, Y., Klamma, R.: Learning analytics for learning blo-
    gospheres. In: Popescu, E., Li, Q., Klamma, R., Leung, H., Specht, M. (eds.), Advances in
    web-based learning – ICWL 2012, vol. 7558, pp. 258–267. Heidelberg: Springer Berlin.
    (2012)
10. Wasserman, S., Faust, K.: Social network analysis: Methods and applications. Cambridge
    university press (1994)
11. Jordan, K.: Exploring co-studied Massive Open Online Course Subjects via social network
    analysis. International Journal of Emerging Technologies in Learning, 9 (8), 38–41 (2014)
12. Rabbany, R., Elatia, S., Takaffoli, M., Zaïane, O. R.: Collaborative learning of students in
    online discussion forums: A social network analysis perspective. In Educational Data Min-
    ing, Studies in Computational Intelligence, vol. 524, pp. 441-466. Springer International
    Publishing (2014)
13. Blondel, V.D, Guillaume, J-L., Lambiotte, R., Lefebvre, E.: Fast unfolding of communities
    in large networks, Journal of Statistical Mechanics: Theory and Experiment, 10, P10008,
    (2008)
You can also read