Bilfinger SE Company Presentation

Page created by Robert Nunez
 
CONTINUE READING
Bilfinger SE Company Presentation
Bilfinger SE

Bilfinger SE Company Presentation
August 2019
Bilfinger SE Company Presentation
Overview
Bilfinger SE Company Presentation
Bilfinger at a glance

          Leading international industrial services provider

          Efficiency enhancement of assets, ensuring a high level of availability and
           reducing maintenance costs
                                                                                          €4.15bn revenue
          Clear 2-4-6 strategy with two service lines, four regions and six focus
           industries
                                                                                         thereof
                                                                                         recurring business ~55%
          Combination of excellence in products and manufacturing (T) and covering
           the full life-cycle (E&M)

          Large share of business with long-term frame contracts and high retention
                                                                                           Orders Received   +10%
           rates

          Well-established customer base with focus on process industries                     €65m EBITA adjusted
          Highly recognized safety and quality performance

          Digital pioneer for the process industry
                                                                                         Approx.   36,000 employees
                                                                                                               based on FY 2018
Bilfinger SE | Company Presentation | August 2019                                                                         page 3
Bilfinger SE Company Presentation
Strategy affirmed, enhanced setup
    2 Service Lines, 4 Regions, 6 Industries

   Our ambition                                                          We engineer and deliver
                                                                        process plant performance

                                                    2 Service Lines                   4 Regions                        6 Industries

                                         • Technologies                   •   Continental Europe               • Chemicals &    • Pharma &
   Where to play                         • Engineering & Maintenance      •   Northwest Europe                   Petrochem        Biopharma
                                                                          •   North America                    • Energy &       • Metallurgy
                                                                                                                 Utilities      • Cement
                                                                          •   Middle East
                                                                                                               • Oil & Gas

                                                    People &           Customer &                  Organization &
                                                                                                                               Financials
                                                     Culture           Innovation                    Structures
   How to win

Bilfinger SE | Company Presentation | August 2019                                                                                              page 4
Bilfinger SE Company Presentation
2 Service Lines
    Enhanced setup for build up and build out phase

    Technologies                                                Engineering & Maintenance
     FY 2018: Revenues €503m, EBITA adj. €-26m                  FY 2018: Revenues €3,477m, EBITA adj. €134m
     Market                                                     Market
     High growth potential for technological products esp. in   Increasing demand in Engineering Maintenance
     Energy & Emissions, Biopharma (Life Science) and           services
     Automation / Digitalization – supported by mega trends

     Characteristics                                            Characteristics
     • Proven technological competence                          • Higher added value to maintenance business
     • Product and manufacturing excellence                     • Covering full life-cycle
     • Centralized capacities                                   • Improve asset and plant performance
     • Serving the global market                                • Superior customer perception
                                                                • Potential for cost savings in SG&A

                  Focusing on Technologies drives                    Combining E and M leverages our business
                  stronger growth and higher margins                 to higher-end services and higher margin

Bilfinger SE | Company Presentation | August 2019                                                               page 5
Bilfinger SE Company Presentation
2 Service Lines
    Technologies: ambition to grow higher-margin business

    Tech-                                           Scrubber                         Pharma &                               Nuclear
    nology                                                                           biopharma                              Services
                                                                                     expertise

    Descrip-            • High demand driven by legis-         • Ageing society and global rise of   • Worldwide build programs
    tion                  lation on emissions and CO2            middle class drives new products      averaging 25 in construction
                        • Proven expertise in flue gas           and sales growth                    • 448 reactors operable worldwide
                          desulphurisation                     • Global market, customers and          – 50% in the US and Europe
                        • Attractive, compact design with        procurement                         • High standards of safety, quality
                          short payback                        • Compact production facilities         and service essential
    Goal                • Increase serial production           • Biopharma skids and bioreactors     • Present on 3 new builds in
                          capacity internally and with         • Global reach with deliveries into     Europe
                          partners                               China and Russia                    • Chosen as strategic supplier for
                        • Scrubber for 70 ships in order       • No. 1 supplier in Europe              NSSS at Hinkley Point > €250m
                          book with further options              (~20% revenue CAGR in the last      • Specialist in engineering, piping
                                                                 4 years)                              systems and handling

Bilfinger SE | Company Presentation | August 2019                                                                                          page 6
Bilfinger SE Company Presentation
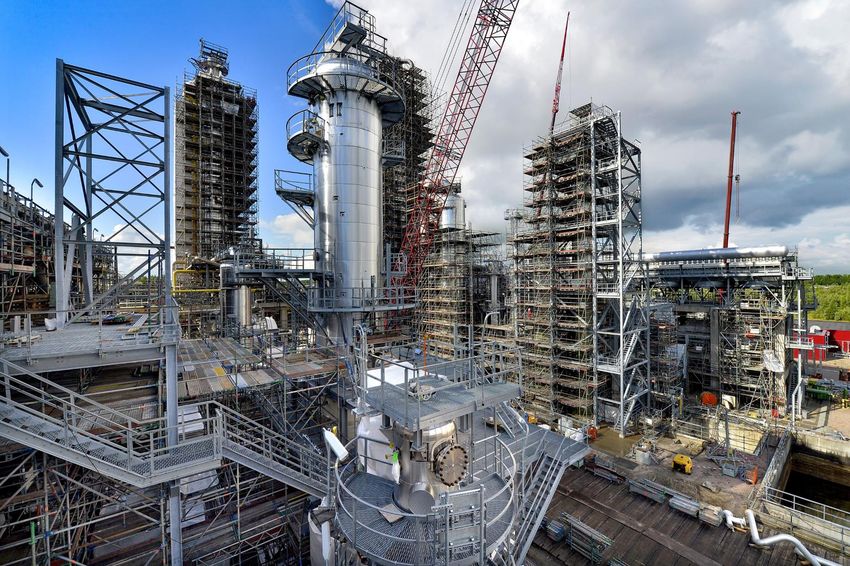
Proven Nuclear Expertise
    Hinkley Point C: Positioned as strategic supplier

                            250

         Accumulated
                orders
           in € million

                                                    30.06.2019   31.12.2019e
Bilfinger SE | Company Presentation | August 2019                              page 7
Bilfinger SE Company Presentation
Marine environmental solutions
    Scrubber: Successful technology transfer

                           200

         Accumulated
                orders
           in € million

                                0
                                            Q2/18   Q3/18   Q4/18   Q1/19   Q2/19   Q3/19e   Q4/19e

Bilfinger SE | Company Presentation | August 2019                                                     page 8
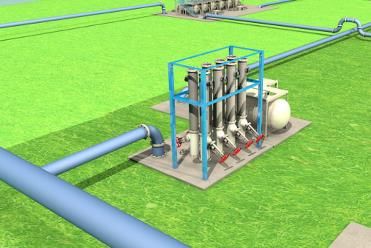
Bilfinger SE Company Presentation
2 Service Lines
    Engineering & Maintenance: combined and full life cycle services driving value

    Tech-                                           Combined                       Bilfinger                             Corrosion
    nology                                          strength                       Turnaround                            under
                                                                                   Concept                               insulation

    Descrip-            • €36m deodorization plant for        • High risk events for customers –    • Major root cause of process
    tion                  Fluxys                                safety, duration and cost             safety issues in recent years
                        • Critical system in transmission and • Large investment programs with      • Investment programs of ~€2bn in
                          leak detection for gas to/from GER    up to 10 year look-aheads             US and Europe p.a.
                        • Gas processing & transmission       • Complimentary to maintenance        • Inspection followed by
                          investment increasing                 services and customer entry point     remediation and replacement
    Goal                • Bilfinger expertise from four        • Consistent and modular             • Bilfinger multi-services enable
                          businesses combined                    approach to reduce risks             integrated teams
                        • Specialists in gas systems,          • Training and development of new    • Rope access technicians reduce
                          automation fabrication and             mobile resources                     customer costs
                          installation involved                • Established player in market       • Innovative solutions for the
                                                                                                      avoidance of repeat failures

Bilfinger SE | Company Presentation | August 2019                                                                                       page 9
Bilfinger SE Company Presentation
Strategic position
    Bilfinger is well positioned to be the frontrunner in the IoT of process industries

     Process Industry                               Bilfinger                                     IT Industry

        Digitalization hurdles                                  Building digital bridges            Applicability deficits

      • Requirement to                                • Deep knowledge of customer needs and      • No access to plant
        improve performance                             processes                                   operators
      • Lack of digitalization                        • Comprehensive digitalization know-how     • Challenge to apply IoT
        knowledge                                     • Independent service provider                knowledge to process
                                                      • Nr.1 in conventional services in Europe     industries

                                                         WE MAKE DIGITALIZATION WORK!

Bilfinger SE | Company Presentation | August 2019                                                                        page 10
Compliance Management System
    A competitive advantage

           Certified by compliance monitor in December of 2018
           Deferred Prosecution Agreement (DPA) concluded

                                                                                         Prevent
           Compliance system is industry leading                                             Prävention

           Compliance-related activities are ongoing,                                Compliance
                                                                                     Reaktion
                                                                                    is an integral part of
           system in a continuous process of innovation
                                                                                   our business strategy
                                                                                   and integrity culture.
                                                                         Respond                             Detect
                       Compliance: an integral part of Bilfinger’s DNA

Bilfinger SE | Company Presentation | August 2019                                                                     page 11
Improving our financial performance
We will address all P&L line-items

     GROSS MARGIN

       • Growth opportunities in high-profitability areas
       • LOA1) process and Project management                  Impact on
                                                             gross margin:
                                                            improvement of
                                                                ~200bps      AMBITION 2)
     ADDRESSING BOTH LINE ITEMS
                                                                             EBITA margin
       • Process and IT harmonization                                         increase of
       • Procurement                                                            ~500bps
                                                                                by 2020
                                                               Impact on
     SG&A RATIO                                               SG&A ratio:
                                                            Improvement of
      • Lean headquarters                                       ~300bps
      • Lean structures in the field

    1) Limits   of authority   2) Mid-cycle   targets
Bilfinger SE | Company Presentation | August 2019                                           page 13
Initiatives for higher efficiency and lower costs

                                      IT PROJECTS                                        PROCUREMENT INITIATIVE

    Status of process and system harmonization (ERP-System):            Increasing number of e-auctions to improve the competitive
     Template solution set up                                           advantage

     Degree of completion: 40%                                         Reduced prices for direct material by further bundling across
                                                                         entities
     Targeting ~70% by end of 2019
                                                                        Focus on best price structures for products like scrubbers

                             MERGER OF OPERATING UNITS                     REDUCTION IN THE NUMBER OF LEGAL ENTITIES
                                                                                                                           operating
    Example Austria: realizing cost synergies by full merger                                                               non-operating

     Reduction from 5 to 1 legal entities by merger, roll-in of ERP     Complexity
                                                                                                      279               -43%
      System                                                             reduction within the                  232
                                                                         organization                                   196
                                                                                                                                  168
     Joint go-to-market                                                 through significant
                                                                                                                                           160

     Full life cycle, i.e. engineering, procurement, construction,      simplification of
      maintenance                                                        legal structure
                                                                                                     Mar. 31,  CMD     Dec. 31, Mar. 31,   target
     Ability to serve all focus industries                                                           2016    Feb. 14,  2017     2019       2020
                                                                                                               2017

Bilfinger SE | Company Presentation | August 2019                                                                                                   page 14
SG&A ratio shows positive trend

     Adjusted SG&A expenses [€ m]                                                                      Highlights
                                                                                                       • SG&A ratio continues to
        99                                                                                               move towards target level
                                                          92     90     94     89    91
                      86                            87
                                   76
                                                                                                       • Streamlining of processes
                                                                                            SG&A       • Reduction of complexity in
                                                                                            expenses     structures, organization and
                                                                                            [€ m]
                                                                                                         governance
                                                                                                       • Adjustment of admin
                                                                                                         headcount
    Q2 2017 Q3 2017 Q4 2017 Q1 2018 Q2 2018 Q3 2018 Q4 2018 Q1 2019 Q2 2019

                                                                                            SG&A
     10.0%          8.6%         7.0%          9.4%      8.7%   8.6%   8.4%   8.8%   7.9%   ratio1)

    1) As   percentage of revenue
Bilfinger SE | Company Presentation | August 2019                                                                                       page 15
Additional working capital improvement initiatives
    Targeting ~85% of trade receivables and WIP in a category-specific approach

   Reporting and Management information                                  Awareness, Education and Coaching
   ▪ Develop and implement reporting improvements:                       ▪ Roll-out E-learning on working capital management
     aging WIP, DSO and DPO payment conditions,                          ▪ Instructions and training sessions on levers for working capital
     root cause analysis on issues, issue reporting                        management for target groups
   ▪ Further harmonisation of internal reports                           ▪ Develop and share toolbox for DSO and DPO (portal, sharepoint)
                                                                         ▪ Share main issues and challenges (hot spots). Help each other to
                                                                           solve issues via workshops, company visits, local support

   Incentives                                                            Best practices
   ▪ Standard bonus and incentive arrangements focused                   ▪ Identify and share best practices via workshops, portal,
     on structural working capital improvements                            quarterly update presentations, benchmark companies
   ▪ Identify and share best practices for target setting (as of 2020)   ▪ Contract management best practices for DSO and DPO
   ▪ Special focus on smoothing intra-year working capital               ▪ Root cause analysis to identify common issues and solutions
     development                                                           using IT tools
                                                                         ▪ Identify (standard) automation and digitalization solutions for
                                                                           O2C processes
Bilfinger SE | Company Presentation | August 2019                                                                                            page 16
Portfolio rotation 2019 and 2020
    Further margin enhancement while keeping a sound balance sheet

      Funding sources:                                                         Re-Investment:
                                                                   Margin
      1. Disposal Other Operations (OOP)                                       ▪ Strengthening
                                                                   accretion
          2 „accretive“ legal entities to be sold                                growth regions

      2. Potential disposal of selected margin-                                ▪ Strengthening
          dilutive units                                                         growth industries
                                                                               ▪ M&A criteria:
      3. Apleona
                                                                                 ▪ EBITA accretive
          Vendor‘s Note
                                                                                   one year after
          €100m, 10% compound interest p.a.
                                                                                   integration, ROCE
           €128m paid back in April 2019
                                                                                   beats WACC two
          Preferred Participation Note
                                                                                   years after
          Book value June 2019: €242m
                                                                                   integration
           Typical money multiple of owner EQT
          would lead to a significant value upside                               ▪ Immediate start of
                                                     Freeing-up                    comprehensive
           Will receive 49% of sales proceeds
                                                           funds                   integration
          (after repayment of debt) at exit

Bilfinger SE | Company Presentation | August 2019                                                    page 17
Guidance 2019, Targets 2020 and Wrap-up
Market environment: Europe

                     Demand in offshore maintenance remains strong

                     Greenfield Petrochem projects in Antwerp

                     Polyolefin projects plateauing, fertilizer bottoming out

                     Upcoming gas infrastructure technology projects (Northstream, Baltic Pipe, German LNG terminal in Brunsbüttel)

                     Market opening for offshore wind farms’ inspection and maintenance

                     Nuclear: ongoing positive expectations on new builds in UK, modernization in France

                     New investments in chemical pharma in Europe. Trend of moving production to Asia is slowing down

                     Biopharma demand for small and medium projects increasing

                     Demand for environmental solutions increasing: DeNOx, DeSOx, CO2

Bilfinger SE | Company Presentation | August 2019                                                                                     page 19
Market environment: North America & Middle East

                 Upstream O&G – Release of Opex funding, e.g. in Permian       Oil & Gas upwards trend continues (KSA, UAE and Qatar
                 Basin and Gulf of Mexico remains steady                       plan field expansions)

                 Midstream stabilizing. Production up despite US rig count     In Country Value (ICV) dominating contractor selection
                 down 15% through first half of 2019, e.g. shale gas driving
                 new cracker projects and mid-stream cryo-plants
                                                                               Forward looking energy strategy shift towards gas, energy
                 Continuing refinery expansions                                conservation projects and renewables; especially wind and
                                                                               solar
                 Energy storage market is expected to double
                                                                               Overall electricity demand in the Gulf Cooperation Council
                                                                               countries plateauing
                 $80 billion in petrochemical projects in development in
                 the USGC, however with some indication of slowing in
                 response to HD polyethylene futures pricing forecasts.

                 Continued industrialization of low cost, clean natural
                 gas in power and all modes of transportation.

Bilfinger SE | Company Presentation | August 2019                                                                                       page 20
Outlook 2019: next step on our way to reach targets

       in € million                                    Actual FY 2018           Expected FY 2019

       Revenue                                                          4,153   Mid single-digit organic growth

       EBITA adjusted                                                     65    Significant increase to more than €100m

       Free Cash Flow reported                                             -4   Positive1)

       1) Notwithstanding      IFRS16 effect: break-even
Bilfinger SE | Company Presentation | August 2019                                                                         page 21
Bilfinger 2020
    Financial ambition

               Organic Growth                                  Profit                                      Cash                                       Return
                                                    • EBITA adjusted ~5%                    • Positive adj. FCF from
                                                                                                                                                   Post-tax
                                                    • Gross margin                            2018 onwards
                                                                                                                                                ROCE reported:
                 >5% CAGR                             improvement by ~200bps                • Over the cycle, from 2018
                                                                                                                                                  8 to 10%
          based on revenue FY 2017                  • SG&A ratio reduction by                 onwards: Cash Conversion
                                                      ~300bps                                 Rate ~ 1 (minus growth
                                                    • Including portfolio rotation            adjustment) 1)

           Capital Structure                                            Investment Grade (mid-term perspective)

                                                                        Sustainable dividend stream going forward
           Dividend Policy
                                                                        Policy: 40 to 60% of adjusted net profit

                                                                                1)   Cash Conversion Definition: (Adj. EBITA + Depreciation – Change NWC - Net CAPEX) / Adj. EBITA
Bilfinger SE | Company Presentation | August 2019                                                                                                                            page 22
Bilfinger 2020
    Build up phase on track

   Value
                                Stabilization
                                                                         Build up                                Build out

              • Strategy defined                                •   Top line growth resumed              • Process and System
              • Organization announced                          •   First successes in new growth areas     harmonization fully rolled out
              • Execution master plan                           •                                
                                                                     New organization in full swing        • Performance culture
              • Top Management Team                             •   Consistent project management           established
              • Dividend proposed                                   process established                  • Productivity wheel in full swing
              • B TOP rolled out                                •   Net Profit break-even                 • Complexity significantly
              • LOA Process rolled out                          •                                     
                                                                     Adj. FCF positive latest in FY 2018     reduced
              • SAP roll-ins commenced                          •   Share buyback completed  
              • CRM implementation started                      •   Successfully refinanced                  Financial ambition reached
              • Cash focus in
                incentive system increased               
              • Operating performance improved               
                                                                                                                                                Time
Bilfinger SE | Company Presentation | August 2019                                                                                                 page 23
The Bilfinger Investment Case:
    Turnaround case based on favorable business model

          Structural demand for industrial                Favorable business                                             Financial soundness
          services                                        characteristics
                                                                                                                         • BB / stable outlook
                                                          • ~55% of output in recurring                                  • 35% equity ratio (as of Dec 31,
          • Increasing # of Industrial plants
          • Increasing total service market and             business                                                       2018)
            contracted out market                         • No material dependency from                                  • Financial participation in Apleona
          • Rising age and complexity                       single clients or regions                                      with significant upside potential
          • Customers demand for greater efficiency       • Growing regional diversification                             • Financial policy: Ambition (mid-term
          • Service bundling                                                                                               perspective) Investment Grade
          • Stricter environmental standards
                                                                                                                         Shareholder-friendly
          Good starting position:                         Asset light business                                           distribution1)
          • Consistently No. 1 supplier of industrial     • Capex: 1.5 - 2.0% of output                                  • From FY 2016 onwards:
            services for the process industry in Europe     volume                                                         €1.00 dividend floor
          • Clearly defined strategy                      • Balanced net working capital                                 • Sustainable dividend stream going
          • Organization derived from strategy              profile                                                        forward:
          • Detailed implementation plan                                                                                   40 to 60% of adjusted net profit
          • Growth and profitability targets                                                                             • Share buyback program of €150m
          • Growth will be supported by additional                                                                         completed in Oct 2018
            business development and digitalization
            activities                                            1)   Based on current expectations and execution of presented strategy as well as on economic outlook at the time.
Bilfinger SE | Company Presentation | August 2019                                                                                                                             page 24
Financials Q2 2019
Bilfinger delivers robust Q2 2019

              Continued high demand in our markets

              Orders received on high prior-year level,
              strong organic revenue growth based on good order backlog

              Improved adjusted EBITA driven by positive margin development
              of E&M segments, Technologies still in turnaround

              Net profit reported as planned positive year-to-date

              Free cash flow above prior year, significant improvement also expected
              for second half 2019
              Refinancing of Bond 12/2019 successfully completed

              Outlook 2019 reaffirmed

Bilfinger SE | Company Presentation | August 2019                                      page 26
Orders received on high prior-year level

                                                                    Development of orders received

                                                                        -1%/+1%
                                                                                                            • Orders received
                                    1,139               1,105            1,114                      1,133     Stable development (-1% / org.:
                                                                                             971
                                     696                 670                                         798      +1%) driven by the base
                                                                          765
          Orders                    (61%)               (61%)                                748              business with orders €100m)
                                       < €5 million   Δ compared with             organic                   • Book-to-bill ~ 1
                                                                         x/x
                                       > €5 million    previous year
                                                                                                            • Order backlog
                                                                                                              -2% below prior-year quarter
         Book-to-
         bill ratio                   1.1                1.1              1.0                1.0     1.0      (org.: 0%)

          Order
        backlog                     2,767               2,828            2,818              2,754   2,712
      (€ million)
Bilfinger SE | Company Presentation | August 2019                                                                                            page 27
Continued strong revenue growth; EBITA adjusted above prior year

                                                               Development of revenue and profitability

                                                                                                          • Revenue
                                                                      +8%/+11%
                                                                                                            +8% increase (org.: +11%) due
                                                                       1,115                      1,147     to strong order backlog and
                                      1,058            1,052                              1,008
        Revenue                                                                                   1.5%      good demand
                                      1.1%
       (€ million)                                                      3.3%              -0.4%
                                                       2.1%                                               • Adjusted EBITA
                                                                                                            Improved to €17 million (prior
                                                                                                            year: €12 million)
                                      Q2/18            Q3/18            Q4/18             Q1/19   Q2/19   • Special items
                                    EBITA adj.
                                                    Δ compared with
                                                                       x/x      organic                     -€15 million,
                                    margin (%)       previous year
                                                                                                            thereof -€2 million restructuring
                                                                                                            and -€11 million from IT
       EBITA adj.
       (€ million)                     12               22               37                 -4      17      investments

           EBITA
       (€ million)                     -1               11               -6                 -3       3

Bilfinger SE | Company Presentation | August 2019                                                                                            page 28
Gross profit impacted by underperformance in Technologies
    Adjusted SG&A ratio improved to 7.9%, target of 7.5% for 2020 confirmed

                        Adjusted gross profit (€ million)                    Adjusted selling and administrative expenses (€ million)

                        95                              97
                      (9.0%)                   82     (8.5%)
                         0                   (8.1%)      0                              12                        11
                                                                                                     5
                                                0
                                                                                        -103         -94         -102
                        95                              97                            (-9.7%)      (-9.3%)     (-8.9%)
                                               82     (8.5%)
                      (9.0%)
                                             (8.1%)
                                                                                                     -89
                                                                                        -92                      -91
                                                                                                   (-8.8%)
                                                                                      (-8.7%)                  (-7.9%)
                      Q2/18                  Q1/19    Q2/19                           Q2/18        Q1/19        Q2/19

                                                               Adjustments      Reported

Bilfinger SE | Company Presentation | August 2019                                                                                       page 29
Segment Technologies: underperformance of single entity,
    action plan in place

                                                               Development of revenue and profitability
                                                                                                          • Orders received
                                                                      +7%/+6%                               +5% (org.: +5%) above prior year
                                                                        145                                 quarter
                                       127              128                                      136
                                                                                         118
        Revenue                                                                                           • Book-to-Bill
       (€ million)                                     -2.6%                                                At 0.8, currently focus on profitability
                                                                                                            improvement and execution
                                      -3.7%                            -8.9%             -8.9%   -9.0%
                                                                                                          • Revenue
                                                                                                            +7% (org.: +6%) increase based on
                                      Q2/18            Q3/18           Q4/18             Q1/19   Q2/19
                                                                                                            good order backlog
                                                    Δ compared with
                                    EBITA adj.                         x/x     organic
                                    margin (%)       previous year                                        • Adjusted EBITA
                                                                                                            Recovery expected in second half of
    Book-to-bill                                                                                            the year
          ratio                       0.8               1.7              1.0              1.0      0.8      Q4: loss-making entity break-even,
                                                                                                            segment with positive result expected

       EBITA adj.                                                                                         • Strategic actions remain an option
       (€ million)                     -5               -3               -13              -10      -12
                                                                                                            within the segment

Bilfinger SE | Company Presentation | August 2019                                                                                                 page 30
Segment E&M Europe: margin shows positive trend

                                                               Development of revenue and profitability
                                                                                                          • Orders received
                                                                      +1%/+2%                               +8% above prior year quarter
                                                                                                 710        (org.: +8%) based on strong
                                       706              695             705
                                                                                         635                demand in Northwest Europe
        Revenue
                                                                       5.3%
       (€ million)                                                                               4.0%     • Book-to-Bill
                                                                                                            1.1 supports continuous growth
                                                       4.7%                              1.6%               expectations in core market
                                      3.3%
                                                                                                          • Revenue
                                      Q2/18            Q3/18           Q4/18             Q1/19   Q2/19
                                                                                                            +1% (org.: +2%), positive
                                                    Δ compared with                                         development on already good level
                                    EBITA adj.                         x/x     organic
                                    margin (%)       previous year
                                                                                                          • Adjusted EBITA
    Book-to-bill                                                                                            Increase through margin
          ratio                       1.0               0.9              1.1              1.0      1.1      improvement (4.0% against 3.3%)

       EBITA adj.
       (€ million)                     24               33               37               10       28

Bilfinger SE | Company Presentation | August 2019                                                                                            page 31
Segment E&M International: strong revenue growth,
    good quarter in North America

                                                               Development of revenue and profitability
                                                                                                          • Orders received
                                                                      +53%/+44%                             -18% (org.: -23%) below strong
                                                                                                  267       prior-year quarter with large project
                                                                         222                                in the US
        Revenue                                                                           213
                                       174              191
       (€ million)                                                      10.5%
                                                                                                          • Book-to-Bill: 0.9

                                                       1.8%                               2.1%    2.9%    • Revenue
                                      0.9%
                                                                                                            Strong revenue growth of +53%
                                                                                                            (org.: +44%) especially due to
                                      Q2/18            Q3/18            Q4/18             Q1/19   Q2/19
                                                                                                            strong project execution in North
                                                    Δ compared with                                         America
                                    EBITA adj.                          x/x     organic
                                    margin (%)       previous year
                                                                                                          • Adjusted EBITA
    Book-to-bill                                                                                            Increase through growth and
          ratio                       1.7               1.1               0.8              0.7      0.9     significant margin improvement
                                                                                                            (2.9% against 0.9%)

       EBITA adj.
       (€ million)                      2                3                23                5        8

Bilfinger SE | Company Presentation | August 2019                                                                                               page 32
Cash flow and DSO improved against prior year and prior quarter

                                                                                                                                                                                                                                      Adjusted
                        Adjusted operating cash flow1) (€ million)                                                         Net profit (€ million)                                                                                net profit (€ million)
                                                                                                                                                             11
                    Adjust-                                                                                                                                                                                                               8
                     ments                                                                          Continuing operations                    12
                                  21                         17                                                                                                                                                                                            6
                                                                                                                                                                                3
                                                             -25                                            Discontinued
                                                                                                                                             -1
                 Reported         -41                                 -8
                                            -19                                                               operations                                                        -9
                                                                                                                                                                                          -6
                                 Q2/18                      Q2/19                                                                                                                                                                     Q2/18               Q2/19
                                                                                                                                            Q2/18                              Q2/19
 1)   Adjustments correspond to EBITA adjustments, Q2 2019 includes +€14m from IFRS 16

                                          Net Trade Assets                                                                                                        Net liquidity (€ million)

                                                                                                                                                                                                      -5
                                                                                                                                                                                                                     -42
          589           566              605
                                                        84              83 69            78 65                                                                                        108
                                                              68                                                                                                                                                                      -35
                                                                                                                             -8
                                                                                                           -253                               -17                                                                                                 -8
                                                                                                                                                                   -11                                                                                     -271

                                                                                                            Apr. 1, 2019

                                                                                                                             OCF adjusted

                                                                                                                                               Adjustments

                                                                                                                                                                   Net Capex

                                                                                                                                                                                     disposals
                                                                                                                                                                                     Acquisitions/

                                                                                                                                                                                                     Interest paid

                                                                                                                                                                                                                     Dividends

                                                                                                                                                                                                                                   operations
                                                                                                                                                                                                                                   discontinued
                                                                                                                                                                                                                                   Cash flow

                                                                                                                                                                                                                                                  Other

                                                                                                                                                                                                                                                            Jun. 30, 2019
        Jun. 30,      Mar. 31,       Jun. 30,           Jun. 30,       Mar. 31,          Jun. 30,
         2018          2019           2019               2018           2019              2019
                Net Trade Assets (€ million)                 DSO (days)         DPO (days)
DSO: Trade receivables + WIP - advance payments received, DPO: Trade payables
Bilfinger SE | Company Presentation | August 2019                                                                                                                                                                                                                           page 33
Successful refinancing of Bond maturity 12/2019
    Increased interest rate, but lower total debt
    New financing mix with staggered maturity profile and broader investor base

        Financial debt by 12/20181):                              Expected financial debt by 12/20191):                      Debt Maturity Profile
                   €500m                                                        €373m                                        as of June 30, 2019
                                                                 Bond      Maturity: 06/2024 (5 years)                                                                   €5m
                                                                 06/2024
                                                                           IG documentation (no covenants)                                    €118m
                                                                                                                                                                         €250m
                                                                 €250m     Interest: Coupon 4.500% p.a. fixed
                                                                                     Yield  4.625% p.a. fixed
                                                                                                                                                      2)
                                                                                                                             2020      2021    2022        2023   2024

                          Maturity:                  Repayment                                                                       Promissory note loans (SSD)
                          12/2019 (7 years)
     Bond                                             12/2019                                                                        Bond
     12/2019              IG documentation                                                                                   2)   Revolving Credit Facility
                          (no covenants)                         SSD       Maturity: Majority in 04/2022 (3 years)                (€300m, undrawn) also matures in 2022
     €500m
                          Interest:                                                                                  Weighted interest rate:
                                                                 €123m     IG documentation (no covenants)
                          Coupon 2.375% p.a. fixed                                                                   ~3.8% p.a.
                                                                           Interest: Coupon ~2.2%                    i.e. ~€14m p.a.

                                                                 VCN       Cash-in 04/2019                           Accrued value by 03/2019
                                                                 Apleona                                             (€100m / 10% interest p.a.)
                                                                                                                      No further interest income
                                                                 €128m                                                 going forward

    1) w/o   leasing liabilities
Bilfinger SE | Company Presentation | August 2019                                                                                                                                page 34
Disclaimer

         This presentation has been produced for support of oral information purposes only and contains forward-
         looking statements which involve risks and uncertainties. Forward-looking statements are statements that are
         not historical facts, including statements about our beliefs and expectations. Such statements made within this
         document are based on plans, estimates and projections as they are currently available to Bilfinger SE.
         Forward-looking statements are therefore valid only as of the date they are made, and we undertake no
         obligation to update publicly any of them in light of new information or future events. Apart from this, a number
         of important factors could therefore cause actual results to differ materially from those contained in any forward-
         looking statement. Such factors include the conditions in worldwide financial markets as well as the factors that
         derive from any change in worldwide economic development.
         This document does not constitute any form of offer or invitation to subscribe for or purchase any securities. In
         addition, the shares of Bilfinger SE have not been registered under United States Securities Law and may not
         be offered, sold or delivered within the United States or to U.S. persons absent registration under or an
         applicable exemption from the registration requirements of the United States Securities Law.

Bilfinger SE | Company Presentation | August 2019                                                                              page 35
You can also read