THE 15TH ANNUAL ONE ON ONE EFG HERMES CONFERENCE DUBAI MARCH 2019 - RAK Ceramics
←
→
Page content transcription
If your browser does not render page correctly, please read the page content below
INVESTOR PRESENTATION

                                          THE 15TH ANNUAL ONE ON ONE EFG HERMES CONFERENCE
                                                                DUBAI

                                                             MARCH 2019

RAK Ceramics PJSC © 2019. All rights reserved                    1
INVESTOR PRESENTATION

     Attendees

      Abdallah Massaad                                            PK Chand                                                    Wassim Moukahhal
      Group Chief Executive Officer                               Group Chief Financial Officer                               Executive Board Member
      Abdallah Massaad is Group CEO of RAK Ceramics. and has      Pramod Kumar Chand is the Group Chief Financial Officer     Wassim Moukahhal is a member of the Board of Directors
      over 22 years experience in ceramics manufacturing, sales   of RAK Ceramics. Mr. Chand has wide experience in           and the Executive Committee of RAK Ceramics.
      management, product marketing and business leadership.      dealing with corporate finance matters including treasury   Mr. Moukahhal is currently serving as Managing Director of
      Prior to RAK Ceramics, Mr. Massaad was General Manager      and working capital financing, project finance, venture     Samena Capital Investments Limited in Dubai and has more
      of ICC SARL, Lebanon.                                       capital, debt & equity capital market instruments, fund     than 12 years of experience in private equity investments
      Mr. Massaad holds post graduate qualifications in           raising processes and general management.                   within the MENA region.
      Management (DEA in Business Administration) and an          Mr. Chand is a Member of the Institute of Chartered         Mr. Moukahhal holds an MBA from the Wharton School at
      undergraduate degree (Maitrise in Business Administration   Accountants of India (CA) and has been a rank holder and    the University of Pennsylvania and a Bachelor’s degree in
      - Marketing) from Université Saint-Esprit de Kaslik,        winner of A F Ferguson award.                               Economics and Finance from McGill University.
      Lebanon.

RAK Ceramics PJSC © 2019. All rights reserved                                                 2
INVESTOR PRESENTATION

     Disclaimer

         This information contained in the enclosed presentation summarises preliminary and              and past performance is not indicative of future results. The Company undertakes no
         introductory information on RAK Ceramics PJSC (the Company). This presentation                  obligation to publicly update or publicly revise any forward-looking statement,
         has been prepared for information purposes only and is not and does not form part               whether as a result of new information, future events or otherwise. Accordingly all
         of or constitute any prospectus, offering memorandum or offering circular or offer              potential recipients are expected to conduct their own due diligence on the
         for sale or solicitation of any offer to subscribe for or purchase or sell any securities       information provided.
         nor shall it or any part of it form the basis of or be relied on in connection with any
                                                                                                         These materials are confidential and are being submitted to selected recipients only
         credit evaluation or third party evaluation of any securities or any offerings or
                                                                                                         for the purpose described above. They may not be taken away, reproduced (in whole
         contract or commitment whatsoever.
                                                                                                         or in part), distributed or transmitted to any other person without the prior written
         The information contained herein has been prepared by the Company. Some of the                  consent of the Company. These materials are not intended for distribution to, or use
         information relied on by the Company is obtained from sources believed to be                    by any person or entity in any jurisdiction or country where such distribution or use
         reliable but does not guarantee its accuracy or completeness. All potential recipients          would be contrary to local law or regulation and must not be acted on or relied on
         of the enclosed presentation are expected to be aware that the information                      by persons who are not relevant persons. If this presentation has been received in
         contained herein is preliminary as of the date hereof, supersedes any previous such             error it must be returned immediately to the Company.
         information delivered and will be superseded by any such information subsequently
         delivered. The information contained herein is subject to change without notice. The
         Company is under no obligation to update or keep current the information
         contained herein. No person shall have any right of action (except in case of fraud)
         against the Company or any other person in relation to the accuracy or
         completeness of the information contained herein.
         Some of the information in this presentation may contain projections or other
         forward-looking statements regarding future events or the future financial
         performance of The Company. These forward-looking statements include all matters
         that are not historical facts. The inclusion of such forward-looking information shall
         not be regarded as a representation by the Company or any other person that the
         objectives or plans of the Company will be achieved. Future events are subject to
         various risks which cannot be accurately predicted, forecasted or assessed. No
         assurance can be given that future events will occur or that the company’s
         assumptions are correct. Actual results may differ materially from those projected

RAK Ceramics PJSC © 2019. All rights reserved                                                        3
INVESTOR PRESENTATION

                                                Company Overview

    Overview                                        Strategy       Results

RAK Ceramics PJSC © 2019. All rights reserved                  4
INVESTOR PRESENTATION

     RAK Ceramics at a glance

         +  25YEARS
         Ceramic expertise
                                                One of the largest ceramic
                                                  brands in the world.
                                                                                                                                       15,000
                                                                                                                                        Global workforce

                 150                                              1
                                                                                           OWNERSHIP

             +                                                  + BILLION SQM                                     29.2%                30.6%

        Countries exported                                      Tiles supplied worldwide

                                                                                                                 5.0%
                                                                                                                   5.3%             11.4%

                                                   486MN               755MN
                                                                                                                      5.3%
                                                                                                                          6.3% 7.0%
                                                US$              US$
                                                                                            Samena Capital                          Institutional Investments
                                                  Market Cap.       Group turnover          Al Rajhi Holdings, KSA                  RAK Royal Family Members
                                                                                            General Pension Social Authority, UAE   H.H. Sheikh Saud Bin Saqr Al Qasimi
                                                                                            RAK Government                          Retail Investors

RAK Ceramics PJSC © 2019. All rights reserved                               5
INVESTOR PRESENTATION

     Brief history

                 1989                                  1991                        1993                       2000                      2004
     Founded by H.H. Sheikh                     First tile plant began in   First sanitaryware plant   Opening of First overseas    RAK Porcelain was
     Saud Bin Saqr Al Qasimi                              the UAE               began in the UAE        tile plant in Bangladesh       established

                                                    No.1
                2006                                   2010                        2014                        2016                     2018
      India operations began                     Became the world’s         Samena Capital acquires     Launch of new brand            Saudi Arabia
                                                  largest ceramics             31% stake in RAK               identity             expansion announced
                                                    manufacturer                  Ceramics

RAK Ceramics PJSC © 2019. All rights reserved                                           6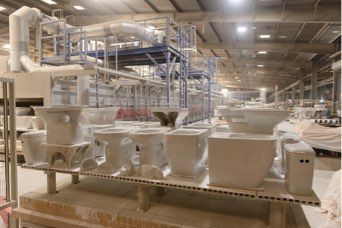
INVESTOR PRESENTATION

     Business lines

        TILES                                       SANITARYWARE

        We offer 6,000+ models,                     Complete solutions
        one of the largest                          provider offering products
        collections of ceramic wall                 designed to suit all budgets
        and floor tiles, gres                       and tastes with accessories
        porcelain and super-sized                   and bathroom furniture.
        slabs in the industry.

        TABLEWARE                                   FAUCETS

        Products supplied to over                   Eco-friendly faucets and
        20,000 hotels across                        bathroom fittings with a
        more than 140 countries                     strong focus on water-
        with clients including JW                   saving technology, offering
        Marriott, Hilton, Hyatt,                    up to 60% saving on water
        and Sheraton amongst                        consumption.
        others.

RAK Ceramics PJSC © 2019. All rights reserved   7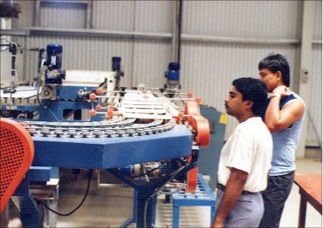
INVESTOR PRESENTATION

     Manufacturing footprint

        2019 GLOBAL PRODUCTION

        • 22 plants worldwide                                                                    22
        • 16 Tiles Plants in UAE (10), India (3), Bangladesh
                                                                                                PLANTS
          (1), Iran (1) and China (1).
                                                                                               WORLDWIDE
        • 4 Sanitaryware Plants in UAE (2), India (1), and
          Bangladesh (1)

        • Tableware - UAE (1)

                                                                                                                            CHINA   1
                                                                             IRAN    1

            123MN                                     5MN                                                  BANGLADESH   2
                                                                                    UAE   14
       Square metres of tiles                   Pieces of sanitaryware

                                                                                                   INDIA   4

              24MN                                     1MN
         Pieces of tableware                      Faucets and taps

RAK Ceramics PJSC © 2019. All rights reserved                            8
INVESTOR PRESENTATION

     Production capacity by location

         TILES                                                      SANITARYWARE

                                                     5%
                                                5%
                                                                                                13%
                                       9%

                                  10%

                                                                                         30%                       57%

                                                          71%

         UAE (82mn sqm)
         Bangladesh (11.6mn sqm)
         India (18mn sqm)                                           UAE (3.0mn pieces)
         Iran (6mn sqm)                                             Bangladesh (1.6mn pieces)
         China (5.5m sqm)                                           India (0.7mn pieces)

                                                                    FAUCETS
         TABLEWARE
                                                                    100% of Faucets produced in UAE (1mn pieces)
         100% of Tableware produced in UAE (24mn pieces)

RAK Ceramics PJSC © 2019. All rights reserved                   9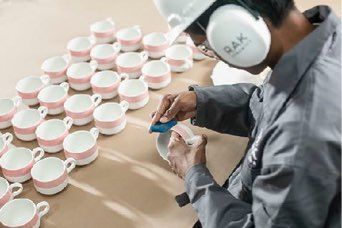
INVESTOR PRESENTATION

     Market position in focus markets - Tiles

                                                             UNITED ARAB EMIRATES                 BANGLADESH
          Our market share in United
          Arab Emirates has increased
          from 22% in 2017 to 25% in
          2018 driven by increase in                                        #   1                                 #   1
          project sales. The three largest
                                                             Market Size*          86 (MN SQM)     Market Size*       76 (MN SQM)
          ceramics producers in the
          region account for >80% of the                     Market Share          25%             Market Share       10%
          total production capacity.
          UAE market grew by +3.6% in
          2017 compared to 2016
                                                             SAUDI ARABIA                         INDIA
          Bangladesh markets continue
          to grow with tile consumption
          increasing +7.0% in 2017
          compared to 2016.
                                                                            # 2                                   #5
                                                             Market Size*          203 (MN SQM)    Market Size*       760 (MN SQM)

                                                             Market Share          7%              Market Share       2%

Source: 2017 Ceramic World Review, *2018 data unavailable.

RAK Ceramics PJSC © 2019. All rights reserved                                 10
INVESTOR PRESENTATION
Global market position - Tiles
PRODUCTION (MILLION SQM)
In 2018 RAK Ceramics retained
it position as the 4th largest
tile producer globally. MOHAWK INDUSTRIES, INC 240
SIAM GROUP 187
GRUPO LAMOSA 171
RAK CERAMICS PJSC 82
PT MULIAKERAMIK 80
CERAMICA CARMELO FIOR 81
PAMESA 74
GRUPO FRAGNANI 74
KAJARIA CERAMICS 64
CERSANIT SA 60
Source: *Ceramic World Review 2017
RAK Ceramics PJSC © 2019. All rights reserved 11INVESTOR PRESENTATION
Vision and key strengths
The world’s leading ceramics lifestyle
solutions provider.
EXPERIENCE WIDE RANGE INNOVATION QUALITY
We have helped to create We are known for our wide Innovation is at the heart of We are able to consistently
some of the world’s most product range and our our philosophy and we manufacture high quality
iconic buildings. ability to produce bespoke have continuously led the products with an
ranges for small and large way in terms of product impeccable finish.
scale projects. development.
RAK Ceramics PJSC © 2019. All rights reserved 12INVESTOR PRESENTATION
Business Strategy Update
Overview Strategy Results
RAK Ceramics PJSC © 2019. All rights reserved 13INVESTOR PRESENTATION
Value creation plan achievements
ISSUES AND OPPORTUNITIES IDENTIFIED VALUE CREATION INITIATIVES AND IMPACT
TRANSFORM “RAK INC.” !Divestment proceeds of >USD 130m from 12 non-core exits
Exit of Non -Core operations !Proceeds used to fund capex, de-lever the balance sheet and pay dividends
BACK TO “RAK CERAMICS
!RAK Sudan exit generated proceeds of AED 220m
Loss-making Sudan & China operations
!Shut down of RAK China removed losses from consolidated P&L
!Increased Bangladesh tiles capacity by 45% to 11.6mn sqm
Production capacity !Increased SW capacity by 20% in the UAE and 25% in Bangladesh
!Switched to a “Pull” sales & distribution model
“Push” sales & distribution model !Created a B2B sales team targeting real estate and hospitality sectors
!Flagship wins: Emaar and Al Habtoor (UAE), H&M and Starbucks (Int’l)
REFOCUS AND GROW THE !Switched to a life style brand
Manufacturing brand !New brand launched in Q3 2016
CORE BUSINESS
!Acquired UK, Germany, Italy and Saudi Arabia distribution JV’s
Inefficient distribution network in key markets
!Gained control over access into new markets, channels and customers
!Initiated a turnaround plan
Untapped value in India operations !Production capacity increased by 38% through Morbi acquisitions
!Dealer network rationalized & new brand rolled-out
!RAK Porcelain has grown from a start-up into a leading player in the HoReCa industry. Strategic
Tableware potential; candidate for unlocking value discuss underway to further scale the business and unlock value
Improve corporate governance structures !Overhauled corporate structure; streamlined ownership of subsidiaries
INSTITUTE A WORLD-CLASS across the group !Added Independent Directors to the Board
CORPORATE GOVERNANCE
STRUCTURE ! Recruited top-talent into leadership positions
Gaps in HR and Investor Relations
RAK Ceramics PJSC © 2019. All rights reserved 14INVESTOR PRESENTATION
Value creation plan achievements (Cont’d)
NON-CORE ASSETS DIVESTED; PROCEEDS REINVESTED IN CORE BUSINESS BALANCE SHEET REDUCED AND DIVIDENDS DISTRIBUTED
12 >US$ 130MN TOTAL ASSETS (AED MN)
5,679 5,497
DIVIDEND PAID
35%
30%
3,039 25%
2,783
# of exits since Q2 14 In divestment proceeds
15% 15% 15%
10%
110MN 275MN
2,639 2,714 5% 5% 5%
>US$ >US$
2013 2018 2013 2014 2015 2016 2017 2018
reinvested in core production In cash dividends (2014-2018)
capacity and three 5% stock dividends Shareholder Equity Total Liabilities Cash Stock
CORE BUSINESS NOW CONTRIBUTES THE MAJORITY OF THE TOPPLING PROFITABILITY ENHANCED TO RECORD LEVELS
4.9%
8.4%
18.7% 14.7% 16.0% 13.0%
CONSOLIDATED GP MARGINS (%) CORE GP MARGINS (%)
+578bps +460bps
33.2% 33.3%
91.6% 95.1%
81.3% 85.3% 84.0% 87.0% 28.7%
27.4%
2013 2014 2015 2016 2017 2018 2013 2018 2013 2018
Core Non Core
RAK Ceramics PJSC © 2019. All rights reserved
15INVESTOR PRESENTATION
Strategic initiatives 2019-2021
UAE • Build a manufacturing facility in Saudi Arabia, adding c.10mn sqm of low-cost production capacity
• Execute the turnaround strategy to scale revenues and enhance profitability, putting the company on-track to become a
top-5 ceramics player
• The turnaround positions the company as an export-hub catering to key markets in Europe and the Asia Pacific
INDIA • Priorities in 2019 include:
! Production expansion by ramping up commercial production at the recently acquired Morbi facilities
!Distribution: win project orders of scale from developers
!Production cost optimization
BANGLADESH • Maintain market leading position
• Achieve further scale through a strategic transaction, in order to unlock shareholder value
RAK PORCELAIN
(TABLEWARE) • The business is at a stage where it can achieve further scale through acquiring or partnering with strategic players to (i)
enter new markets, (ii) grow the product portfolio and/or (iii) add new distribution channels
IRAN PLANT • Maintain production at required levels, until sanctions are lifted
REAL ESTATE
• Aim to monetize the real estate portfolio by partnering to develop the sea-front land (book value: c.AED 900mn, size:
270,000 sqm) and Sell Acacia Hotel
RAK Ceramics PJSC © 2019. All rights reserved 16INVESTOR PRESENTATION
GCC expansion strategy 2019-2021
The Board has approved the construction of a secondary, low-cost manufacturing facility in Saudi Arabia. This will enable
the company to be more competitive in the commodity/fast-moving segments of regional and European markets
SITUATION BACK GROUND
The state-of-the-art production facility will utilize
the latest technology in ceramics manufacturing
• RAK Ceramics is facing the below challenges which are slowing down growth in core
profitability:
• a high cost of production from input costs in Ras al Khaimah
• transportation costs to end-markets, and ~US $100M ~2 YEARS
• increasing competition in export markets
Estimated time line of
• To increase profitability levels, low-cost manufacturing bases need to be established to Investment commissioning
allow company to be more competitive in the commodity/fast moving segment of key
markets such as Saudi Arabia, Europe and Africa.
• In February 2019, the Board of Directors approved the establishment of a Greenfield
manufacturing facility in Saudi Arabia RAS AL
• Saudi Arabia was selected as it has highest growth potential, given the expected SAUDI ARABIA
KHAIMAH
real estate and construction boom.
• Producing in Saudi Arabia at a lower cost will help bridge the gap between the
current net income run-rate and target earnings level US$ 10.91 US$1.62 Fixed
Gas price/MMBtu
Variable until 2039
• The specific location for the facility was evaluated based on:
• The quantity and cost of gas available
• Proximity to key-end markets Electricity price/
US0.13 US$0.05
KWH
• Availability of local raw materials
• The facility will have an initial production capacity of 10mn square meters per annum
Water price/m3 US$2.37 US$2.13
RAK Ceramics PJSC © 2019. All rights reserved 17INVESTOR PRESENTATION
GCC expansion strategy 2019-2021 (Cont’d)
The Saudi Arabian construction sector is expected to witness a recovery driven by a large number of infrastructure
projects, in line with the government’s aim to diversify the oil- based economy
TILES MARKET FORECAST IN SAUDI ARABIA
• The market is expected to witness moderate growth
to register a CAGR of 5.75% from 2017 to 2021, as the
2018-2022 VOLUME
construction sector in Saudi Arabia is expected CERAMIC TILE MARKET VOLUME AND MARKET VALUE 2013-2022
CAGR 5.75%
witness a modest recovery starting in 2019.
1,120 1,056 1,048 1,093 1,099
1,001 1,039 1,000
• The central and the western regions currently 934
831
contribute around 80% of the overall demand, which
is likely to continue over the medium term with the 235 244 263 248 203 219 234 246 256 258
majority of projects located in these regions.
2013 2014 2015 2016 2017 2018 2019 2020 2021 2022
• The central region currently has the largest share of
Volume (in m sqm) Value (USD m)
projects under construction mainly due to major
residential developments and Sudair Industrial City.
VALUE OF SAUDI ARABIA PROJECTS IN CONSTRUCTION AND PLANNING STAGE, BY REGION
• The mega-projects (NEOM, Red Sea Project)
announced as part of Vision 2030 are located mainly
in the north-west of the country Saudi. The 4% 3%
continuing renovation and expansion work in the 26%
Two Holy Cities of Makkah and Madinah mean that Central Region
Projects Eastern Region
demand will continue to grow in the west. 37% under 48%
Projects by
Western Region
planning stage
Construction Others
by Value
by Value Central Region 10%
Eastern Region 61%
Western Region
11% Others
Source:RAK Estimates on value, ACIMAC World Production & Consumption report 6 Ed. Oct 2018 Ventures onsite and VME Analysis Nov 2018. Please Note that 5.75% CAGR is subject to projects being executed without significant delay.
RAK Ceramics PJSC © 2019. All rights reserved 18INVESTOR PRESENTATION
Financial Performance
Overview Strategy Results
RAK Ceramics PJSC © 2019. All rights reserved 19INVESTOR PRESENTATION
Financial performance trend
FY 2018 RESULTS
REVENUE (AED BN) GROSS PROFIT (%)
26.0 28.2 30.5 31.6 33.2
Core revenue increased by +1.0% 3.3 3.1 2.8 2.9
2.8 30.5 30.3
32.5 33.3
30.6
28.2 29.3
0.5
in 2018 as a result of steady 0.5 0.4
0.2 0.1
22.6
21.2
growth in tiles by +0.4% and 16.7
strong growth in tableware by 2.8 2.6 2.4 2.6 2.6
+11.0% YoY driven by the United
states, Europe and Asian markets 2014 2015 2016 2017 2018
2014 2015 2016 2017 2018
Total revenue decreased by -2.8% Core Non-Core
Core Non-Core Total
YoY.
Total gross profit margin of EBITDA (AED MN) AND MARGIN (%) NET PROFIT (AED MN) AND MARGIN (%)
33.2%, +160bps compared to
315.5
2017, an all-time high. 584.4 594.1
281.7
310.3
533.4
485.7 461.6
Core gross margins increased 225.1
+80bps in 2018 despite increase
in energy and raw material prices. 17.8% 19.3% 17.4% 18.7% 16.6%
8.6% 10.1% 11.1% 8.1%
30.8
1.1%
2014 2015 2016 2017 2018 2014 2015 2016 2017 2018
RAK Ceramics PJSC © 2019. All rights reserved 20INVESTOR PRESENTATION
FY 2018 Highlights and challenges
2018 HIGHLIGHTS
NET PROFIT BRIDGE (AED M)
-28.7%
• Revenue growth in the UAE, India and AED 104.5MN
Tableware business
• Stable performance in Bangladesh
• Continued cost efficiencies, increasing +14.1
-38.6
gross profit margins
• Increased A- Grade production across all -55.0 -10.9
tile plants
• Iran Turnaround
• Robust performance in Tableware and 315.5 225.1
Kludi RAK
Growth in
Net Profit Net Gain on Gas Cost Non-core net Net Profit
Core
2018 CHALLENGES 2017 Sale of stakes increase profit 2018
performance
2017 reported net profit of AED 315.5mn included extraordinary gains of 38.6mn, related to the
• Europe profitability still struggling disposal of RAK Warehouse and Electro RAK
• India turnaround; despite revenue growth In 2018 reported net profit of AED 225.1mn (-28.7% YoY), is driven by:
in INR, gross profit margins were lower
-An AED 55.0mn increase in the company’s gas bill, with gas at an average price of $10.86/
than target owing to unabsorbed fixed mmbtu in 2018 (+27% YoY)
costs related to earlier plant shut-down
• Impact of Saudi Arabia integration -A reduction in non-core profit of AED 10.9mn, following the discontinuation of operations
(reduction in overheads) delayed at Al Hamra Construction (non-core asset)
• China exit still in progress -Growth in core business profitability of AED 14.1mn; driven by operational efficiency
improvements and higher gross profit in the UAE, Bangladesh and the Tableware business
RAK Ceramics PJSC © 2019. All rights reserved 21INVESTOR PRESENTATION
FY 2018 Performance by segment
FY 2018 RESULTS
REVENUE BY SEGMENT (AED MN)
2018 2017
Core revenue in 2018
increased by +1.0% due to Amount Amount Growth
strong performance in tiles and
tableware segments. Tiles 1,878.9 1,871.3 0.4%
Effective from 1st Jan 2018, revenue
recognition is changed as per IFRS 15. Sanitaryware 497.5 505.9 -1.7%
Based on dispatches core revenue
increased by +1.7% YoY. Tableware 264 237.8 11.0%
REVENUE BY SEGMENT 2018 (%)
Total Core 2,640.4 2,615.0 1.0%
4.9%
9.5%
Non-Core 135.8 239.9 -43.4%
17.9%
Tiles
Sanitaryware
67.7% Tableware
Non-core Total Revenue 2,776.2 2,854.9 -2.8%
RAK Ceramics PJSC © 2019. All rights reserved 22INVESTOR PRESENTATION
FY 2018 Performance by region
FY 2018 RESULTS
TILES & SANITARY WARE REVENUE BY REGION (AED MN)
2018 2017
UAE and Saudi Arabia markets Amount Amount Growth
are key drivers of growth year
UAE 792.8 754.5 5.1%
on year.
In local currency growth in India is Saudi Arabia 258.1 225.3 14.6%
+2.5%
Middle East 124.8 138.6 -9.9%
Due to election in December 2018 in
Bangladesh revenue in local currency
India 307.2 322.6 -4.8%
decreased -1.3%.
REGIONAL CONTRIBUTION 2018(%) Europe 352.1 368.9 -4.6%
Bangladesh 297.7 316.6 -6.0%
11%
12% Africa 87.2 125.0 -30.3%
UAE 33%
KSA
ME Rest of the world 156.5 125.6 24.6%
India 15%
Europe
Bangladesh 11% Total 2,376.4 2,377.1 -0.0%
Others 13% 5%
RAK Ceramics PJSC © 2019. All rights reserved 23INVESTOR PRESENTATION
Gross profit margins trend
FY 2018 RESULTS
GROSS PROFIT (%) TILES GROSS PROFIT (%)
26.0 28.2 30.5 31.6 33.2
Total gross margin increased by 30.5 30.3
32.5 33.3
30.6 28.0 28.5
29.3
+160bps YoY to an all time high of 28.2 24.4 24.6 24.8
33.2% 22.6
21.2
16.7
Core margin increased by +80bps YoY
to 33.3% driven by improvements in
operational efficiencies, higher gross
profits in UAE, Bangladesh and 2014 2015 2016 2017 2018
2014 2015 2016 2017 2018
tableware.
Core Non-Core Total
Margins improved despite an increase
of AED55m YoY in energy costs at an
average gas price of US$10.9/MMbtu.
SANITARYWARE GROSS PROFIT (%) TABLEWARE GROSS PROFIT (%)
RAKC is at significant disadvantage to its
peers as it pays a higher gas price, 45.4 43.5 41.3 40.3 61.4 61.0
however RAKC remains profitable. 39.2
56.1
50.1 52.0
RAKC would deliver higher core income
growth if gas costs were competitive;
management are developing a strategy
to address the situation.
2014 2015 2016 2017 2018 2014 2015 2016 2017 2018
RAK Ceramics PJSC © 2019. All rights reserved 24INVESTOR PRESENTATION
Tableware performance trend
FY 2018 RESULTS
REVENUE (AED MN) GROSS PROFIT MARGIN (%)
The tableware business
continues to show growth with
revenues increasing by +11.0% 264.0 61.4% 61.0%
237.8 56.1%
YoY to AED 264m driven by 175.0
50.1% 52.0%
145.8
growth in United States, 35.1
Europe and Asian markets. 2014* 2015 2016 2017 2018 2014* 2015 2016 2017 2018
Strategic focus on growth in Europe
and United States.
US Market growth in progress.
NET PROFIT (AED MN) AND MARGIN (%) EBITDA (AED MN) AND MARGIN (%)
Opened new flagship showroom in Ras
54.6 56.0 63.1
al Khaimah , UAE and distribution 49.3 59.7
53.0
center in Pennsylvania, USA. Frankfurt
61.8% 63.2%
showroom is operational. 34.1 37.5
Logistics centre under construction in 21.7
28.2% 22.2 30.3%
23.4% 22.9% 25.7% 25.1% 23.9%
21.2%
Luxembourg, full benefits from these
investments in Q2 2019.
2014* 2015 2016 2017 2018 2014* 2015 2016 2017 2018
*Consolidated from Q4 2014
RAK Ceramics PJSC © 2019. All rights reserved 25INVESTOR PRESENTATION
Balance sheet evolution
FY 2018 RESULTS
RETURN ON EQUITY (%) OPERATING CYCLE (DAYS)
11.4 281
10.4 262 280
Return on equity is 8.1% in 9.0
218 225
8.1
2018. 180 188 214 227 246
Operating Cycle is stable at 280 days. 7.1 120
(Adjusted)
107 108 110 108
Payable days has also increased from -69 -71 -62 -66 -74
1.1
66 days in 2017 to 74 days in 2018. 2014 2015 2016 2017 2018
2014 2015 2016 2017 2018
Capex in 2018 is higher due to Co- Payable days Receivable Days Inventory Days
Gen plants installation and in India JV
plants.
Capex guidance for 2019 is ~AED
CAPEX SPENDING (AED M) NET DEBT (AED M)
250mn including ~AED 125mn for 3.4 3.1
Maintenance. 282 267 2.4 2.7 2.6
215 244
141 139 94
92
98
1,660
141 150 1,610
129 123 83
15
2014 2015 2016 2017 2018 1,421 1,408 1,429
2014 2015 2016 2017 2018
Growth Maintenance Net debt Net debt to EBITDA
RAK Ceramics PJSC © 2019. All rights reserved 26INVESTOR PRESENTATION RAK Ceramics PJSC © 2019. All rights reserved 27
You can also read