AT&S First choice for advanced applications - Investor and Analyst Presentation H1 2020/21 - AT&S
←
→
Page content transcription
If your browser does not render page correctly, please read the page content below

AT&S
First choice for advanced applications
               Investor and Analyst Presentation
                                     H1 2020/21

            AT & S Austria Technologie & Systemtechnik Aktiengesellschaft | Fabriksgasse 13 | A-8700 Leoben
                                                                                      Tel +43 (0) 3842 200-0
                                                                                          www.ats.net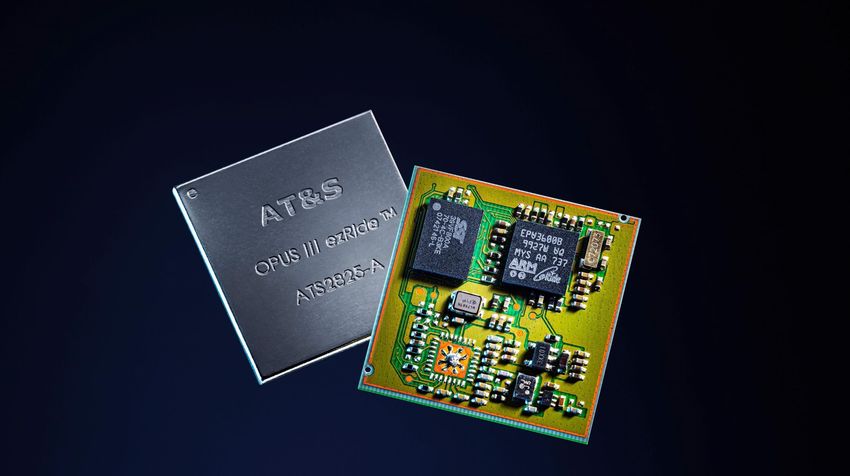
COMPANY OVERVIEW
AT & S Austria Technologie & Systemtechnik Aktiengesellschaft | Fabriksgasse 13 | A-8700 Leoben
                                                                          Tel +43 (0) 3842 200-0
                                                                              www.ats.net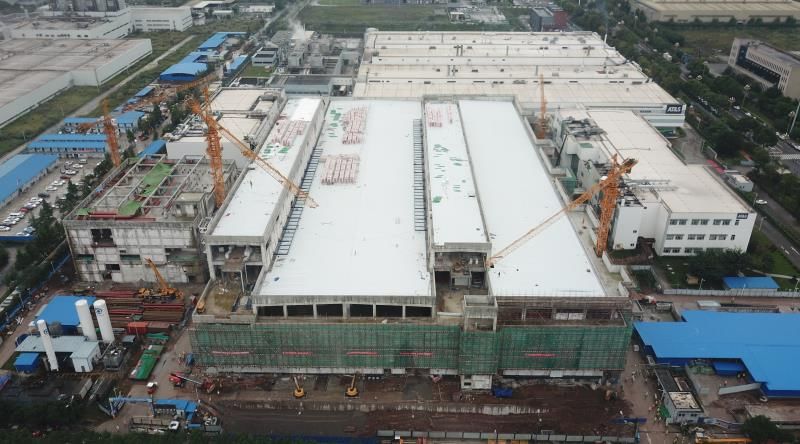
A world leading high-tech PCB & IC substrates company
                                                  Outperforming
     High-end interconnect solutions
                         for                      market growth
      Mobile Devices, Automotive, Industrial,
      Medical Applications and Semiconductor
                                                   over the last                  #2
                                                     decade            high-end PCB producer
                      Industry
                                                                             worldwide*

             Among the top                      € 1bn
               PCB producers                    revenue in
                 worldwide                      FY 2019/20           Efficient global production
                                                                            footprint with

                                                                                6
                                                      ~ 10,000       plants in Europe and Asia

                                                       Employees**
 *  For CY 2019
    Source: Prismark
 ** For AT&S FY 2019/20
Investor and Analyst Presentation                                                                  2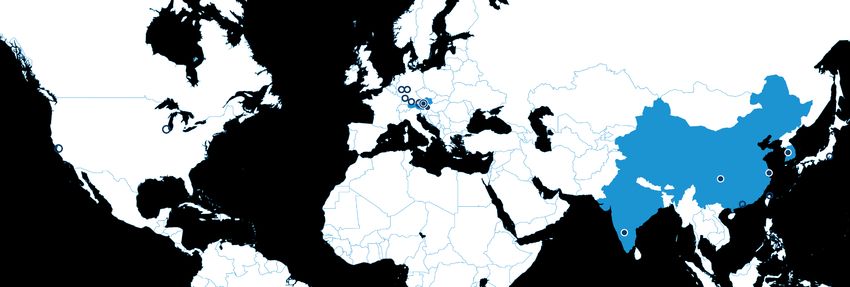
Leading provider of high-end PCBs and IC substrates
Well positioned for the future
Unique market position
Broad product portfolio to serve all growth markets
Long-standing customer relationships with technology and market leaders
Technology innovator due to continuous R&D efforts
Quality benchmark with outstanding process know-how, productivity and efficiency
Growth oriented strategy
Megatrend-driven markets with attractive growth potential
Address growth opportunities with incremental investments
Sustainable profitability
AT&S has constantly outperformed the PCB and substrates market over the last years
EBITDA margin of 20 – 25% above industry average
Strong cash flow generation and therefore improved internal financing capabilities
Solid balance sheet and attractive dividend policy
Investor and Analyst Presentation 3 3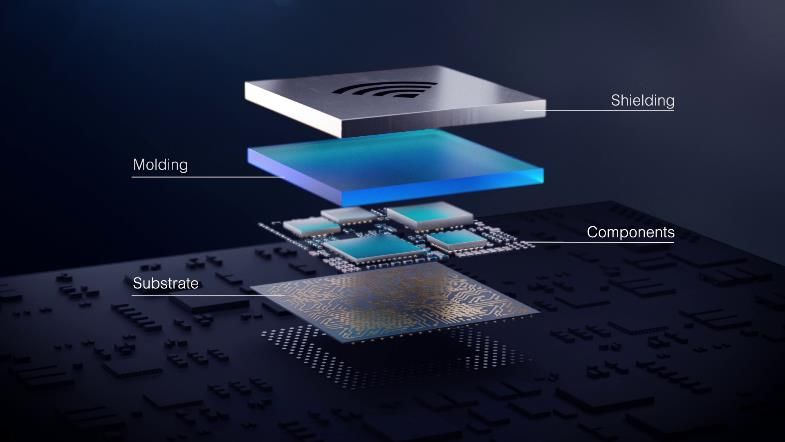
4
    Market Segments & Product Applications

          Computer,
        Communications,                      IC substrates          Automotive                        Industrial                 Medical
      Consumer Appliances
       Smartphones, Tablets,               High Performance        Advanced Driver               Machine-2-Machine                Patient
       Wearables, Ultrabooks,            Computer, Microserver    Assistance Systems,             Communication,          Monitoring, Hearing Aids,
             Cameras                                             Emergency-Call, X2X              Robots, Industrial           Pacemaker,
                                                                    Communication                    Computer,            Neurostimulation, Drug
                                                                                                 X2X Communication         Delivery, Prosthesis

                Segment Mobile Devices & Substrates                             Segment Automotive, Industrial, Medical

    Investor and Analyst Presentation                                                                                                                 4
Key facts FY 2019/20
                                                                                                     Revenue split by segment: FY 2019/20

                                            +7% CAGR
                                                               1,028.0                                 31%
                                            991.8                                 1,000.6
                                                                                                                                          Mobile Devices & Substrates
                       814.9                                              24.3%
   762.9                                                                                                                   69%
                                                                                                                                          Automotive, Industrial, Medical
             22.0%                                     22.8%

                                                                                             19.4%

                                    16.1%                                                            Revenue split by customer: FY 2019/20
                                                     226.0               250.1
           167.5                                                                            194.5    (based on customer’s headquarters)
                               130.9*
                                                                                                                8%
                                                                                                          8%                               Americas
      2015/16             2016/17              2017/18           2018/19            2019/20
                                                                                                      16%                                  Germany/Austria
           Revenue                    EBITDA                 EBITDA margin                                              7%68%              Asia
                                                                                                                                           Other European countries
                                                                                                                                                            5

 € in millions
 *Based on ramp-up effects for new plants in China
Investor and Analyst Presentation                                                                                                                                           5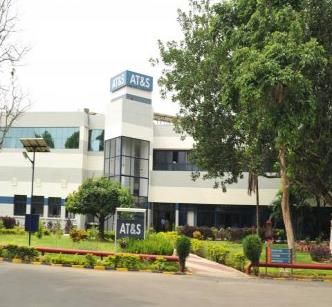
Global footprint ensures proximity
   to supply chain & cost efficiency

   AT&S plant
   AT&S sales support office
   AT&S Headquarters

                       1,031*                              392*                    1,322*               3,305*              4,476*           248*

Leoben, Headquarters              Fehring                              Nanjangud            Chongqing            Shanghai            Ansan
Austria                           Austria                              India                China                China               Korea
   *Staff, Average, FTE, H1 2020/21; 80 employees in other locations
   Investor and Analyst Presentation                                                                                                           6
7

    Market players in the high-end segment

                                 Market position HDI Technology (2019)
                                                                             HDI
      Rank                  Supplier             Country/Region
                                                                  (revenue in US-$ millions)
        1              Compeq                    TWN                        776
        2              AT&S                      AUT                        736
        3              TTM                       USA                        716
        4              Unimicron                 TWN                        706
        5              Tripod                    TWN                        508
        6              Meiko                     JPN                        461
        7              Zhen Ding                 TWN                        428
        8              Korea Circuit             KOR                        227
        9              Founder PCB               CHN                        222
        10             CMK                       JPN                        220

    Source: Prismark, AT&S Market Intelligence

    Investor and Analyst Presentation                                                          7
Strategic focus on high-end technologies

                                                                              AT&S revenue structure – based on technologies

                                                                                     High-end technology share > 80%*
                                                                                          HDI and any-layer PCBs,
                                                                                         Embedding, IC substrates
                                               High-end
                                             HDI PCBs and
                                             IC substrates
                                                 ~ 30%
                                                                                           Complementary technology
                                                                                                share: < 20%*
                                                                                                 SS, DS, ML,
                         Single-sided (SS), double-sided (DS), multilayer- (ML),
                                                                                                   Flex, RF
                                       flex and rigid-flex (RF) PCBs
                                                   ~ 70%

           Structure of general PCB market – based on technologies
* for FY 2019/20
Source: Prismark, AT&S
Investor and Analyst Presentation                                                                                              8
R&D as the key for technological leadership

           9.5%
           R&D Quota
   (equivalent to € 94.8 million)
                                                 326
                                                  Patents

                                                                               International
                                                                               R&D Partners

           R&D                                 30.8%
        Headquarters                     Innovation Revenue Rate *
           Austria
 Industrialization at the respective
          production site

 as of FY 2019/20
 * Revenue generated with products with new, innovative technologies introduced to the market within the last three years

Investor and Analyst Presentation                                                                                           9
More than AT&S
Broadening the service range and opening up of new business opportunities
Leading
provider of
interconnect
Technology solutions
Innovation power
Module integration
Clear focus on dedicated applications
services
Build-up of additional
capabilities
Substrates for HPC
modules
Diversification of
PCBs/substrates application and
for modules customer portfolio
mSAP / SLP High growth
potential
IC substrates Technology leader
Printed circuit boards
One of the leading
Leading producer of high- producers
end PCB
Investor and Analyst Presentation 10MARKET UPDATE & GROWTH DRIVERS
AT & S Austria Technologie & Systemtechnik Aktiengesellschaft | Fabriksgasse 13 | A-8700 Leoben
Tel +43 (0) 3842 200-0
www.ats.netPCB & IC Substrates market outlook
+4.7% 76.6
+3.9% 10.0
Consumer 58.0 +2.5% 16.9
Computer 8.0
Communication
Substrates 14.5
Medical +5.5% 23.7
Industrial
Aviation 17.2
+11.4%
9.3
Automotive +3.0%
4.8 +3.1% 1.5
1.3 +2.4% 3.1 3.2
2.6 2.7 +4.5%
6.8 8.9
in US-$ billion
Source: Prismark, April 2020; Substrate: Yole, May 2019 C 2019
Y 2019 CAGR C Y 2025
2025
Investor and Analyst Presentation 12Game changers for innovative applications
5G Big data AI IoT
Investor and Analyst Presentation 135G – The new standard for connectivity
Significant growth opportunities ahead
Total smartphones 5G smartphones
2025: 1.52 billion units
2025: 907 million units
2019: 1.37 billion units
2019:
16 million units
+1.7% CAGR +119% CAGR
Source: IDC (2020), AT&S Analysis
Investor and Analyst Presentation 14High-end IC substrates
IC substrates for AI,
autonomous driving
…have larger form factors due to more powerful 10-20 layers
processors modules IC substrates for
PCs, servers
…have more build-up layers IC substrates for 4-6 layers
mobile devices
…have a high speed interconnect between several 2-4 layers
semiconductors to provide high speed data
transmission
…enable more complex packages than standard
substrates
…reduce power consumption
High-end IC substrates market growth Added Value for AT&S
…push technology portfolio, profitability and revenue
2019: US-$ 4.8 billion growth to a next level (mid-term: revenue target of € 2
2025: US-$ 9.3 billion billion, EBITDA margin of 25-30%)
(+11.4% CAGR) …and thus increase value for AT&S,
Source: Yole (2019)
its customers and shareholders.
Investor and Analyst Presentation 15On the way to become one of the leaders in high-end IC substrates Investor and Analyst Presentation 16
IC substrates business in Chongqing
Capacity expansion and technology investment pushed forward
CHQ I: Despite COVID-19 new
ABF substrates output capacity capacities successfully ramped-up
500%
Full capacity almost reached
1.4x CHQ I: about 50% of additional
360%
1.6x capacity out of phase II will be
220%
190% 1.2x reflected in revenues in 2020/21
100% 1.9x
CHQ III: Roof closing already
completed
FY 2019/20 FY 20 20/21
Covid-19 related construction delay
of about six weeks
Start main building
structure CHQ III Equipment move
in and installation
Process and equipment
characterization
Certification Full capacities on
stream
Optimized infrastructure installation
plan as well as the experience from
CHQ I can compensate for the
of phase II (CHQ I)
Decision for IC substrates Additional capacities out Additional capacities out
expansion for HPC of phase III (CHQ III) construction delay
Chongqing I Chongqing III
Investor and Analyst Presentation 17Top-8 global ABF* substrates suppliers
AT&S expects to enter the top-league of ABF substrates suppliers and
significantly increase output capacity by 2025
Output capacity by company (based on US-$)
30% ABF is the state-of-the-art
25% production process for high-end
20%
IC substrates with high growth
potential
15%
With current investments, AT&S
10% will rise to the top three ABF
5% suppliers globally by 2025
0%
AT&S
2019
2025
*ABF: Ajinomoto Buildup Film
Source: Prismark, JMS, AT&S assessment
Investor and Analyst Presentation 18Module business Investor and Analyst Presentation 19
Update Chongqing II
Well on track to become AT&S competence center for module business
Full expansion of plant proceeds according to plan
Total investment Chongqing II in module business of about
€ 160 million over the next 2 – 3 years
Long-term customer relationships support application
diversification
Main applications include PCBs for RF/5G modules, power
modules and wearables
Module PCB/substrates expected to reach ~5 – 10% of
group revenues within the next two years
For FY 2020/21 already double-digit million revenue expected
Based on business development so far revenue target can
be confirmed
Investor and Analyst Presentation 20AT&S solutions for the electronics industry
New business opportunities through entry into the module market
Module Design Chip Chip Assembly & PCB Substrate Product/ Product
Manufacturing Test Manufacturing Manufacturing Module Ownership
(Front-end) (Back-end) Assembly
Design 02
Module Integration Service Provider
houses
01
OEMs
Module Board Manufacturer (SLP)
00
Fab-less OSATs ODM/EMS/
Wafer Foundries OEMs
IC Players OSATs
PCB
21
Investor and Analyst Presentation 21H1 2020/21 – FINANCIALS AND KEY FIGURES
AT & S Austria Technologie & Systemtechnik Aktiengesellschaft | Fabriksgasse 13 | A-8700 Leoben
Tel +43 (0) 3842 200-0
www.ats.netGlobal market development Long-term trends intact and driven by increasing digitalization Rising data traffic, Internet of Things and enhanced connectivity are pushing digital networking across all areas of life and work IoT and big data drive the need for processor modules and therefore high-end IC substrates Trade frictions constantly cause uncertainty Visibility in Mobile Devices has become better supported by new 5G model introductions Automotive market shows signs of bottoming out, situation expected to improve further Industrial investment activity remains moderate Medical market stable with positive demand for special applications Investor and Analyst Presentation 23 23
Development in H1 2020/21 AT&S with positive performance despite challenging environment IC substrates business profits from successful ramp-up of new capacities in CHQ I and strong demand for ABF substrates Customer and application diversification compensates for delayed smartphone launches in Mobile Devices Decrease in vehicle sales weighs on Automotive segment, but sequentially improved Industrial segment profits from better product mix Medical & Healthcare with solid demand in Q2, but could not compensate for Q1 development Investor and Analyst Presentation 24 24
Revenue and EBITDA development
537.8
490.3 Strong revenue increase despite slightly
negative currency effects
EBITDA increased to € 111.2 million (PY: €
101.1 million) supported by higher revenue
267.6 263.0
289.9
Future technology generations require
247.3 247.9 higher R&D spending
24.7%
24.7% 21.0% 20.6% 20.7% Net profit lower at € 14.7 million (PY: € 19.5
15.9%
million) driven by currency effects and
111.2
15.4% 101.1 negative interest result
66.2 71.7
55.2
38.1 39.5
Operating free cash flow at € -112.1 million
(PY: € -29.8 million) due to higher investment
Q2 Q3 Q4 Q1 Q2 H1 H1 activity
2019/20 2019/20 2019/20 2020/21 2020/21 2019/20 2020/21
Revenue EBITDA EBITDA margin
in € millions
Investor and Analyst Presentation 25Revenue distribution H1 2020/21
Revenue split by segment Revenue split by region
based on customer’s headquarters
6%
10%
25%
12%
75% 72%
Mobile Devices & Substrates Automotive, Industrial, Medical Americas Germany/Austria Asia Other European countries
26
Investor and Analyst Presentation 26 26Business development – Mobile Devices & Substrates
55,0%
405.6 IC substrates performance above
50,0% expectations driven by strong ABF demand
329.8 45,0% and better product mix
40,0% Customer and application diversification
compensates for delayed smartphone
218.5 35,0%
launches in Mobile Devices
186.0 190.1 187.2
166.0
30,0%
26.0% 26,8%
23.7%
20.9%
22.8% 25,0%
101.2
79.2 20,0%
15.6% 18.1% 64.2
55.4 55.4
29.4 37.0 15,0%
10,0%
Q2 Q3 Q4 Q1 Q2 H1 H1
2019/20 2019/20 2019/20 2020/21 2020/21 2019/20 2020/21
Revenue with external customers EBITDA EBITDA Margin*
in € millions; *Margin calculated from total business unit revenue
Investor and Analyst Presentation 27Business development – Automotive, Industrial, Medical
180 25,0%
160.6 Industrial segment with satisfying
160
development supported by better product
140 132.1 20,0% mix
120 Automotive segment impacted by decrease
15,0% in vehicle sales, but sequentially improved
100
81.6 81.3
80 72.9 71.4
Medical & Healthcare with flat revenue
10.6%
60.7 10,0% development in Q2
60 7.7%
8.8%
6.1%
Profitability lower due to decreased demand,
40 6.5% 5,0% underutilization of related production
5.3%
4.3% 18.9
20 9.4
facilities and resulting lower fixed cost
8.0 4.8 6.3
5.2 3.1 coverage
0 0,0%
Q2 Q3 Q4 Q1 Q2 H1 H1
2019/20 2019/20 2019/20 2020/21 2020/21 2019/20 2020/21
Revenue with external customers EBITDA EBITDA margin*
in € millions; *Margin calculated from total business unit revenue
Investor and Analyst Presentation 28Net CAPEX
Investments in IC substrates and module business to be consistently continued
up to 520
Investments in IC substrates and technology
upgrades still driver for increase
Capex outlook 2020/21:
Depending on market developments CAPEX
for maintenance and tech-upgrade of up to
240.7 € 80 million
218.5 CAPEX for strategic projects of up to € 410
195.7
million plus € 30 million due to timing
141.7 variances
100.8 92.0
2016/17 2017/18 2018/19 2019/20 2020/21e H1 H1
2019/20 2020/21
in € millions
Investor and Analyst Presentation 29Balance Sheet
31.03.2020 30.09.2020 Change in %
Total assets € million 1,853.5 2,020.0 9.0%
Equity € million 760.3 730.4 (3.9%)
Equity ratio % 41.0% 36.2% –
Net debt € million 246.7 380.0 54.0%
Investor and Analyst Presentation 30Cash flow
30.09.2019 30.09.2020 Change in %
Cash flow from operating activities € million 62.2 83.6 34.4%
Cash flow from investing activities € million -97.3 -238.2 >100%
Cash flow from financing activities % -36.9 101.8 -
Free operating cash flow € million -29.8 -112.1 >100%
Investor and Analyst Presentation 31Solid finance structure
Existing funds and cash flow generation help to meet repayments and capex needs
High level of existing liquid funds
951.7
Cash: € 348.5 million
Financial assets: € 177.7 million
425.5 Additional unused credit lines of € 425.5 million
Future cashflow still to be considered
Clearly improved financial network
340.4
526.2
79.7 96.3
62.8 44.9
2020/21* 2021/22 2022/23 2023/24 2024/25
in € million Repayments Cash & Financial Assets Unused credit lines
*as of 30.09.2020
Investor and Analyst Presentation 32OUTLOOK
AT & S Austria Technologie & Systemtechnik Aktiengesellschaft | Fabriksgasse 13 | A-8700 Leoben
Tel +43 (0) 3842 200-0
www.ats.netOutlook for 2020/21 AT&S has managed crisis successfully and positively participates in intact trends Future trends not harmed by COVID-19 pandemic Expectations for customer demand for the current year Demand for IC substrates remains strong according to current forecasts Due to delayed product launches, demand for mobile devices shifted into FQ3, usual seasonality expected for FQ4 Automotive market shows signs of bottoming out, slightly positive trend visible Industrial segment to remain at the level of previous year Slight growth expected for medical applications FY 2020/21: Revenue growth of around 15% and an EBITDA margin in the range of 20 to 22% Based on strong H1, a solid order situation in FQ3 and successful ramp-up of additional capacities in CHQ I Assuming no major impact of COVID 19 on key markets, production facilites and supply chain Investment programme for FY 2020/21 unchanged 26. Hauptversammlung, 9. Juli 2020 34
Medium-term guidance confirmed
Technology development to module integration and capacity expansion
Expansion of technology leadership
Leading provider of new interconnect solutions
Innovation revenue rate: > 20%
Focus on continued profitable growth
Revenue target of € 2 billion
Prosecution of sustainable margin improvement
First choice
Medium-term EBITDA margin target of 25-30%
for advanced
applications Creation of shareholder value and robust financial structure
Medium-term ROCE above 12%
Net debt / EBITDA: < 3 / Equity ratio: > 40% / Average Finance costs: < 2%
Sustainability management
80% renewable energy
Eco-balancing of product groups
30 % women in management positions
26. Hauptversammlung, 9. Juli 2020 35ANNEX
AT & S Austria Technologie & Systemtechnik Aktiengesellschaft | Fabriksgasse 13 | A-8700 Leoben
Tel +43 (0) 3842 200-0
www.ats.netAT&S – Stock Profile
Listing: Vienna Stock Exchange, # of shares outstanding 38.85m
Prime Standard Dividend for 2019/20: € 0.25 per share
Indices: ATX, Vönix, WBI
Thomson Reuters (A): ATSV.VI
Bloomberg (A): ATS:AV
Financial Calendar Shareholder structure
Publication of the first three quarters 2020/21 02 February 2021
Publication Preliminary Annual Results 2020/21 18 May 2021 17.6%
18.0%
Free Float 64.4%
Dörflinger Private Foundation*
Androsch Private Foundation* *including direct and indirect holdings
Investor and Analyst Presentation 37Key credit figures
Gross debt, financial assets and cash, net debt Net debt/EBITDA
801
717
593 2.9
523 540
567 554
381
1.6
263 247 1.3
209331
0.9
260 150 0.6
212
2016/17 2017/18 2018/19 2018/19 2019/20 2015/16 2016/17 2017/18 2018/19 2019/20
Gross debt Financial assets and cash Net debt
€ in millions Multiple
Net debt increase due to higher financial liabilities Target: < 3x
Investor and Analyst Presentation 38AT&S Product Portfolio – I
ECP®: IC substrates Substrate-like printed circuit boards
Embedded Component Packaging mSAP
Embedded Component Packaging allows to embed IC substrates serve as interconnection platform with Substrate-like PCBs (mSAP technology) are the next
active/passive components (e.g. wafer level dies) within higher density (Line/Space < 15 micron) between evolution of high-end HDI PCBs with higher density:
the layers of a PCB – contributes to miniaturization. semiconductors (Chips) & PCBs . Line/Space < 30 micron.
Production site
Leoben, Shanghai Chongqing Chongqing, Shanghai
Applications
Devices such as smartphones, tablets, digital High-end processors for Mobile applications like smartphones
cameras and hearing aids Computer, Communication, Automotive, Industrial
Investor and Analyst Presentation 39AT&S Product Portfolio – II
HDI HDI microvia printed Multilayer printed circuit Double-sided printed IMS printed circuit boards
any-layer printed circuit circuit boards – high boards circuit boards – insulated metal
boards density interconnect substrate
Further technological HDI: high density interconnect, Found in almost every area of Used in all areas of electronics. IMS: insulated metal substrate.
enhancement to HDI microvia: meaning industrial electronics. AT&S AT&S focuses on double-sided Primary function: heat
All electrical connections in HDI laser-drilled connections produces printed circuit boards printed circuit boards with dissipation for use mainly with
any-layer boards consist of laser- (microvias). HDI is first step with 4 to 28 layers, in quantities thicknesses in the range of 0.1- LEDs and power components.
drilled microvias. Advantage: towards miniaturization. from individual prototypes to 3.2mm.
further miniaturization, and AT&S can produce 4-layer small batches and mass
higher performance and laser PCBs up to 6-n-6 production.
reliability. AT&S produces HDI HDI multi layer PCBs.
any-layer in 4 to 12 layers.
Production site
Shanghai Shanghai, Leoben Leoben, Nanjangud, Fehring Fehring, Nanjangud Fehring
Applications
Smartphones, Tablets, Mobile phones and nearly all Used in all electronic Primarily industrial and Lighting industry
Notebooks electronic applications including applications including touch automotive applications
automotive (navigation, panels, and in products ranging
infotainment and driver from aircraft to motorcycles,
assistance systems) from storage power plants to
solar arrays
Investor and Analyst Presentation 40AT&S Product Portfolio – III
Flexible printed Semi-flexible printed Rigid-flex printed Flexible printed circuit AT&S patented
circuit boards circuit boards circuit boards boards on aluminum technologies
ECP®: Embedded
Component Packaging
ECP® is a patented AT&S packaging
technology used to embed active
and passive electronic components
in the inner layers of a printed circuit
board. ECP® technology is used in
ever smaller, more efficient and
Used to replace wiring and More limited bend radius than Combine the Used when installing LEDs more powerful devices, such as
connectors, allowing for flexible printed circuit advantages of flexible in car headlights, for smartphones, tablets, digital
connections and geometries that boards. The use of a and rigid printed circuit example, where the cameras and hearing aids.
are not possible with rigid standard thin laminate boards, yielding benefits printed circuit board is Production sites: Leoben, Shanghai
printed circuit boards. makes them a cost-effective for signal transmission, bonded to an aluminum
alternative. size and stability. heat sink to which the
2.5D® Technology
LEDs are then attached.
Platform
Combines mechanical and electronic
miniaturization, and enables partial
Production site reduction of the thickness of a
Ansan, Fehring Fehring Ansan Ansan circuit board. Advantage: populated
assemblies have a thinner profile.
Can be also used to make cavities in
Applications the printed circuit board, e.g. for
Nearly all areas of Automotive applications Industrial electronics, Lighting, automotive, acoustic channels. Major application
electronics, including such as production building lighting for this technology is the 2.5D® rigid-
measuring devices and machines and industrial flex printed circuit board, a lower
medical applications robots cost alternative for flex-to install
applications.
Production sites: Leoben, Shanghai
Investor and Analyst Presentation 41Milestones in the Group’s history
1987 1994 1999 2002
Founding of the Group, emerging Privatization and Initial public offering on Frankfurt Stock Exchange Start of production at new Shanghai
from several companies owned by acquisition by Messrs („Neuer Markt“). Acquisition of Indal Electronics facility – one of the leading HDI
the Austrian State Owned Androsch, Dörflinger, Zoidl Ltd., largest Indian printed circuit board plant production sites in the world
Industries (Nanjangud) – today, AT&S India Private Limited
2010 2009 2008
Start of production New production direction: Austrian AT&S change
at plant II in India plants produce for high-value niches to Vienna Stock
in the automotive and industrial
segment; Shanghai focuses on the
Exchange 2006
high-end mobile devices segment Acquisition of Korean
flexible printed circuit
board manufacturer,
2011 2013 Tofic Co. Ltd. – today,
Construction starts on new AT&S enters the IC substrate AT&S Korea Co., Ltd.
plant in Chongqing, China market in cooperation with a
Capacity increase in leading manufacturer of
Shanghai by 30% semiconductors
2018 2019
Start of the second Start construction
2015 2016 2017 expansion phase at of plant 3 in
AT&S again achieves record high sales and AT&S starts serial production Successful introduction and plant 1 in Chongqing Chongqing for IC
earnings for financial year 2014/15 and of IC substrates at the plant optimisation of the mSAP technology substrates
decides to increase the investment program in in Chongqing in Shanghai and Chongqing
Chongqing from € 350 million to € 480 million
Investor and Analyst Presentation 42Thank you
for your attention!
AT & S Austria Technologie & Systemtechnik Aktiengesellschaft | Fabriksgasse13 | A-8700 Leoben
Tel +43 (0) 3842 200-0
www.ats.net 43Disclaimer This presentation is provided by AT & S Austria Technologie & Systemtechnik Aktiengesellschaft, having its headquarter at Fabriksgasse 13, 8700 Leoben, Austria (“AT&S”), and the contents are proprietary to AT&S and for information only. AT&S does not provide any representations or warranties with regard to this presentation or for the correctness and completeness of the statements contained therein, and no reliance may be placed for any purpose whatsoever on the information contained in this presentation, which has not been independently verified. You are expressly cautioned not to place undue reliance on this information. This presentation may contain forward-looking statements which were made on the basis of the information available at the time of preparation and on management‘s expectations and assumptions. However, such statements are by their very nature subject to known and unknown risks and uncertainties. As a result, actual developments, results, performance or events may vary significantly from the statements contained explicitly or implicitly herein. Neither AT&S, nor any affiliated company, or any of their directors, officers, employees, advisors or agents accept any responsibility or liability (for negligence or otherwise) for any loss whatsoever out of the use of or otherwise in connection with this presentation. AT&S undertakes no obligation to update or revise any forward-looking statements, whether as a result of changed assumptions or expectations, new information or future events. This presentation does not constitute a recommendation, an offer or invitation, or solicitation of an offer, to subscribe for or purchase any securities, and neither this presentation nor anything contained herein shall form the basis of any contract or commitment whatsoever. This presentation does not constitute any financial analysis or financial research and may not be construed to be or form part of a prospectus. This presentation is not directed at, or intended for distribution to or use by, any person or entity that is a citizen or resident or located in any locality, state, country or other jurisdiction where such distribution, publication, availability or use would be contrary to law or regulation or which would require any registration or licensing within such jurisdiction. Investor and Analyst Presentation 44
You can also read