INVESTOR PRESENTATION - FOR THE SIX MONTHS ENDED 31 MARCH 2019 - Oceana Group
←
→
Page content transcription
If your browser does not render page correctly, please read the page content below
INVESTOR PRESENTATION
FOR THE SIX MONTHS ENDED 31 MARCH 2019

                                         1
LEGAL DISCLAIMER AND BASIS OF PREPARATION
•   For the purposes of this notice, the presentation (the “Presentation”) shall mean and include the slides that follow, the oral presentation of the slides by Oceana Group Limited (the “Company”) and/or its advisers, any question-
    and-answer session that follows that oral presentation, hard copies of this document and any materials distributed at, or in connection with, that oral presentation. By attending the meeting at which the Presentation is made,
    or by reading the Presentation slides, you will be deemed to have (i) agreed to all of the following restrictions and made the following undertakings and (ii) acknowledged that you understand the legal and regulatory sanctions
    attached to the misuse, disclosure or improper circulation of the Presentation.
•   This Presentation is provided to you solely for information purposes and its contents are confidential and may not be reproduced, redistributed, published or passed on to any person, directly or indirectly, in whole or in part, for
    any purpose. The maintenance of the absolute secrecy of the information contained in the Presentation is of paramount importance to the Company. If this Presentation has been received in error, it must be returned
    immediately to the Company.
•   Your obligations as set out in this notice will continue in respect of the information contained in the Presentation until such time as, and then only to the extent that, any such information is made available to the public. The
    Company may not be making the information contained herein public, except to the extent required by law or regulation. If this is not acceptable to you, you should not receive the information contained in the Presentation.
•   This Presentation is not directed to, or intended for distribution to or use by, any person or entity that is a citizen or resident of, or located in, any locality, state, country or other jurisdiction where such distribution or use would
    be contrary to law or regulation or which would require any action (including registration or licensing) within such jurisdiction for such purpose.
•   This Presentation is not an offer of securities for sale in the United States of America ("United States"). The Company’s securities may not be offered or sold in the United States except pursuant to an exemption from, or
    transaction not subject to, the registration requirements of the United States Securities Act of 1933.
•   This Presentation does not constitute an offer to the public for the sale of or subscription for, or an advertisement or the solicitation of an offer to buy and/or subscribe for, securities as defined in the South African Companies
    Act, 2008 as amended (the "Act") or otherwise, and will not be distributed to any person in South Africa in any manner which could be construed as an offer to the public in terms of the Act. Furthermore, this Presentation does
    not constitute an advertisement or a prospectus registered and/or issued under the Act.
•   This Presentation is directed solely at (i) persons outside the United Kingdom of Great Britain and Northern Ireland, or (ii) persons with professional experience in matters relating to investments falling within Article 19(5) of the
    Financial Services and Markets Act 2000 (Financial Promotion) Order 2005 as amended (the “Order”), (iii) high net worth entities, and other persons to whom it may lawfully be communicated, falling within article 49(2)(a) to (d)
    of the Order and (iv) persons to whom an invitation or inducement to engage in investment activity (within the meaning of section 21 of the Financial Services and Markets Act 2000) in connection with the issue or sale of any
    securities of the Company or any member of its group may otherwise lawfully be communicated or caused to be communicated (all such persons in (i)-(iv) above being “relevant persons”). Any investment activity to which this
    Presentation relates will only be available to, and will only be engaged with, relevant persons. Any person who is not a relevant person should not act or rely on this Presentation.
•   This Presentation does not constitute or form part of, and should not be construed as, an advertisement, invitation, solicitation and/or offer to sell, issue, purchase or subscribe for, any shares and/or securities in the Company
    or any of its subsidiaries in any jurisdiction, or an inducement to enter into investment activity. No part of this Presentation, nor the fact of its distribution, should form the basis of, or be relied on in connection with, any
    contract or commitment or investment decision whatsoever. No representation, warranty or undertaking, express or implied, is made as to, and no reliance should be placed on, the fairness, accuracy, completeness or
    correctness of the information or the opinions contained herein. None of the Company or any of its affiliates, advisers or representatives shall have any liability whatsoever (in negligence or otherwise) for any loss howsoever
    arising from any use of this Presentation or its contents or otherwise arising in connection with the Presentation.
•   The information contained herein has been prepared using information available to the Company at the time of preparation of the Presentation. External or other factors may have impacted on the business of the Company and
    the content of this Presentation, since its preparation. In addition all relevant information about the Company may not be included in this Presentation. The information in this Presentation has not been independently verified.
    No representation or warranty, expressed or implied, is made as to the accuracy, completeness or reliability of the information contained herein and no reliance should be placed on such information. Neither the Company, nor
    any of its advisers, connected persons or any other person accepts any liability for any loss howsoever arising, directly or indirectly, from this Presentation or its contents.
•   This Presentation contains forward-looking statements, which include all statements other than statements of historical facts, including, without limitation, any statements preceded by, followed by or including the words
    “targets”, “believes”, “expects”, “aims”, “intends”, “may”, “anticipates”, “would”, “could” or similar expressions or the negative thereof. Forward-looking statements by their nature involve known and unknown risks,
    uncertainties, assumptions and other important factors because they relate to events and depend on circumstances that might occur in the future whether or not outside the control of the Company. Such factors may cause the
    Company’s actual results, performance or achievements to be materially different from future results, performance, developments or achievements expressed or implied by such forward-looking statements. Such forward-
    looking statements are based on numerous assumptions regarding the Company’s present and future business strategies and the environment in which it will operate in the future. Accordingly, no assurance is given that any
    such forward-looking statements will prove to have been correct. These forward-looking statements speak only as at the date of this Presentation. The Company expressly disclaims any obligation or undertaking to disseminate
    any updates or revisions to any forward-looking statements contained herein to reflect any change in its expectations with regard thereto or any change in events, conditions or circumstances on which any of such statements
    are based.
                                                                                                                                                                                                                                                     2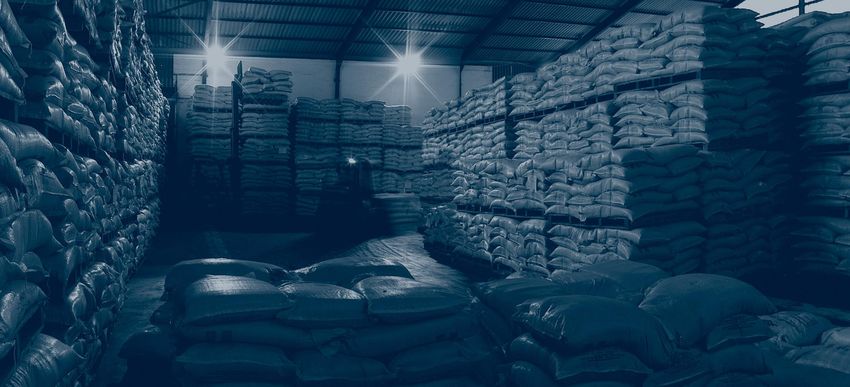
OPERATIONAL    STRATEGIC
                   FINANCIAL   OVERVIEW &    OVERVIEW &
GROUP OVERVIEW   PERFORMANCE    OUTLOOK       GUIDANCE

                                                          3
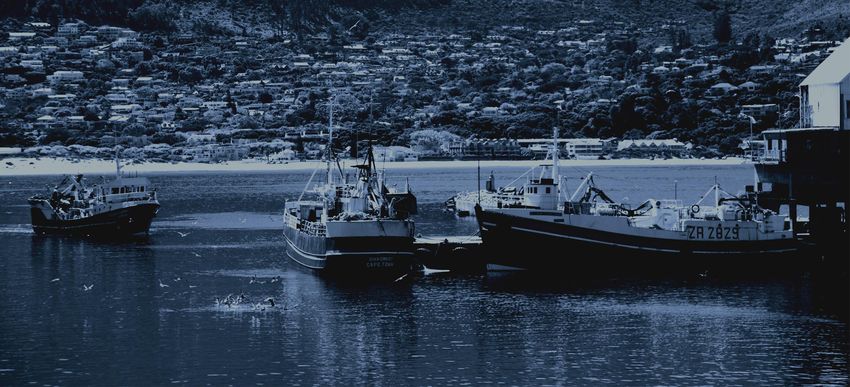
GROUP OVERVIEW

    55
   VESSELS
                  12          5 255              7            300 000
                 SPOTTER      EMPLOYEES       DIVERSIFIED     TONS ON AVERAGE
                  PLANES                   SPECIES/PRODUCTS    SOLD ANNUALLY

  CUSTOMERS   INTERNATIONAL
     IN 46    PROCUREMENT        12              15           LEVEL 1
  COUNTRIES        FROM        STORAGE        PRODUCTION           BEE
                6 COUNTRIES    FACILITES       FACILITIES      CONTRIBUTOR

                                                                                4
2019 H1 PERFORMANCE OVERVIEW
CANNED FISH FMO (US) HORSE MACKEREL CCS
& HAKE
11%
3% 21% 12%
SALES VOLUMES AVERAGE PRICE RECOVERY PLANNED FISHING DAYS OCCUPANCY
OPERATING PROFIT PROFIT BEFORE TAX HEPS DPS
16% 28% 20% 10%
R554m (H1 2018 : R479m) R423m (H1 2018 : R331m) 249.7c (H1 2018 : 310.4c) 123c (H1 2018 : 112c)
5
OPERATIONAL    STRATEGIC
                   FINANCIAL   OVERVIEW &    OVERVIEW &
GROUP OVERVIEW   PERFORMANCE    OUTLOOK       GUIDANCE

                                                          6
INCOME STATEMENT
                                                                                         2019                   2018*
     R'000                                                                              MARCH            VAR    MARCH
     Revenue                                                                             3 557 416        3%    3 452 824
     Gross profit                                                                        1 319 207        3%    1 276 540
     GP margin                                                                                     37%               37%
     Operating expenditure                                                                (728 190)       -3%   (752 711)
     Operating profit before associate and joint venture loss                               591 017      13%     523 829
     Associate and joint venture loss                                                      (36 726)      26%     (29 132)
     Operating profit before other operating items                                          554 291      12%     494 697
     Other operating items                                                                     (770)             (15 922)
     Operating profit                                                                       553 521      16%     478 775
     Operating profit margin                                                                       16%               14%
     Net interest                                                                         (130 125)      -12%   (147 824)
     Profit before taxation                                                                 423 396      28%     330 951
     Taxation                                                                             (121 979)               46 731
     Profit after taxation                                                                  301 417      -20%    377 682
     Headline earnings                                                                      291 809      -19%    362 373
     HEPS (cents)                                                                              249.7     -20%      310.4
     *The prior period has been restated as a result of the adoption of new accounting standards                            7
REVENUE

 3 800

 3 700                                                                  152
                                                          176
                                                                                    63
                                                                                              118
 3 600

                            135
 3 500

 3 400

 3 300                                     3 588
                                                                                                          3 557
           3 453
 3 200

 3 100

 3 000
         March 2018     Exchange rate   Comparative   Canned fish   Export sales   Price   Angola FMO   March 2019
                                          business     volumes        volume

          Increase    Decrease
                                                                                                                     8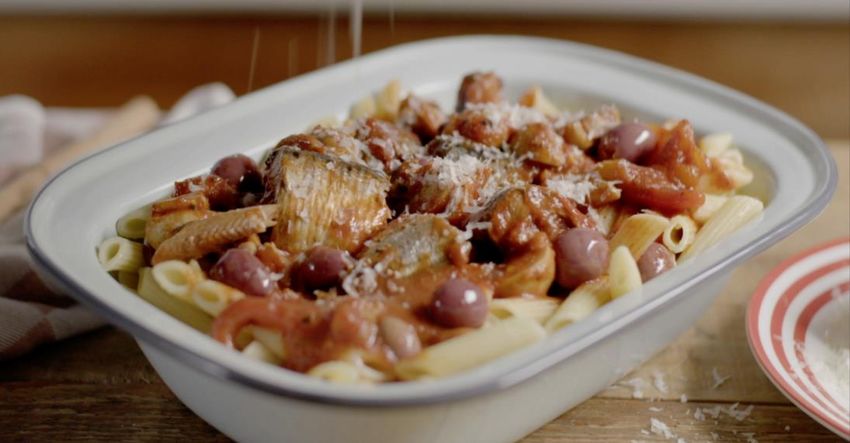
OPERATING PROFIT

 600                                                                      20
                                                                                              6                   7
                                                    57

 500                           51

 400

 300
                                                                                                                                554
          479
 200

 100

  -
       March 2018       Canned fish and     Fishmeal and fish oil Horse mackerel and   Lobster and squid   Commercial Cold   March 2019
                        fishmeal (Africa)         (USA)                  hake                                 Storage

       Increase     Decrease
                                                                                                                                          9
FINANCIAL POSITION KEY ITEMS

                                     2019             2018
    R'000                           MARCH            MARCH
    Property, plant and equipment      1 638 926        1 444 943
    Intangible assets                  4 691 433        3 901 285
    Other assets                        441 183          386 688
    Current assets                     3 081 111        2 464 747
    Stock days                                 148              102
    Net cash                             193 760          856 737
    Total assets                      10 046 413        9 054 400
    Shareholders interest              4 638 561        3 515 553
    Non-controlling interest                96 073           80 849
    Long term loan                     3 589 251        3 762 077
    Other liabilities                  1 722 528        1 695 921
    Total equity and liabilities      10 046 413        9 054 400

    Closing exchange rate                    14.61            11.88
                                                                      10
CASH FLOW STATEMENT
2019 2018
R'000 MARCH MARCH
Cash generated from operations 715 086 656 603
Working capital changes (521 165) (245 797)
Taxation and dividends paid (536 360) (132 546)
Debt serviced (360 754) (356 070)
Capital expenditure (145 736) (83 217)
Other 27 029 (144 235)
Net decrease in cash and cash equivalents (821 900) (305 262)
Cash and cash equivalents at the beginning of the period 1 015 060 1 222 040
Effect of exchange rate changes 600 (60 041)
Cash and cash equivalents at the end of the period 193 760 856 737
11WORKING CAPITAL
160 140
133
140
130
120
120
100
110
80
103 148
100
60 115
91 102
90
40
69
56
44 80
20 39 38 40
- 70
2017 2018 2019
Inventory Days Debtors Days Creditors Days Cash conversion cycle
12DIVIDEND PER SHARE
HEPS AND DPS (CENTS)
350
300
250
200
150 310
250
231
218
100 194
123
106 112 112
50
90
-
2015 2016 2017 2018 2019
HEPS DPS
13OPERATIONAL STRATEGIC
FINANCIAL OVERVIEW & OVERVIEW &
GROUP OVERVIEW PERFORMANCE OUTLOOK GUIDANCE
14CANNED FISH
152019 H1 CANNED FISH
2018 2019
KPI’s MEASURE MARCH MARCH
Operating profit ZAR 95% 24%
Volumes sold cartons 22% 11%
Trended net realisation R/ctn 2% 3%
Total production cost per carton R/ctn 1% 1%
Daily throughput cartons per day cartons 13% 8%
Man hours/carton hrs/ctn 5% 15%
16SALES VOLUMES
TOTAL SALES (‘000 CTNs)
5 000
147
419
145
6%
4 000 397
12%
131 33%
353
3 000 24%
4 323
2 000 3 854
3 115
1 000
-
Mar-17 Mar-18 Mar-19
South Africa ROA International
17SALES VOLUMES
SOUTH AFRICA SALES (CTNS’000)
1 200 9 000
ERP
IMPLEMENTATION
8 000
BUY-IN
1 000
7 000
800 6 000
5 000
600
4 000
400 3 000
2 000
200
1 000
- -
Oct Nov Dec Jan Feb Mar April May June July August September
2018 Monthly 2019 Monthly 2018 Cumulative 2019 Cumulative
18TOTAL FOOD OVERVIEW
VOLUME GROWTH VS TOTAL FOOD
15,0%
12,0%
10,0%
7,8%
5,0%
0,4%
-0,6%
0,0%
12MM Mar-19 6mm Mar-19
-5,0%
Lucky Star Total ask'd basket
19PROMOTIONAL AND MERCHANDISING SHIFT
• Introduced DJ Zinhle in our new TV commercials to elevate the status of the brand and the pilchard category
• The new campaign highlights the iconic nature of the brand in claiming to be The taste of home
20VERSATILITY OF PRODUCT
21CANNED FISH SUPPLY
CTNS’000
10 000
12% 4%
9 000
8 000
7 000 10%
40% 48%
6 000
5 000 49%
4 000
3 000
48% 48%
2 000
41%
1 000
-
2017A 2018A 2019F
Frozen and canned internationally Frozen and locally canned Fresh and locally canned
22CANNED FISH SUPPLY – INVENTORY HOLDINGS
CANNED AND FROZEN FISH INVENTORY (R’m)
1 000
900
16%
11%
800
2%
700 40%
600
500
400 89%
98%
300
100%
200
100
-
2017A 2018A 2019F
Canned Fish Frozen fish
23OUTLOOK
VOLUME DRIVERS
• Affordability
• Improved supply providing the ability to meet demand without disruption
• Marketing and sales:
• Consistent messaging to consumers on product attributes: health, convenience (fully cooked) & versatility (recipes)
• Brand health and trust strong – increased brand investment ensuring retention of iconic and top ten brand status
in South Africa
• Extensive focus on attracting former/previous consumers back to the category
COST EFFICIENCIES
• Consistent raw fish supply allows for improved production planning thereby extracting greater efficiencies
INVESTMENT IN WORKING CAPITAL (“THE NEW NORMAL”)
• Increased level of international raw and canned fish procurement due to constrained local resource
• Revised strategy will continue until resource replenishes itself – 3 to 5 years
24FISHMEAL AND FISH OIL
252019 H1 PERFORMANCE – FMO (AFRICA)
2018 2019
KPI’s MEASURE MARCH MARCH
SA operating profit ZAR 191% 16%
Volumes sold – SA Tons 21% 2%
Volumes sold – Angola Tons 35% 100%
SA landings Tons 5% 12%
Average fishmeal price vs Peru Index $/mt 11% 1%
Average fish oil price vs Peru Index $/mt 4% 20%
26OUTLOOK – FMO (AFRICA)
SOUTH AFRICA
• Pilchard catches at a cyclical low – fleet focused on industrial fish
• Catches to end April marginally above the last 2 years
• Biomass healthy – indications are supportive of good catch for the season
ANGOLA
• Operations mothballed due to resource scarcity
• Continue to assess fishing conditions
• Simultaneously exploring alternatives
272019 H1 PERFORMANCE – FMO (US)
2018 2019
KPI’s MEASURE MARCH MARCH
US operating profit* US$ 53% 10%
Volumes sold – fishmeal Tons 9% 1%
Volumes sold – fish oil Tons 19% 28%
Price – fishmeal $/mt 3% 1%
Price – fish oil $/mt 20% 10%
* Excluding FV adjustment
28OUTLOOK – FMO (US)
BIOMASS/LANDINGS
• Latest assessment of biomass indicates a healthy resource
• Early landings slower than expected due to weather conditions
• Sightings good at lower depths and targeting similar landings to 2018
• High river (and increased nutrients) should theoretically contribute towards an improved oil yield
• Early stats: meal yield c.25%, oil yield c.9%
OPERATIONS
• Closed season period was focused on capex and maintenance
• > $5million spent on plant capex, aimed at improving efficiencies and processing rates
• Early season startup operations successful
29GLOBAL OUTLOOK – FMO SUPPLY
WORLD FISHMEAL PRODUCTION X 1000 TONS
6 000
5 000
4 000
3 000
2 000
1 000
-
2008 2009 2010 2011 2012 2013 2014 2015 2016 2017 2018 2019E
Other China,PR Peru
WORLD FISH OIL PRODUCTION X 1000 TONS
1 400
1 200
1 000
800
600
400
200
-
2008 2009 2010 2011 2012 2013 2014 2015 2016 2017 2018 2019E
Other China,PR Peru
*IFFO /JCI Spring Conference 2019 30GLOBAL OUTLOOK – FMO SUPPLY
PERU
• Delayed spawning due to warm temperatures resulted in later start to season
• Official start of season commenced 4th May with quota announced at 2.1 million MT
• Fishmeal price increased 10% due to quota cut
EU
• Expectations of 20-25% lower fishmeal output
AFRICA
• Strong supply from Morocco and Mauritania
• Poor supply from Angola and Namibia
• South Africa – strong landings on red-eye herring, promising outlook on anchovy
US
• Gulf Menhaden commenced season April 15th – biomass strong
• Oil yield too early to assess
31GLOBAL OUTLOOK – FMO DEMAND
CHINA
• African Swine Fever (ASF) impact reported to be larger and more wide spread than expected
FAR EAST
• Continued demand for aquaculture feed, aggressive buying from cheaper origins
EU
• Anticipated increase in demand as a result of lower supply in Scandinavia, Germany, France, Spain,
Greece
US
• US pet food market – demand remains strong, pricing competitive
• Trend to longer term contracts and constant supply
32BLUE CONTINENT
PRODUCTS
332019 H1 PERFORMANCE – HORSE MACKEREL
2018 2019
KPI’s MEASURE MARCH MARCH
Operating profit ZAR 68% 8%
Volumes sold Tons 34% 14%
Average sales price Price/kg 4% 6%
Fishing days Days 39% 28%
Catch per sea day Tons 23% 8%
34Oct-16
Nov-16
Dec-16
Jan-17
Feb-17
Mar-17
Apr-17
May-17
Jun-17
Jul-17
Aug-17
Sep-17
Oct-17
Nov-17
Dec-17
Jan-18
Feb-18
Mar-18
HORSE MACKEREL – SOUTH AFRICA
Apr-18
DESERT DIAMOND MONTHLY CATCHES
May-18
SCHEDULED
Jun-18
MAINTENANCE
Jul-18
Aug-18
Sep-18
Oct-18
Nov-18
Dec-18
Jan-19
& REFIT
Feb-19
DRY DOCK
STATUTORY
Mar-19
35Oct-16
Nov-16
Dec-16
Jan-17
Feb-17
Mar-17
Apr-17
May-17
Jun-17
Jul-17
Aug-17
Sep-17
SCHEDULED
MAINTENANCE
Oct-17
Nov-17
HORSE MACKEREL – NAMIBIA
Dec-17
Jan-18
Feb-18
Mar-18
Apr-18
May-18
Jun-18
Jul-18
Aug-18
NAMIBIAN HORSE MACKEREL AVERAGE CATCH PER FISHING DAY
Sep-18
Oct-18
Nov-18
Dec-18
Jan-19
Feb-19
Mar-19
36OUTLOOK – HORSE MACKEREL
SOUTH AFRICA
• Landings encouraging and expecting consistent catch rate on prior year
• Quota appeal process remains pending
• Strong demand
NAMIBIA
• 2018 rights renewal unlikely to be finalised in 2019
• Allocation and quota availability challenging – timing of second allocation uncertain
• Landings expected in line with prior year
• Price of quota remains favourable
372019 H1 PERFORMANCE – HAKE
2018 2019
KPI’s MEASURE MARCH MARCH
Operating profit ZAR 94% 18%
Volumes sold Tons 23% 14%
Sales price Euro/kg 1% 11%
Sea days Days 8% 8%
Catch rate Catch/day 2% 4%
38R10,00
R15,00
R20,00
R25,00
R30,00
R35,00
HAKE
Oct-16
Nov-16
Rand
Dec-16
Jan-17
Euro
Feb-17
Mar-17
Apr-17
May-17
Jun-17
Jul-17
Aug-17
Sep-17
Oct-17
Nov-17
Dec-17
Jan-18
Feb-18
Mar-18
Apr-18
RAND AND EURO PRICING PER KG
May-18
Jun-18
Jul-18
Aug-18
Sep-18
Oct-18
Nov-18
Dec-18
Jan-19
Feb-19
Mar-19
€ 2,00
€ 2,50
€ 3,00
€ 3,50
€ 4,00
39OUTLOOK – HAKE
• 10% increase in TAC
• Continued positive landings – improvement in catch rate on prior year expected
• Consistent European and local demand for MSC hake
• Hake rights renewal process scheduled for 2020
40LOBSTER AND SQUID
41OVERVIEW AND OUTLOOK – LOBSTER AND SQUID
LOBSTER
• H1 Performance
• Reduced TAC and quota
• Favourable live pricing achieved driven by reduced supply and higher mix of live product
• Outlook
• Positive pricing due to reduced supply
• Rationalisation plan and alternatives being considered
SQUID
• H1 Performance
• Catches down on record prior year
• Favourable pricing achieved due to reduced industry supply
• Outlook
• Demand remains strong and pricing is positive
• Catch consistent with H1
42COMMERCIAL COLD
STORAGE
432019 H1 PERFORMANCE – CCS
2018 2019
KPI’s MEASURE MARCH MARCH
Operating profit ZAR 13% 18%
Revenue occupancy % 7% 12%
Revenue /pallet R/pallet 2% 4%
Non-recurring once-off costs R’m - R7m
44OPERATING PROFIT – CCS
50
45
6
9
40
3
7
35
30
25
20 41
34
15
10
5
-
March 2018 SA Coastal Namibia and Angola Inland Non-recurring cost March 2019
Increase Decrease
45OUTLOOK – CCS
GAUTENG
• Midrand partial exit finalised
• Improved occupancy at City Deep will continue in H2
COASTAL
• Strong performance expected
• Frozen fish strategy driving efficiencies
ANGOLA/NAMIBIA
• Higher occupancy levels expected at Walvis Bay due to improved fishing conditions
• Angola longer term viability uncertain
46STRATEGIC OVERVIEW
AND GUIDANCE
47FISHING RIGHTS ALLOCATION PROCESS 2020
• Current fishing rights in the HDST (hake deep ANTICIPATED TIMELINES
sea trawl) and SMP (small pelagic) South
Coast Rock Lobster (SCRL) and Squid sectors DATE EVENT
expire on 31 December 2020 APR 2019 Release of draft policy
MAY/JUL 2019 Gazetting of Draft Policy,
Public consultations engagement with stakeholders
• A new fishing rights allocation process (FRAP)
SEP 2019 Gazetting final policies, application forms and fees
needs to be completed by 31 December 2020 Open application process
NOV/DEC 2019 Closure of application process
• DAFF held FRAP 2020 Seminar on 22 and 23 JUN 2020 Announcement provisional list, annexure to General
April 2019 and presented the revised time Published Reasons
line and Draft General Policy for the AUG 2020 Announcement - final lists & annexure to General
Published Reasons
Allocation of Fishing Rights
AUG 2020 Opening of appeals process
DEC 2020 Announcement of appeals outcome
48FRAP 2020 – OCEANA APPROACH
• Oceana level 1 BEE black ownership over 68% OCEANA SUPPLY 2019
14%
• Under 15% of supply impacted by FRAP 2020
• FRAP 2020 risk mitigated through 16% 44%
diversification strategy
• International pilchard supply chain further
reduces risk
26%
• Intending to play a proactive role in
finalisation of policy and support of
US Gulf Menhaden
government initiatives, including assistance International Pilchard Supply
SA & Namibia long term allocated and contracted quota
to small scale sector SA Quota (FRAP2020)
49GUIDANCE
OPERATING PERFORMANCE
• Steady canned fish growth
• Good demand for fishmeal and oil
• Positive SA fishmeal landings
• Firm pricing on export products
• Improved vessel utilisation for both horse mackerel and hake
• Uncertainty regarding 2nd timing of HM Namibia allocation for 2019
• CCS normalisation of performance
• Angola challenges
FINANCIAL PERFORMANCE
• Working capital alleviation
• Looking to replicate PY profit before tax performance
50THANK YOU
51ANNEXURE
2018 2019
FINANCIAL OVERVIEW (R'000) MARCH MARCH VAR
CANNED FISH AND FISHMEAL
Revenue 1 848 092 1 965 700 6%
Operating profit 171 015 221 753 30%
Operating profit margin 9% 11%
FISHMEAL AND FISH OIL (US)
Revenue 614 361 654 487 7%
Operating profit 60 725 118 172 95%
Operating profit margin 10% 18%
HORSE MACKEREL AND HAKE
Revenue 675 685 641,505 -5%
Operating profit 179 266 158,328 -12%
Operating profit margin 27% 25%
LOBSTER AND SQUID
Revenue 102 357 87 858 -14%
Operating profit 27 003 21 701 -20%
Operating profit margin 26% 25%
COMMERCIAL COLD STORAGE
Revenue* 240 539 249 348 4%
Operating profit 40 766 33 567 -18%
Operating profit margin 17% 14%
*Revenue includes intercompany revenue of R41.5m (2018:R28.2m)
52You can also read