Bilfinger SE Company Presentation
←
→
Page content transcription
If your browser does not render page correctly, please read the page content below
Bilfinger SE

Bilfinger SE Company Presentation
February 2021
Overview and strategic outline
Bilfinger at a glance
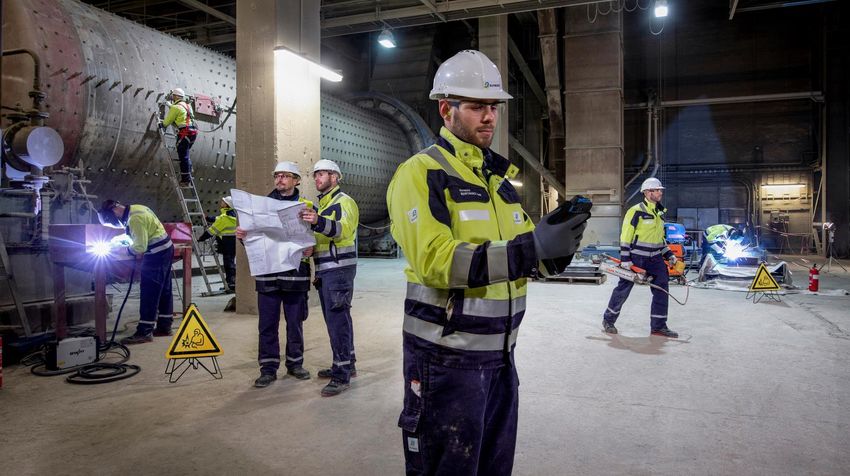
Leading international industrial services provider
Efficiency enhancement of assets, ensuring a high level of availability and
€3.46bn revenue
reducing maintenance costs
Clear 2-4-6 strategy with two service lines, four business units and six focus
industries
thereof
recurring business >60%
Combination of excellence in services covering the lifecycle of industrial
plants (E&M) and innovative solutions (T)
€93m Free cash flow
Large share of business with long-term frame contracts and high retention
rates
Well-established customer base with focus on process industries
€20m EBITA adjusted
Highly recognized safety and quality performance
Digital pioneer for the process industry
Approx. 30,000 employees
based on FY 2020
Bilfinger SE | Company Presentation | February 2021 page 3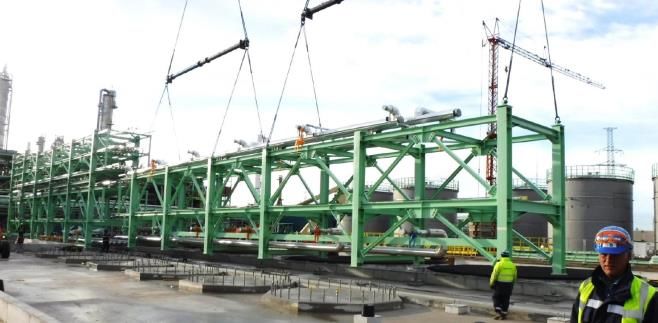
2-4-6 still holds
2 Service Lines, 4 Business Units, 6 Focus Industries
Our
ambition We engineer and deliver
process plant performance
Where 2 Service Lines 4 Business Units 6 Focus Industries
to play
E&M – Engineering & E&M Europe Chemicals & Pharma &
Maintenance E&M North America Petrochem Biopharma
T – Technologies E&M Middle East Energy & Metallurgy
Technologies Utilities Cement
Oil & Gas
Success
factors People Assets Data
Our people, their We strive to support our We measure
performance, skills and customers in delivering performance by
dedication to reach our superior performance numbers, data and facts
goals is our most from their assets
valuable asset
Bilfinger SE | Company Presentation | February 2021 page 4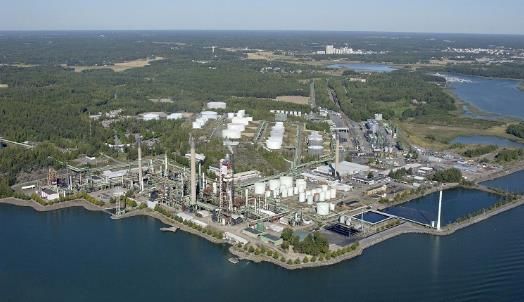
Global trends

                     Aging Assets &                           ESG / Climate                Skilled Labor              Data & Artificial
                     Asset Integrity                          Change                       Shortage                   Intelligence

         Europe & US: Aging assets                    ▪ CO2 limits                  Europe                     ▪ Machine learning
         ▪ Increasing maintenance                     ▪ Emissions & Air pollution   ▪ Demographics             ▪ Predictive / prescriptive
           costs                                      ▪ Clean energy                ▪ Vacant apprenticeships     maintenance
         ▪ Asset life time extensions                 ▪ Distributed power                                      ▪ Virtual reality
                                                                                    US                           & Augmented reality
         ▪ Efficiency & Emissions                       generation
                                                                                    ▪ Shrinking unemployment   ▪ OEE (overall equipment
         Middle East: Maturing                        ▪ Power to liquids
                                                                                    ▪ Craft labor shortage       efficiency)
         assets                                       ▪ Circular Economy
                                                                                                               ▪ Risk reduction
         ▪ World class CAPEX                          ▪ Sustainable finance         Middle East
                                                                                    ▪ Quality not quantity     ▪ New business models
         ▪ Sub benchmark                              EU: Green Deal
           performance

Bilfinger SE | Company Presentation | February 2021                                                                                          page 5
Bilfinger core capabilities

                     Skilled labor                           Domain Expertise                      Digitalization

         ▪ Europe’s #1 Maintenance Services           ▪   Engineering / Process knowledge     ▪ Bilfinger Digital Next
           Company                                    ▪   Focus on key industries             ▪ Convergence of BMC & BCAP to
         ▪ Leading Employer Branding                  ▪   Customer intimacy / collaboration     digital BMC
         ▪ Bilfinger Academy                          ▪   Long term contracts                 ▪ Electronic Workflow to drive internal
         ▪ Trade craft accreditation                                                            productivity
                                                      ▪   High customer stick rates (>90%)
         ▪ ~30,000 headcount                                                                  ▪ A.I. (PIDGraph, algorithm training ….)
                                                      ▪   Cross-border unified operating
         ▪ Thousands of temporary employees               models                              ▪ Partnership models

Bilfinger SE | Company Presentation | February 2021                                                                                      page 6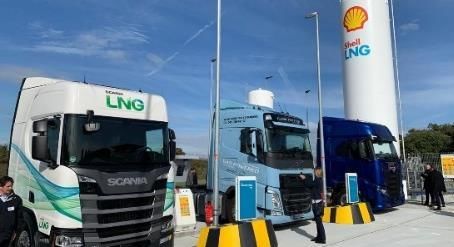
Our capabilities addressing global trends

                              Global Trends affecting our business
    Bilfinger                   Aging Assets &          ESG / Climate      Skilled Labor        Data & Artificial
    capabilities                Asset Integrity         Change             Shortage             Intelligence

       Skilled                  Fabric maintenance      Circular economy   Employer of choice   Cloud analytics
       labor

       Domain                   Maintenance analytics   Pollution          BMC                  PIDGraph-AI
       Expertise

       Digitali-                Digital twins           Water              Augmented Reality    BCAP
       zation

Bilfinger SE | Company Presentation | February 2021                                                                 page 7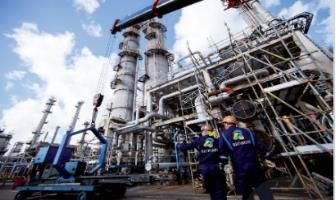
Strategic Assumptions

              Geographic                              Industry            Digitalization         Engineering &                 War for
                focus                                   focus                                   Maintenance and                talent
                                                                                                 Technologies

       ▪ Europe                                 ▪ Chemicals &          ▪ Enabling opportunity   ▪ Technologies          ▪ Skilled blue collar is
                                                  Petrochemicals                                  support Engineering     a differentiator in the
       ▪ North America                                                 ▪ Driving productivity
                                                                                                  & Maintenance           market
                                                ▪ Energy & Utilities
       ▪ Middle East                                                   ▪ Strategic                opportunities         ▪ Craft labor strength
                                                ▪ Oil & Gas              partnerships
                                                                                                ▪ Strengthen our          and breadth
                                                ▪ Pharma & Biopharma                              strengths
                                                ▪ Metallurgy
                                                ▪ Cement

Bilfinger SE | Company Presentation | February 2021                                                                                                 page 8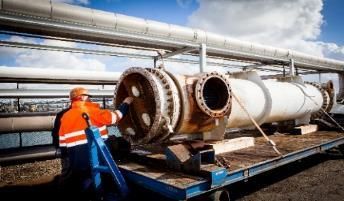
Strategic Imperatives
Unique service offering/
Integrity & HSE People Differentiators Asset light model
Attract ▪ Multi-service provider ▪ ROCE focus
▪ We will not compromise Motivate ▪ Continue to innovate our service ▪ Strict working capital
Retain and commercial offering management
Develop ▪ Extend portfolio, leverage ▪ Disciplined M&A criteria
integrated solutions
▪ Digitalization
Relevant E&M footprint Middle East profitable
Margin growth SG&A Efficiency in North America top line growth
▪ Project Risk & Execution ▪ Lean management ▪ Leveraging existing market ▪ Increase Oil & Gas activities
▪ Margin protection ▪ De-complexing (e.g. legal & customer access ▪ Pro-actively support
▪ Pricing entity reduction) ▪ Grow organically and optionally customers in their outsourcing
▪ Portfolio rotation ▪ Purpose over process non-organically and maintenance efforts
▪ Leverage harmonized ▪ Introduce Maintenance concepts ▪ Partnering
systems
Bilfinger SE | Company Presentation | February 2021 page 9
We never compromise on integrity and safety
    Number and severity of incidence continues to fall

                      Safety is good business                                       Integrity is non-negotiable

       Safety KPIs (based on 1m man hours)
       1       0.84
                            0.71        0.67
                                                                                                                  Fully integrated
                                                                                                  Prevent
                                                                                                                  Established compliance
                                                                                         Detect                   culture
                                                      0.23                    Self-
                                                             0.16                                                 Sustainable focus
                                                                              optimizing
                                                                                                  Respond
       0                                                                      compliance                          Continuous learning
               2016        2017         2018          2019   2020             cycle                               Part of our DNA
                                                 1
                                          LTIF

                                         Governance                 Operational focus                Leadership

  1)       LTIF: Lost Time Injury Frequency

Bilfinger SE | Company Presentation | February 2021                                                                                     page 10
2 Service Lines
Engineering & Maintenance Technologies
FY 2020: E&M Europe: Revenues €2,221m, EBITA adj. €69m FY 2020: Revenues €498m, EBITA adj. €-10m
FY 2019: E&M International: Revenues €521m, EBITA adj. -€21m
E&M covers the entire lifecycle of an industrial plant: T provides solutions for the process industry:
• Engineerung services and commissioning • Technological and digital innovations
• Maintenance and efficiency enhancement • Service, construction and digital networking of components
• Expansions, conversions and shutdowns and systems
• Focus on economic, emission-friendly operation of energy
Characteristics and industrial plants
• Higher added value to maintenance business, potential for cost
savings in SG&A Characteristics
• Superior customer perception, market leader in key European • Proven technological competence
markets • Product and manufacturing excellence
• Regional focus: Europe, North America, Middle East • Centralized capacities, serving the global market
Combination of E and M leverages our business to Focusing on Technologies drives stronger growth
higher-end services and higher margins and higher margins
Bilfinger SE | Company Presentation | February 2021 page 112 Service Lines
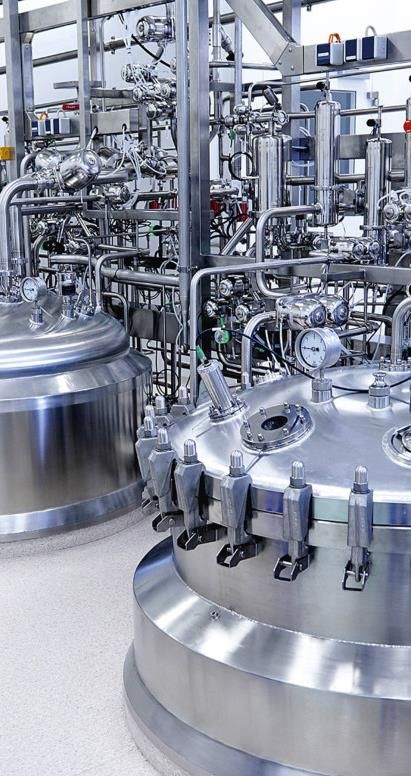
Engineering & Maintenance: Excellence in services covering the lifecycle of industrial plants
Engineering Maintenance Turnarounds
AVR Chevron Neste refinery
The Netherlands, Duiven USA, Offshore, Gulf of Mexico Finland, Porvoo
• Conceptual engineering and construction • Industrial and inspection services • Turnaround services and projects.
management Engineer, scope, schedule and execution.
• Services to 4 Deepwater platforms
• First industrial scale CO2 capture • Local team supported by group expertise,
installation • Contract expanded from corrosion Mobilization of 300+ personnel to Finland
protection to full service
• Captures 60,000 tons of CO2 per annum • Bilfinger Turnaround Concept (BTC) in
from waste-to-energy generation action
No. 1 services provider for the process industry
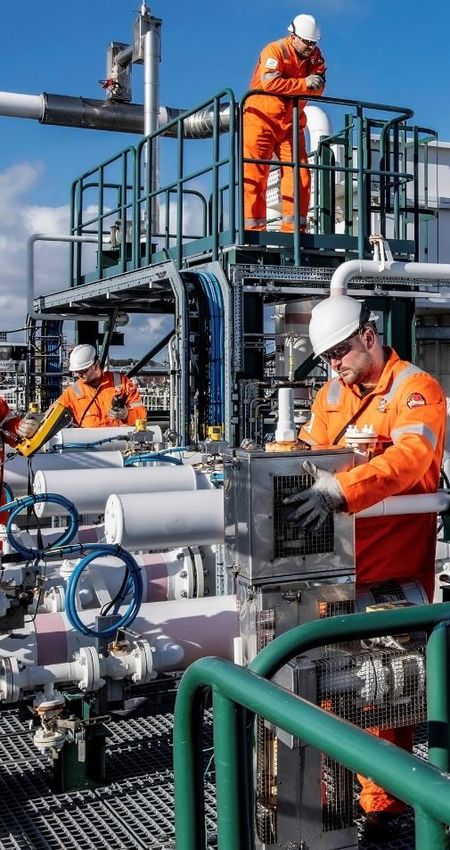
Bilfinger SE | Company Presentation | February 2021 page 122 Service Lines
Technologies: Excellence in products, manufacturing and innovative solutions
Nuclear services New energy Fabrication & Installation
EDF Hinkley Point Cryostar LNG stations BP Deutschland (Ruhr Oel GmbH)
United Kingdom Germany, Poland, France, BeNe Germany, Gelsenkirchen-Scholven
• New Build & Waste Management of a • Turnkey service, safe and reliable • Turnkey Project: Concept, engineering
nuclear plant design, modular fabrication, installation
• 50+ Shell LNG stations across Europe
• Specialist engineering, fabrication and powering freight fleets • 180 interconnecting piperacks with 320
installation valves, 25 km piping and 260 tie-ins into
• Unrivalled European coverage to drive process units
• CO2 reduction by using nuclear power efficiency
• Integrated tender by entities in Technology
and E&M Europe
No. 1 services provider for the process industry
Bilfinger SE | Company Presentation | February 2021 page 13Mid term targets
How we will drive growth going forward

                 Growth areas                                                                                                       Ambition – Top line

             1
                 Integrate product &                     ▪ Roll out service products (BMC,BTC,BCAP etc.)
                                                                                                                                     Facilitate growth
                 services portfolio                      ▪ Focus on growth by business line and “white spots”

             2
                                            ▪ Integrated project organization to combine group scale &
                 ‘Big-ticket’ multinational   capabilities                                                                           Bundle capabilities
                 opportunities              ▪ Increase integrated services and Key Account Management

             3
                                                          ▪ Global Development to lead cross business planning and delivery
                 Growth markets focus                     ▪ Align business offering to deliver value (e.g. Life Science, Energy      Key market approach
                                                            transition etc.)

             4
                 High efficiency /
                                                          ▪ Industrialize digital forward thinking                                   Capitalize on innovation &
                 innovation driven by
                                                          ▪ Integrate data- and software-based business models into core offering    digitalization
                 digital services

Bilfinger SE | Preliminary Figures FY 2020 | | February 11, 2021                                                                                                  page 15
Key levers for GROSS MARGIN growth
Target of 12% confirmed
Operational levers Ambition – Bottom line
Lean organization ▪ Operational excellence programs in full swing
Performance culture
and culture ▪ Launch of further Lean programs following successful pilot
KPI-driven ▪ Standardize KPIs to monitor utilization, capacity planning, productivity etc.
Core operational KPIs
performance ▪ Benchmark across group and identify levers for margin improvement
▪ Loss making businesses have returned to at least break-even
Company transitions No loss-making businesses
▪ Transition delivered through specific transformation programs
▪ Resource planning further invented to maximize utilization and
Blue collar supply mix Optimize cost base
development ▪ Additional lower cost recruitment and internal sub-contracting
Procurement ▪ Strategic procurement for business line and regional economies of scale
Efficient procurement cycle
synergies ▪ E-procurement to further improve efficiency and pricing
Improved project • Dedicated team for larger integrated projects Margin enhancement through
execution • Following structured risk management procedures projects
Bilfinger SE | Preliminary Figures FY 2020 | | February 11, 2021 page 16Over the last 5 years, SG&A has been reduced by over € 100 million
Target of 7% confirmed from 2022
Degree of target achievement ERP/SAP
Reduction of #legal entities Adjusted SG&A [mEUR, %]
in terms of revenue
100% Revenues, € billion
as of Jun. 30,
2021 4.2 4.3
4.0 4.2
279 ~45%
3.5
232 90%
as of Dec. 31,
55% 2020
160 434
55% 145
360 361 346
70% 70% 291
45%
45% 10.3%
30% 30% 70% 8.9% 8.7% 8.0%
8.4%
as of Dec. 31,
31.03.2016 CMD 31.12.2019 31.12.2020
2019
14.02.2017
2016 2017 2018 2019 2020
operating non-operating
# Target achieved:Financial targets 2024
Revenues EBITA ROCE Free Cash
margin reported Flow
sustainably min. reported
>5 5 8-10 >200
€bn % % €m
Investment Grade (mid-term perspective)
Sustainable dividend stream going forward
Policy: 40 to 60% of adjusted net profit
Bilfinger SE | Company Presentation | February 2021 page 18Capital allocation priorities
Financial Intended M&A
policy Dividend Policy1 Criteria
▪ Actual rating S&P: BB-/outlook ▪ Floor of €1.00 is confirmed ▪ EBITA accretive one year after
stable ▪ Sustainable dividend stream integration
▪ Policy to maintain conservative going forward: 40 to 60% of ▪ ROCE exceeds WACC two
level of key financial metrics in adjusted net profit years after integration
the range of an intermediate ▪ Asset light with focus on ROCE
financial risk profile according to
▪ Immediate start of integration
S&P:
Adjusted net debt / adjusted
EBITDA: 2.0x < target < 2.5x
Adjusted FFO / adjusted net
debt: 30% < target < 45%
Mid-term ambition: Investment Grade
1) Provided that earnings and cash flow development is in line with planning
Bilfinger SE | Company Presentation | February 2021 page 19Financials Q4 2020
Q4 2020:
    Resilient business model and high cost agility ensured positive results and
    cash flow despite substantial revenue decrease

     Orders                     FY 2020: -7% org., lower orders in Oil & Gas, slow US project market
     received                   Q4: +3% org., especially strong in Europe

                                FY 2020: -17% org., European business quite resilient despite reduced Oil & Gas
     Revenue                    volumes
                                Q4: -14% org., but slight increase against Q3

     EBITA                      FY 2020: positive at €20m due to high cost agility and consequent crisis management
     adjusted                   Q4: €42m, positive contribution from all segments

                                FY 2020: €99m, includes mark-to-market valuation PPN Apleona (+€210m)
     Net profit
                                Q4: €203m, Net Profit adjusted positive at €24m

Bilfinger SE | Company Presentation | February 2021                                                                   page 21
Q4 2020:
Strong cash generation in Q4 allowed for essentially full repayment of tax and
social security deferrals
Dividend proposal recovers last year’s dividend reduction
• Reported free cash flow positive at €93m, essentially all deferred taxes and social
security contributions repaid
Liquidity • Continuous working capital management, significant DSO improvement in Q4
• Successful renewal of revolving credit facility of €250m in December
Balance • Solid balance sheet
sheet / • Dividend proposal of €1.88 per share
dividend (includes recovery of last year’s € 0.12)
• Significant revenue growth
Outlook
• Substantial improvement in EBITA adjusted
2021
• Substantial improvement in EBITA reported
Bilfinger SE | Company Presentation | February 2021 page 22Markets: E&M Europe
Industries Overall
%*
trend
• Market slowly starts to recover with benefit of low feedstock prices
Chemicals &
40% • Ongoing project investments still proceeding
Petrochem
• Deferred work/shutdowns expected to raise activity levels in 2021/22
• ESG climate change drivers still hold, e.g. CO2 limits, emissions,
Energy & decentralized power generation
10%
Utilities • Green energy investment projects emerging as anticipated (e.g.
renewables, hydrogen, carbon capture etc.)
• OpEx stabilized after initial shock and gradual recovery foreseen
Oil & Gas 20% • Recovery supported by asset integrity/shutdowns related backlog plus older
asset life extensions
*% of segment revenues FY 2020
Bilfinger SE | Company Presentation | February 2021 page 23Markets: E&M International
Industries Overall
%*
trend
Chemicals & • Trend for expansion and modernization projects in ME intact
20%
Petrochem • Projects delayed but attractive project pipeline in NA
• Continued growth in ME population and industry drives further development
Energy & of alternative and nuclear energy concepts as well as water solutions
10%
Utilities • In NA, more positive outlook for energy investment focused on energy
storage, wind, solar and CO2 reduction.
• Large oil & gas and LNG investment plans in several ME countries (e.g.
Oil & Gas 25% UAE, Qatar, Kuwait) for the upcoming years
• CAPEX and OPEX spend expected to increase from 2021 onwards in NA
*% of segment revenues FY 2020
Bilfinger SE | Company Presentation | February 2021 page 24Markets: Technologies
Industries Overall
%*
trend
• Energy transition focus in all our regions, esp. Europe and USA
Energy &
40% • Nuclear demand for new builds and maintenance increasing, esp. in France,
Utilities
UK, Finland and demand increasing for decommissioning in Germany
• Mega trends remain unchanged despite COVID-19
Pharma &
35% • Positive outlook on Pharma OPEX; Trend to outsource services and
Biopharma
production is increasing
*% of segment revenues FY 2020
Bilfinger SE | Company Presentation | February 2021 page 25Orders received especially strong in Europe
Development of orders received
Orders received
2019 2020 FY
• Q4: -3%; however organically +3%
Q4 Q1 Q2 Q3 Q4 2019 2020 €110m of Hinkley Point C orders have been
-3%/+3% org. called and booked in the quarter
-10%/-7% org.
1,057 1,060 1,024 • Good level in European markets; North
Orders received 931 4,159 America still under pressure on a low level
(€ million) 3,724
673 710
719 642 • FY: Decrease of -10%, org.: -7%, reflects
(64%) (68%) 657 (63%)
(71%) 512 lower activity in Oil & Gas and slow US
< €5 million (72%) project market
> €5 million
384 341 382 Order backlog
274 198
• +1% above prior-year level (org.: +5%)
Book-to-Bill
1.0 1.2 1.2 0.8 1.2 1.0 1.1
ratio Book-to-bill
• Q4: 1.2, solid base for revenue growth
Order backlog 2,567 2,562 2,667 2,458 2,585 2,567 2,585 in 2021
(€ million)
Bilfinger SE | Company Presentation | February 2021 page 26European business very resilient despite lower volumes in Oil & Gas
EBITA adjusted margin close to prior-year level despite significantly lower revenues
Development of revenue and profitability
Revenue
2019 2020 FY
• FY: -20% (org.: -17%) below prior-year due
Q4 Q1 Q2 Q3 Q4 2019 2020
to Covid-19 / oil price impact
-20%/-17% org.
-18%/-14% org. EBITA adjusted
Revenue
(€ million) 1,071 4,327
915 • FY: Positive due to high cost agility and
870 882 3,461
5.3% 793 4.8% consequent crisis management
EBITA adj.
margin (%)
2.7%
• Q4: €42 million with good results in E&M
-1.2% Europe and Technologies; E&M International
2.4%
-4.4%
0.6% positive but still under pressure
Special items
EBITA adj.
(€ million) 57 -11 -35 23 42 104 20 • FY: -€77 million (thereof -77 restructuring
costs, -13 IT investments and -4 capital
EBITA 7 -20 -51 0 14 32 -57
(€ million) losses OOP divestment; +17 from
settlement with former EB members)
Adjustments 49 9 16 24 28 72 77
(€ million)
Bilfinger SE | Company Presentation | February 2021 page 27Gross margin in Q4 close to 12%-target and above prior year level
Gross profit (€ million)
121 412
(11.3%) (9.5%)
105
(11.9%)
89 296
(10.2%) (8.6%)
Q4/19 Q3/20 Q4/20 FY 19 FY 20
Bilfinger SE | Company Presentation | February 2021 page 28SG&A expenses clearly below € 300 million, also supported by one-time effects
Current quarterly run-rate at €75 million
Adjusted selling and administrative expenses (€ million)
12 33 18
6 7
-75 -73 -310
-96 (-8.7%) (-8.2%) -379 (-8.9%)
(-8.9%) (-8.8%)
-69 -65
-291
(-7.9%) (-7.4%)
(-8.4%)
-83 -347
(-7.8%) (-8.0%)
Q4/19 Q3/20 Q4/20 FY 19 FY 20
adjustments reported
Bilfinger SE | Company Presentation | February 2021 page 29E&M Europe:
Proves high resilience despite lower volumes in oil & gas
Q4 adjusted EBITA on last year’s level despite lower revenues
Development of revenue and profitability
Orders received
2019 2020 FY
• Q4: +10% (org.: +12%) based on framework
Q4 Q1 Q2 Q3 Q4 2019 2020 contracts as well as on project orders
-14% / -13% org. Revenue
-13% / -11% org.
672 2,578 • FY: dominated by Covid-19 / oil price impact
Revenue 573 586 2,221
571 • Q4: Decrease by -13% (org.: -11%), with
(€ million) 491 6.2%
5.5% ~1/3 less North Sea upstream Oil & Gas
4.7%
4.1% business
EBITA adj. 3.1%
margin (%)
EBITA adjusted
0.7% 0.4%
• Margin benefits from agile cost management
including government support through
Book-to-Bill
0.9 1.1 1.3 0.9 1.2 1.0 1.1 furlough schemes
ratio
Outlook 2021
EBITA adj.
(€ million)
37 4 2 27 36 106 69 Revenue: significant growth
EBITA adjusted: significant improvement
Bilfinger SE | Company Presentation | February 2021 page 30E&M International:
Top-line still under pressure due to slow project pipeline
EBITA adjusted in Q4 positive on low level
Development of revenue and profitability
Orders received
2019 2020 FY
• Q4: -72% (org.: -69%), in both regions
Q4 Q1 Q2 Q3 Q4 2019 2020 lack of contract awards throughout 2020
-43%/-42% org.
-39%/-34% org. Revenue
193 912 • Q4: Decrease of -39% (org.: -34%)
Revenue 165
(€ million) reflects currently low order book
131 4.6%
8.6% 118
108 521 EBITA adjusted
-0.8% 1.9%
EBITA adj. • Q4: Slightly positive also due to capacity
margin (%)
-9.5% -8.6% -4.0% adjustments, but still needs to be
stabilized
Book-to-Bill
1.3 0.9 1.0 0.8 0.6 0.9 0.8
Outlook 2021
ratio
Revenue: significant growth
EBITA adj. EBITA adjusted: significant
17 -1 -12 -9 2 42 -21 improvement to a positive result
(€ million)
Bilfinger SE | Company Presentation | February 2021 page 31Technologies: Again, positive contribution
Orders received with significant call-offs from Hinkley Point C, mainly generating
revenues from 2021 onwards
Development of revenue and profitability
Orders received
2019 2020 FY
• Q4: +59% (+59% org.), €110 million orders
Q4 Q1 Q2 Q3 Q4 2019 2020 called from Hinkley Point C
+1%/+1% org. -8%/-7% org.
Revenue
139 138 140 538
498 • FY: below prior-year, also due to wind-down
Revenue 113 108 of loss-making activities
(€ million) 6.3%
4.2%
1.0% • Q4: On prior-year level (+1%, org.: +1%)
-4.3%
EBITA adj. EBITA adjusted
margin (%) -2.1%
-18.7%
-5.2% • Q4: strong last quarter, only one entity with
losses in the last two quarters, strategic
Book-to-Bill
1.0 2.5 1.1 0.7 1.6 0.8 1.4
measures well under way
ratio
Outlook 2021
EBITA adj. Revenue: significant growth
1 -5 -20 6 9 -28 -10
(€ million)
EBITA adjusted: significant
improvement to a clearly positive result
Bilfinger SE | Company Presentation | February 2021 page 32Net profit and ROCE positively impacted by PPN Apleona
Reported free cash flow positive, virtually all deferred taxes and social security
contributions paid
Net profit 1) (€ million) Free cash flow 1) (€ million) ROCE (%)
203 211 43.2%
190
32 24 34
15 15 3.3%
Q4/19 Q4/20 Q4/19 Q4/20 Q4/19 Q4/20
99 128 137 6.9%
93
50
57
24 1.8%
-8 FY/19 FY/20 FY/19 FY/20
FY/19 FY/20
Reported Net Profit Reported FCF ROCE
Adjusted Net Profit Adjusted FCF
1) Adjustments correspond to EBITA adjustments, Net Profit: in addition elimination of special items in financial result and in taxes
Bilfinger SE | Company Presentation | February 2021 page 33DSO clearly below prior-year level, successful Working Capital Management in Q4
Development of net liquidity
Net liquidity 1) (€ million) Cash flow development year-to-date (€ million) excl. IFRS 16
12m 2020 IFRS 16 12m 2020 12m 2019
excl. IFRS 16 im pacts incl. IFRS 16 excl. IFRS 16
EBITA adj. 20 20 104
Depreciation 59 56 115 57
Change in NWC (Reported) 59 59 -42
Others -31 -31 11
-19
Adjustments -43 -43 -71
-57
-62 Operating CF Reported 64 120 59
43 -8 Net CAPEX -27 -27 -53
3 -5 Free CF Reported 37 93 6
-1 Proceeds/Investments financial assets 8 8 130
-8
0 Changes in marketable securities 0 0 119
Dividends -7 -7 -43
01. Oct 2020 OCF Adjustments Net Capex Acquisitions/ Cash flow Cash flow Change in Other 31. Dec Change in financial debt 0 -52 -52 -124
adjusted disposals financing discontinued valuation of 2020 Interest paid -19 -4 -23 -22
activities operations payables
FX / other / disco -8 -8 -16
Change in Cash 11 11 50
503 461 408
74 69 78 66 70 63
31.12.19 30.09.20 31.12.20 31.12.19 30.09.20 31.12.20
Net trade assets (€ million) DSO (days) DPO (days)
1) Including IFRS 16 leases DSO: Trade receivables + WIP – advance payments received, DPO: Trade payables
Bilfinger SE | Company Presentation | February 2021 page 34Mark-to-market of Apleona PPN resulted in a capital gain of
€210m booked in financial result
450
• Bilfinger holds Preferred Participation Notes to Apleona, which
will result in a share of approximately 49 percent of the sales
proceeds after deduction of debt
+210
• The PPN relates to the sale of Bilfinger's Building and Facility
Services business (now: Apleona) to EQT in September 2016
240
• On December 6, 2020, EQT officially announced by press
195 release the sale of all shares in Apleona Group GmbH to PAI
Partners in December 2020
Sale proceeds: €450 to 470 million
Capital gain: €210 million in financial result
Cash inflow: €450 to 470 million after closing of the
transaction, which EQT expects to take place in the second
30.09.2016 31.12.2019 31.12.2020 quarter of 2021
Carrying amount PPN Apleona, in €m
Bilfinger SE | Company Presentation | February 2021 page 35Outlook 2021
Significant revenue growth and substantial improvement of EBITA adj.
Actual FY 2020 Outlook FY 2021
Revenue €3,461 million Significant growth
EBITA adjusted €20 million Substantial improvement
Level of 2019 (2.4%),
EBITA adjusted margin 0.6%
despite significantly lower revenue
EBITA reported - €57 million Substantial improvement
Free Cash Flow reported €93 million Positive, but below prior-year
Underlying assumptions:
• COVID-19 pandemic to have no significant impact on our business activities in 2021
• Oil price range between 45 and 65 US $ / barrel
Bilfinger SE | Company Presentation | February 2021 page 36Disclaimer
This presentation has been produced for support of oral information purposes only and contains forward-
looking statements which involve risks and uncertainties. Forward-looking statements are statements that are
not historical facts, including statements about our beliefs and expectations. Such statements made within this
document are based on plans, estimates and projections as they are currently available to Bilfinger SE.
Forward-looking statements are therefore valid only as of the date they are made, and we undertake no
obligation to update publicly any of them in light of new information or future events. Apart from this, a number
of important factors could therefore cause actual results to differ materially from those contained in any forward-
looking statement. Such factors include the conditions in worldwide financial markets as well as the factors that
derive from any change in worldwide economic development.
This document does not constitute any form of offer or invitation to subscribe for or purchase any securities. In
addition, the shares of Bilfinger SE have not been registered under United States Securities Law and may not
be offered, sold or delivered within the United States or to US persons absent registration under or an
applicable exemption from the registration requirements of the United States Securities Law.
Bilfinger SE | Company Presentation | February 2021 page 37You can also read