3Q2021 & 9M2021 Results Presentation - 23 OCTOBER 2021 iFAST Corporation Ltd.
←
→
Page content transcription
If your browser does not render page correctly, please read the page content below

iFAST Corporation Ltd.

 3Q2021 & 9M2021
Results Presentation
     23 OCTOBER 2021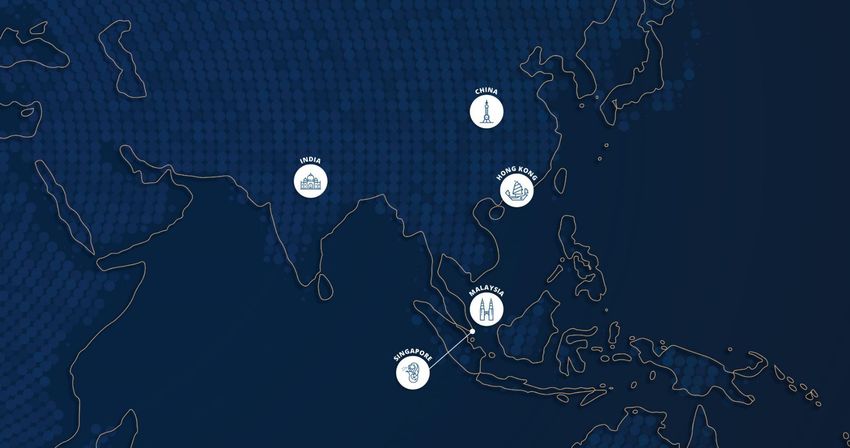
Disclaimer
This presentation should be read as an overview of iFAST Corporation Ltd.’s (“iFAST Corp” or the “Company”, and
together with its subsidiaries, the “Group”) current business activities and operating environment. This presentation
should not be solely relied upon by current and potential investors when making an investment decision. iFAST Corp
accepts no liability whatsoever with respect to the use of the content in this presentation. This presentation may
contain forward-looking statements that involve known and unknown risks, uncertainties and other factors that may
cause our future performance, outcomes and results to be material different from those expected, expressed or
implied in these forward-looking statements. Investors should therefore not rely on these forward-looking statements,
which are based on the current view of management of future events and market developments, which in turn are
based on currently available information, and are not a guarantee of future performance. This presentation should not
be construed as financial or investment advice and investors should consult their independent advisers in respect of
the contents and information set out in this presentation where necessary. This presentation does not constitute an
offer or solicitation of an offer to subscribe for, acquire, purchase, dispose of or sell any units in iFAST Corp.

                                                                                                                        2
Contents
Key Summary Pg. 4
3Q2021 (Jul–Sep 2021) & 9M2021 (Jan-Sep 2021) Results Pg. 8
Section I Financial Indicators
Financial Results
Interim Dividends
Get Bigger and Better Pg. 22
Section II Accelerate Hong Kong Growth
iFAST’s Five-Year Plan More Licences
Truly Global Business Model
AUA Breakdown: Markets & Products Pg. 31
Section III Recurring and Non-recurring Net Revenue
Our Performance Trends Performance by Geographical and Business Segments
Progress of Individual Markets
Business Overview & Milestones Pg. 50
The iFAST Fintech Ecosystem
Section IV Value Proposition
Appendices
Fees Illustration
Activities & Achievements
3
Key Summary
• The Group’s assets under administration (“AUA”) continued to register new record levels, reaching
  S$18.38 billion as at 30 September 2021, a growth of 46.1% YoY and 27.2% YTD. The AUA of unit trusts,
  its key investment asset class, grew to a record S$13.46 billion, a growth of 39.5% YoY and 23.5% YTD.
• As a result of the increasing AUA, the Group’s recurring net revenue has continued to grow at a robust
  pace, increasing 29.7% YoY in 3Q2021, and 32.7% YoY in 9M2021.
• Even though trading activities were generally more subdued in 3Q2021 compared to the earlier part of
  2021, growth in non-recurring net revenue was still robust in 3Q2021, supported by contributions from
  some project implementation fees.
• Net inflows of client assets remained healthy in 3Q2021 at S$0.87 billion, leading to net inflows of
  S$2.99 billion for 9M2021.
• The Group’s net revenue grew 38.1% YoY to S$84.99 million in 9M2021, while its net profit grew 63.6%
  YoY to S$23.43 million in 9M2021. Reflecting the positive operating leverage of the Group’s business
  model, its profit before tax (“PBT”) margin (based on net revenue) increased to 32.7% for 9M2021,
  compared to 29.6% for 2020 as a whole.

                                                                                                           4
Key Summary
• iFAST Corp believes that the robust growth seen by the Group in recent times has resulted from its past
  investments in building up a strong integrated digital wealth management platform. The Group will
  continue to work hard on various initiatives in all existing markets that the Group operates in to ensure
  that its medium to long term growth prospects remain strong.
• The Group is on track to see its business performance achieve healthy growth for the full year 2021 as
  compared to 2020. In addition, as indicated in previous quarters, the Group‘s dividend per share in 2021
  has increased as compared to 2020.
• For the interim dividend for 3Q2021, the Directors declared a dividend of 1.30 cents per ordinary share,
  an increase of 62.5% YoY compared to the interim dividend for 3Q2020 of 0.80 cents per ordinary share.
• The Group has set out a Five-Year Plan focusing on four key aspects namely to get bigger and better, to
  accelerate Hong Kong’s growth, to pursue more licences, and to build a truly global business model.
• Given the Group’s expectations that the growth rates of its overall Hong Kong business will accelerate in
  the next five years, the Group has decided to share its targeted Hong Kong revenue and PBT margins for
  2024 and 2025.
    o In 2024 and 2025 respectively, the Group targets to achieve gross revenue of >HKD1 billion and
      >HKD1.5 billion, net revenue of >HKD800 million and >HKD1.2 billion, and PBT margin of >15% and
      >33%.
                                                                                                              5
Group AUA grew 27.2% YTD and 46.1% YoY
                        to S$18.38 billion as at 30 September 2021
   S$ million                                                                         AUA (as at 30 Sep 2021): S$18.38 billion1
  $18,000.00
  $16,000.00
  $14,000.00
  $12,000.00
  $10,000.00
   $8,000.00
   $6,000.00
   $4,000.00
   $2,000.00
          $-

                Sep-10

                Sep-11

                Sep-12
                Sep-00

                Sep-01

                Sep-02

                Sep-03

                Sep-04

                Sep-05

                Sep-06

                Sep-07

                Sep-08

                Sep-09
                Mar-10

                Mar-11

                Mar-12

                Sep-13

                Sep-14

                Sep-15

                Sep-16

                Sep-17

                Sep-18

                Sep-19

                Sep-20

                Sep-21
                Mar-00

                Mar-01

                Mar-02

                Mar-03

                Mar-04

                Mar-05

                Mar-06

                Mar-07

                Mar-08

                Mar-09

                Mar-13

                Mar-14

                Mar-15

                Mar-16

                Mar-17

                Mar-18

                Mar-19

                Mar-20

                Mar-21
Note:                                                                 B2B B2C
1. The Group’s AUA as at 30 September 2021 includes its effective 39.48% share of the India Business.

                                                                                                                                  6
Net Inflows & Gross Unit Trusts (UT) subscription
S$ million                  Net Inflows                                             S$ million            Gross UT Subscriptions
 $3,500                                                                                $6,000
                                                                                                                                $5,647            $5,543
                                               $3,160
                                                                   $2,991
 $3,000                                                                                $5,000

 $2,500                                                                                                                                  $4,081
                                                          $2,313                       $4,000

 $2,000
                                                                                                            $3,053
                                                                                                 $2,908                $2,870
                                                                                       $3,000
 $1,500

                                                                                       $2,000
             $942                   $976
 $1,000
                        $786

                                                                                       $1,000
   $500

     $-                                                                                   $-
             2017       2018        2019        2020       9M20 9M21                             2017        2018      2019     2020      9M20 9M21
Notes:
1. Net inflows stood at S$1.28 billion in 1Q2021, S$0.84 billion in 2Q2021 and S$0.87 billion in 3Q2021.
2. Gross UT Subscriptions stood at S$2.21 billion in 1Q2021, S$1.76 billion in 2Q2021, and S$1.57 billion in 3Q2021.

                                                                                                                                                           7
SECTION I

Financial Results

                    8
Financial Results for Group
                                    (3Q2021 vs 3Q2020)
              S$ (Million)                   3Q2020      3Q2021   YoY change (%)
                Revenue                      45.00       55.53        +23.4
              Net revenue                    22.87       30.31        +32.6
         Other income / (loss)                1.27        -0.57        NM
          Operating Expenses                 16.70       20.65        +23.7
      Net finance (cost) / income             -0.06       0.03         NM
Share of results of associates, net of tax    -0.07       -0.05       -26.5
            Profit before tax                 7.31        9.09        +24.3
             Profit after tax                 6.11        7.54        +23.4
       Net profit attributable to
                                              6.16        7.60        +23.3
       owners of the Company
               EPS (cents)                    2.27        2.74        +20.7
      Dividend Per Share (cents)              0.80        1.30        +62.5

                                                                                   9
Financial Results for Group
                                    (9M2021 vs 9M2020)
              S$ (Million)                   9M2020      9M2021   YoY change (%)
                Revenue                      122.03      161.65       +32.5
              Net revenue                    61.53       84.99        +38.1
             Other income                     3.65        0.88        -76.0
          Operating Expenses                 47.68       58.03        +21.7
          Net finance income                  0.08        0.08         -4.8
Share of results of associates, net of tax    -0.14       -0.13        -6.3
            Profit before tax                17.43       27.79        +59.4
             Profit after tax                14.19       23.27        +64.0
       Net profit attributable to
                                             14.33       23.43        +63.6
       owners of the Company
               EPS (cents)                    5.29        8.50        +60.7
      Dividend Per Share (cents)              2.30        3.40        +47.8

                                                                                   10
Results Overview for Group
S$ (Million) FY20171 FY2018 FY2019 FY2020 9M2021
Revenue 101.17 121.24 125.41 169.93 161.65
Net revenue 49.45 59.62 65.20 85.86 84.99
Other income 1.08 1.16 2.04 5.21 0.88
Operating expenses 42.19 49.78 56.06 65.29 58.03
Net finance income/(costs) 0.74 0.83 -0.06 0.03 0.08
Share of results of associates, net of tax -0.33 0.52 -0.05 -0.41 -0.13
Profit before tax 8.75 12.35 11.07 25.39 27.79
Profit after tax 7.49 10.69 9.31 20.96 23.27
Net profit attributable to
7.70 10.91 9.52 21.15 23.43
owners of the Company
EPS (cents) 2.92 4.10 3.55 7.80 8.50
Operating Cashflows 13.22 17.62 19.38 41.56 30.93
Dividend per share (cents) 3.01 3.15 3.15 3.30 3.40
Note:
1. Restated as a result of adoption of SFRS(I)s with effect from 1 January 2018.
11PBT Margin for Group (Based on Net Revenue)
35.0%
32.7%
29.6%
30.0%
25.0%
20.7%
20.0%
17.7% 17.0%
15.0%
10.0%
5.0%
0.0%
2017 2018 2019 2020 9M2021
Note:
1. PBT margins (2017) were restated as a result of adoption of SFRS(I)s with effect from 1 January 2018
12Return on Equity
30.0%
26.9%
25.0%
21.8%
20.0%
15.0%
13.1%
10.9%
9.7%
10.0%
5.0%
0.0%
2017 2018 2019 2020 9M2021
13Financial Indicators
S$ (Million) FY2017 FY2018 FY2019 FY2020 9M2021
EBITA 12.96 16.44 17.49 32.98 34.45
Net Cash Position1 55.91 48.06 40.15 53.28 54.44
Operating Cash Flows 13.22 17.62 19.38 41.56 30.93
Capital Expenditure2 7.47 10.73 11.90 12.63 13.36
Net Current Assets 60.18 56.62 49.86 58.35 70.80
Shareholders’ Equity 81.24 85.56 90.06 104.11 125.27
Notes:
1. Comprising cash and cash equivalents and investments in financial assets (categorised as other investments under current assets) net of bank loans
at the end of the respective year or period.
2. Excluding right-of-use assets recognised following the adoption of SFRS(I)16 Leases with effect from 1 Jan 2019.
14Net Cash Position
As at 30 Sep 2021
(S$ million)
Cash and cash equivalents 36.00
Other investments¹ 18.44
Total cash and other investments 54.44
Less: Bank loans -
Net Cash Position
54.44
(total cash and other investments net off bank loans)
Gross Debt-to-Equity Ratio 0.00%
Net Debt-to-Equity Ratio Net Cash Position
Note:
1. Other investments comprise investments in financial assets under current assets.
15Group Operating Cash Flows
S$ million
45.00
41.56
40.00
35.00
30.93
30.00
25.00
19.38
20.00 17.62
15.00 13.22
10.00
5.00
0.00
2017 2018 2019 2020 9M2021
16Capital Expenditure
S$ million
13.36
14.00
12.63
11.90
12.00
10.73
10.00
8.00 7.47
6.00
4.00
2.00
0.00
2017 2018 2019 2020 9M2021
17Number of issued shares
As at 31 Dec 2020 As at 30 Sep 2021
Total number of issued shares
(excluding treasury shares and 272,407,635 276,915,913
subsidiary holdings)
18Our Consolidated Financial Position
As at 31 Dec 20 As at 30 Sep 21
S$’000 S$’000
ASSETS
Plant and Equipment 4,283 6,114
Right-of-use Assets 18,538 16,190
Intangible Assets and Goodwill 25,500 29,093
Associates 5,982 6,315
Other Investments 3,944 3,999
Deferred Tax Assets 1,099 1,857
Prepayments & Others 330 2,233
TOTAL NON-CURRENT ASSETS 59,676 65,801
Current Tax Receivables 203 17
Other Investments 16,838 18,442
Prepayments and Others 1,813 3,109
Trade & Other Receivables 44,990 58,316
Uncompleted Contracts - Buyers 94,318 85,016
Money Market Funds 4,833 5,669
Cash at Bank and In Hand 31,608 30,331
TOTAL CURRENT ASSETS 194,603 200,900
TOTAL ASSETS 254,279 266,701
19Our Consolidated Financial Position
As at 31 Dec 20 As at 30 Sep 21
S$’000 S$’000
EQUITY
Share Capital 66,976 67,563
Other Reserves 37,133 57,705
EQUITY ATTRIBUTABLE TO OWNERS OF THE COMPANY 104,109 125,268
Non-Controlling Interests (709) (861)
TOTAL EQUITY 103,400 124,407
LIABILITIES
Deferred Tax Liabilities 2,616 2,733
Lease Liabilities 12,013 9,458
TOTAL NON-CURRENT LIABILITIES 14,629 12,191
Current Tax Payables 3,078 3,540
Lease Liabilities 7,205 7,628
Trade & Other Payables 31,735 34,024
Uncompleted Contracts - Sellers 94,232 84,911
TOTAL CURRENT LIABILITIES 136,250 130,103
TOTAL LIABILITIES 150,879 142,294
TOTAL EQUITY & LIABILITIES 254,279 266,701
HELD UNDER TRUST
Client Bank Accounts 943,960 1,115,015
Client Ledger Balances (943,960) (1,115,015)
- -
20Third Interim Dividend for FY2021
Third Interim Dividend for FY2021 - Schedule
Dividend per share 1.30 cents per ordinary share
Ex-dividend date 1 November 2021
Record date and time 2 November 2021 (5.00 pm)
Payment date 16 November 2021
• For the interim dividend for 3Q2021, the Directors declared a dividend of 1.30 cents per ordinary share,
an increase of 62.5% YoY compared to the interim dividend for 3Q2020 of 0.80 cents per ordinary share.
• For the first three quarters of 2021, the Group declared a total interim dividend of 3.40 cent per ordinary
share, an increase of 47.8% YoY compared to the total interim dividend of 2.30 cents per ordinary share
for the first three quarters of 2020.
21Section II
iFAST’s Five-Year Plan
22iFAST’s Five-Year Plan
1. Get Bigger and Better: Continue to work on increasing the scale and quality of its
Fintech wealth management platform in various markets, in line with the Group’s
target AUA of S$100 billion by 2028.
2. Accelerate Hong Kong Growth: Substantially accelerate the growth of the Group’s
overall Hong Kong business as it effectively executes its ePension business in Hong
Kong, and continues to improve on its existing platform capabilities.
3. More Licences: Pursue more financial licences in different jurisdictions and make
strategic investments in adjacent Fintech capabilities, while ensuring that wealth
management will remain as its core service as a progressive Fintech player.
4. Truly Global Business Model: Make tangible progress towards the Group’s vision of
being a top Fintech wealth management player with a truly global business model,
which will be even more scalable.
23Five-Year Plan: Get Bigger and Better
• The Group’s focus all these years on ensuring that it continue to make progress as a Fintech
wealth management platform in all the markets that it operates in will continue.
• The Group will continue to work on increasing the scale and quality of its platforms for both
the B2C segment and B2B segment. The B2B segment includes its in-house wealth advisory
division, iFAST Global Markets (iGM).
• The Group remains committed to its previously stated Group AUA target of S$100 billion by
2028. This would imply a compound annual growth rate (CAGR) of approximately 27% from the
Group’s current AUA of S$18.38 billion.
• The Group will continue to work on enlarging its overall Fintech ecosystem.
• The Group’s focus on ensuring that its business model is scalable, capital efficient and derives
the majority of its net revenue from recurring income will continue.
24Five-Year Plan: Accelerate Hong Kong Growth
• The Group expects to substantially accelerate the growth of its overall Hong Kong
business in the next five years, particularly in 2024 and 2025.
• The Group expects its existing Fintech wealth management platform business to
continue to grow, while its new ePension division will start to contribute substantially
starting 2023/2024.
• The Group’s ePension division will involve operation and administration services for
MPF schemes (main contributor) as well as ORSO (Occupation Retirement Scheme
Ordinance) schemes.
• A substantial part of the Group’s resources will be invested into ensuring that it can
effectively execute its ePension services efficiently with minimal errors.
• The ePension division will not add to the Group’s AUA numbers, but will add a strong
stream of recurring service fees to the Group.
25Guidance on Hong Kong Targets
• Given the Group’s expectations that the growth rates of its overall Hong Kong business
will accelerate in the next five years, the Group has decided to share its targeted
revenue and PBT margins for 2024 and 2025.
• For the purpose of comparison, the Group’s overall Hong Kong business achieved the
following in 2020 and first nine months of 2021 (9M2021):
o Gross Revenue: HKD251.5 million in 2020 and HKD214.9 million in 9M2021
o Net Revenue: HKD106.5 million in 2020 and HKD106.6 million in 9M2021
o PBT Margin (based on Net Revenue): 30% in 2020 and 35% in 9M2021
26Guidance on Hong Kong Targets
• Gross Revenue Targets
Target to achieve Gross Revenue of >HKD1 billion in 2024
Target to achieve Gross Revenue of >HKD1.5 billion in 2025
• Net Revenue Targets
Target to achieve Net Revenue of >HKD800 million in 2024
Target to achieve Net Revenue of >HKD1.2 billion in 2025
• PBT Margin (based on Net Revenue) Targets
Target to achieve PBT Margin of >15% in 20241
Target to achieve PBT Margin of >33% in 2025
Notes:
1. Takes into prudent consideration the lower onboard rate of ePension division’s business in the early years.
* It should be noted that the above are the Group’s targets, and should not be taken to mean a firm set of projections. The targets may change
if there are unforeseen circumstances, or if there are material changes in the operating environment in the next few years.
27Five-Year Plan: More Licences
• The Group believes that Fintech businesses in most countries around the world are still in their
early stages of growth. Clear long-term planning is needed to survive and thrive in the Fintech
and financial world in the next 10 years and beyond.
• Successful Fintech businesses need to have the ability to combine the technological capabilities
and agility of many Fintech start-ups with several of the strengths of traditional financial
institutions.
• Key strengths of many traditional financial institutions include having the right suite of licences
and demonstrating the ability to run profitable and sustainable business models.
• iFAST Corp believes it is well-positioned in the Fintech industry as it will be able to combine its
technological capabilities and business model agility with the Group’s proven capability of
running profitable business models and handling various regulatory and compliance
considerations.
• The Group’s core business will continue to be a Fintech wealth management platform. However,
to ensure that iFAST remains a progressive and competitive Fintech player, and to improve overall
user stickiness, the Group sees the need to develop some services adjacent to wealth
management.
28Five-Year Plan: More Licences
• The Group therefore expects to be pursuing more financial licences in different jurisdictions,
and make strategic investments in adjacent Fintech capabilities.
• One of the services that is closely linked to wealth management is digital banking. This is
illustrated by the fact that in most countries around the world, the biggest distributors of
wealth management products are the banks.
• The Group would like to have digital banking capabilities in one or more jurisdictions, and will
therefore continue to pursue digital banking licences.
• Another example of a service that is adjacent to wealth management is a ‘market place for
bonds’. A ‘market place for bonds’ will have clear business propositions given that unlike
stocks, there are no ‘bond exchanges’, especially for individual investors.
• Operating a ‘bonds market place’ would require a ‘Recognised Market Operator’ licence, and
accordingly the Group is in the midst of applying for such a licence.
• The Group will give updates on its pursuits of different licences in different jurisdictions at
appropriate times.
29Five-Year Plan: Truly Global Business Model
• The Internet has brought about many different new business models, including truly global
business models that are far more scalable and competitive on a global basis.
• Truly global business models are those that can operate from just one or a few countries, but serve
customers from around the world. Truly global business models have emerged for many industries
such as media, e-commerce, music and video streaming etc.
• In the Fintech wealth management world, truly global businesses have not emerged in a big way.
However, the Group believes that in the next 10 years, some of the most competitive and scalable
wealth management business models will become truly global Fintech wealth management
platforms.
• The Group believes the future of wealth management is one where more investors from emerging
markets will be looking for the best wealth management platform across the world that can
provide them seamless access and connectivity to global products and global exchanges including
the US, China etc.
• In the next five years, the Group targets to make tangible progress towards its vision of being a top
Fintech wealth management player with a truly global business model focused on helping investors
invest globally and profitably.
• In order to achieve this, the Group needs to continuously work on expanding its global Fintech
ecosystem and improve on the overall global connectivity, while being fully compliant with
regulations and compliance requirements of various jurisdictions.
30SECTION III
\
Performance Trend
31AUA Breakdown: Markets & Products
(as at 30 September 2021)
AUA Breakdown By Markets AUA Breakdown By Products
4.0% 5.4%
9.2%
16.8%
16.0%
4.7%
70.8% 73.1%
Singapore Hong Kong Unit Trusts Bonds
Malaysia Others (China & India) Stocks & ETFs Cash Account
32Net Revenue Breakdown between
Recurring and Non-recurring Sources
Average contribution from recurring net revenue as opposed to non-recurring net revenue
S$ million in the period from 2020 to 9M2021 was 69.2%
100.0
90.0
80.0
25.5 27.2
70.0
60.0 12.3
11.3
50.0
8.5
40.0 6.9 6.0
7.2
30.0 6.0 60.4 57.8
4.0 52.9
4.8 48.3
20.0 18.1 12.3 4.6 40.9
34.6 34.7
4.0 25.6 29.5
10.0 7.7 20.4 22.3
3.1 4.7 12.9 17.2
10.7 11.9
1.1 2.2 5.2
0.0
2004 2005 2006 2007 2008 2009 2010 2011 2012 2013 2014 2015 2016 2017 2018 2019 2020 9M2021
Recurring net revenue Non-recurring net revenue
33Net Revenue, Operating Expenses and Operating Profit
as a Ratio of Average AUA
0.800%
0.732% 0.735% 0.731% 0.757%
0.700% 0.686%
0.126% 0.139% 0.138% 0.225%
0.600%
0.625% 0.220%
0.614% 0.629%
0.500%
0.576%
0.400% 0.468%
0.300% 0.606% 0.596% 0.594%
0.533%
0.466%
0.200%
0.218%
0.181%
0.100%
0.106% 0.121% 0.103%
0.000%
2017 2018 2019 2020 9M2021
Recurring net revenue / AUA Non-recurring net revenue / AUA
Operating expenses / AUA Operating profit / AUA
34Recurring and Non-recurring Net Revenue
S$ (Million) FY2017 FY2018 FY2019 FY2020 9M2021
Recurring net revenue 40.95 48.32 52.94 60.39 57.78
Non-recurring net revenue 8.50 11.30 12.26 25.47 27.21
Total net revenue 49.45 59.62 65.20 85.86 84.99
YoY Change (%) FY2017 FY2018 FY2019 FY2020 9M2021
Recurring net revenue +18.0 +18.0 +9.6 +14.1 +32.7
Non-recurring net revenue +42.2 +33.0 +8.5 +107.7 +51.5
Total net revenue +21.5 +20.6 +9.4 +31.7 +38.1
35Net Revenue – Geographical Segment
S$ (Million) FY2017 FY2018 FY2019 FY2020 9M2021
Singapore 34.77 39.30 41.95 56.33 54.90
Hong Kong 10.78 14.26 16.71 19.22 18.41
Malaysia 3.47 5.32 5.97 8.55 9.80
China 0.43 0.75 0.57 1.76 1.88
Group 49.45 59.62 65.20 85.86 84.99
YoY Change (%) FY2017 FY2018 FY2019 FY2020 9M2021
Singapore +17.7 +13.0 +6.8 +34.3 +36.9
Hong Kong +24.5 +32.2 +17.2 +15.0 +30.9
Malaysia +53.5 +53.4 +12.2 +43.2 +56.6
China +83.4 +73.1 -24.1 +210.6 +69.5
Group +21.5 +20.6 +9.4 +31.7 +38.1
36Net Revenue – B2B Business Segment
B2B Net Revenue
FY2017 FY2018 FY2019 FY2020 9M2021
(S$ Million)
Recurring net revenue 28.85 33.88 37.12 42.34 40.60
Non-recurring net revenue 5.15 7.22 7.19 10.88 12.44
Total B2B net revenue 34.00 41.10 44.31 53.22 53.04
YoY Change (%) FY2017 FY2018 FY2019 FY2020 9M2021
Recurring net revenue +17.8 +17.4 +9.6 +14.1 +31.5
Non-recurring net revenue +33.4 +40.1 -0.5 +51.4 +60.9
Total B2B net revenue +19.9 +20.9 +7.8 +20.1 +37.4
37Net Revenue – B2C Business Segment
B2C Net Revenue
FY2017 FY2018 FY2019 FY2020 9M2021
(S$ Million)
Recurring net revenue 12.10 14.44 15.81 18.04 17.18
Non-recurring net revenue 3.35 4.08 5.08 14.60 14.77
Total B2C net revenue 15.45 18.52 20.89 32.64 31.95
YoY Change (%) FY2017 FY2018 FY2019 FY2020 9M2021
Recurring net revenue +18.4 +19.3 +9.5 +14.0 +32.1
Non-recurring net revenue +58.0 +22.0 +24.3 +187.5 +48.9
Total B2C net revenue +25.2 +19.9 +12.8 +56.2 +39.3
38Profit/Loss – Geographical Segment
Profit/Loss YoY Change YoY Change
(S$ Million) 3Q2020 3Q2021 (%) 9M2020 9M2021 (%)
Singapore 5.86 6.08 +3.8 14.41 21.81 +51.3
Hong Kong 1.62 3.14 +93.5 4.06 6.35 +56.5
Malaysia 1.23 1.37 +11.6 2.81 4.11 +46.1
China (1.28) (1.40) +9.2 (3.57) (4.20) +17.4
Other1 (0.07) (0.05) -26.5 (0.14) (0.13) -6.3
Profit before tax2 7.36 9.14 +24.2 17.57 27.94 +59.1
Tax expense (1.20) (1.54) +29.0 (3.24) (4.51) +39.2
Net profit after tax2 6.16 7.60 +23.2 14.33 23.43 +63.6
Notes:
1. Representing share of results of associates
2. Attributable to owners of the Company
39Profit/Loss – Geographical Segment
Profit/Loss
(S$ Million) FY20173 FY2018 FY2019 FY2020 9M2021
Singapore 10.62 11.86 9.96 21.32 21.81
Hong Kong 1.77 3.42 4.42 5.79 6.35
Malaysia 1.07 1.37 1.76 3.75 4.11
China (4.17) (4.60) (4.82) (4.88) (4.20)
Other1 (0.33) 0.52 (0.05) (0.41) (0.13)
Profit before tax2 8.96 12.57 11.27 25.57 27.94
Tax expense (1.26) (1.66) (1.76) (4.42) (4.51)
Net profit after tax2 7.70 10.91 9.52 21.15 23.43
Notes:
1. Representing share of results of associates
2. Attributable to owners of the Company
3. Restated as a result of adoption of SFRS(I)s with effect from 1 January 2018 for comparison purpose
40Progress of Individual Markets
SINGAPORE
• Net revenue for the Singapore operation increased by 21.2% YoY to S$18.18 million in 3Q2021 and 36.9% YoY to
S$54.90 million in 9M2021.
• The AUA for the Singapore operation grew 53.5% YoY and 6.8% QoQ to $13.01 billion as at 30 September 2021. This
continuous growth in AUA will ensure that the Singapore operation’s recurring revenue will continue to grow
healthily. Sales grew 29.6% YoY in 3Q2021 and expanded by 65% YoY in 9M2021.
• The AUA of the B2B business (excluding iGM division) grew 40.5% YoY and 3.6% QoQ. Sales grew 81.6% YoY and
expanded by 6.7% QoQ in 3Q2021. Business from wealth advisers and institutional partners remained resilient
throughout this pandemic.
• The B2B platform continued to add on new business partners during the quarter. The number of B2B business
partners grew 25.9% YoY, boding well for the future of the platform’s ability to grow its AUA.
• The B2C business, FSMOne.com, saw its AUA grow by 56.7% YoY. Sales grew by 6.3% YoY in 3Q2021 and 47.6% YoY
over 9M2021.
41Progress of Individual Markets
SINGAPORE
• FSMOne.com launched the China A-shares trading service, via the Northbound Trading link in early October 2021.
This enables investors to invest into a selection of stocks listed in the Shanghai Stock Exchange and Shenzhen Stock
Exchange via the HKEX, at commission rate of 0.08% or minimum of CNH40. The launch of this new service is
supported by a series of educational articles and webinars for investors to better understand the opportunities and
risk in China A shares.
• The AUA for the iGM Singapore division grew 62.4% YoY and 5.2% QoQ to S$1.02 billion, crossing the S$1 billion AUA
milestone for the first time. Despite jittery investor sentiment, sales remained resilient with the measure rising 26.0%
YoY and 3.3% QoQ in 3Q2021.
• Following the addition of wealth advisory talent over the quarter, the advisory team strength grew 5.6% QoQ,
marking a 46.2% YoY increase in the measure.
• Continuing on the Fintech innovation journey to empower both clients and advisers of the future, the division
launched an all-new iGM mobile app which not only sports a significantly improved user interface and faster loading
speeds, but also allows all iGM clients to have access to both adviser and client transaction capabilities on the same
account for the very first time. This marks an important development towards a creating true ‘best-of-both worlds’
hybrid approach which we believe will continue to bring scale and efficiency to the iGM wealth advisory business.
42Progress of Individual Markets
HONG KONG
• Net revenue for the Hong Kong operation increased by 64.5% YoY to S$8.04 million in 3Q2021
and 30.9% YoY to S$18.41 million in 9M2021.
• The AUA of the Hong Kong operation fell 4.3% QoQ but grew 16.9% YoY to S$2.94 billion as at
30 September 2021. The QoQ decline in AUA is mainly due to the drop in the asset value of
investment products. Nevertheless, the Hong Kong operation continued to record positive net
inflows in 3Q2021 and saw net inflows growing more than 90% YoY in 9M2021.
• Impacted by the massive sell off in Chinese property bond, the bond AUA of the Hong Kong
operation fell in 3Q2021 as a result of bond redemption and decline in bond market value.
• For the B2B division, while stocks and ETFs turnover grew 52% QoQ in 3Q2021, unit trust sales
(ex-switching) were sluggish and fell 42% QoQ in the quarter as adviser-assisted clients stayed
on the sideline for better investment opportunities. Bond turnover, on the other hand, grew
108% QoQ in 3Q2021 with slightly more than half of the turnover contributed by bond
redemption.
43Progress of Individual Markets
HONG KONG
• For the B2C division, stocks and ETFs turnover grew 54% QoQ in 3Q2021, while bond turnover
declined slightly by 4% QoQ after achieving a record high in 2Q2021. Although unit trust sales
(ex-switching) declined 10% QoQ in 3Q2021, it recorded an increase of 13% YoY in 9M2021.
• Despite the weak investors sentiment in 3Q2021, the iGM division has continued to devote
effort in promoting investor education and providing up-to-date commentaries via social media
including live webcasts. Such exposure would solidify both the iGM and iFAST brandings whilst
showcasing the company’s expertise in a variety of investment products.
• The Fintech Solutions division has seen stronger revenue growth in 3Q2021 on the account of
higher adoption in both standard and customised Fintech solutions offered by the company
during the period.
• The Hong Kong operation has set up the ePension division in September 2021. The division is
expected to help add a strong stream of income to the Group going forward.
44Progress of Individual Markets
MALAYSIA
• Net revenue for the Malaysia operation increased by 42.9% YoY to S$3.43 million in 3Q2021 and 56.6%
YoY to S$9.80 million in 9M2021.
• The AUA of the Malaysia operation grew 3.8% QoQ and 45.6% YoY to a record high of S$1.70 billion as at
30 September 2021 despite the recent market volatility.
• Compared to the high base in 1Q2021, unit trust sales of the Malaysia operation were relatively muted
in 3Q2021, registering a slight decline of 0.3%. While unit trust sales slowed marginally over the quarter,
sales of managed portfolios continued to see good progress in 3Q2021.
• The B2C division, FSMOne.com, saw its unit trust sales and new account openings remaining relatively
flat on a QoQ basis in 3Q2021 as heightened volatility and negative headline news from China led to
investors being more cautious.
• For the B2B division, while unit trust sales remained relatively flat in 3Q2021 as compared to 2Q2021,
bond turnover recorded a slight QoQ increase over the quarter.
45Progress of Individual Markets
MALAYSIA
• The B2B division launched a revamped mobile app for both the B2B and iGM clients in August 2021. The
newly revamped mobile app which features a more user friendly interface with better user experience
has garnered good feedback from its users.
• The B2B division has also launched the Bursa, US, and Hong Kong stockbroking services in September
2021, providing wealth advisers and advisers-assisted investors access to a more comprehensive suite of
wealth management products and services. Following the launch, B2B advisers and investors can enjoy
seamless view of their consolidated investment holdings via a single account and login.
• With the successful launch of the US and Hong Kong stockbroking services, the Malaysia operation has
seen encouraging pick up in trading activities of overseas stocks and ETFs, especially in the US counters.
Moving forward, the Malaysia operation is looking to introduce Singapore stockbroking services to its
investors.
46Progress of Individual Markets
CHINA
• Net revenue for the China operation grew 13.9% YoY to S$0.66 million in 3Q2021 and 69.5%
YoY to S$1.88 million in 9M2021.
• On a QoQ basis, net revenue rose 38% QoQ with growth seen in both the recurring and non-
recurring net revenue.
• Despite the uncertain market conditions, the AUA of the China operation recorded a positive
growth of 16.2% QoQ and 109.5% YoY, and stands at over RMB 2.37 billion (equivalent to
S$499 million) as at 30 September 2021.
• In 3Q2021, the economic growth of China has been affected by a series of uncertainties such
as the impact of power shortages, production restrictions under the ‘dual carbon’ goals, and
debt crisis of property developers along with its possible implications for the banking and
insurance sectors.
47Progress of Individual Markets
CHINA
• With the increasing volatility in the market, investment sentiments are deeply split. Despite so,
the China operation remains positive on the China equity markets on account of its strong
fundamentals and policy sensitivity.
• On the whole, the China operation continues to post positive growth in both revenue and AUA
in spite of the choppy market conditions in 3Q2021 . Moving forward, the Company will
continue to work on improving its suite of products and services to better serve its clients in
China.
48Progress of Individual Markets
INDIA
• As at 30 September 2021, iFAST Corp holds an effective 39.48% share in iFAST Financial
India Pvt Ltd, the key business of the Group’s India business, which engages in the
distribution of wealth management products in India.
• The AUA of the India operation increased 26.4% YoY and 7.1% QoQ to India Rupee
31.77 billion (equivalent to S$582 million) as at 30 September 2021.
• The India operation has launched the direct US equities service for Registered
Investment Advisers (RIA) and advisory clients in September 2021. With the launch of
the new service, iFAST India can now help Registered Investment Advisers (RIA) charge
and recover fees on US Stocks and ETFs investment in India.
49SECTION IV
Appendices
50Business Overview
• iFAST Corporation Ltd. is a wealth management fintech platform with assets under administration (AUA) of
S$18.38 billion as at 30 September 2021 (stock code: AIY).
• Main business divisions:
o Business-to-Consumer (B2C): FSMOne.com (formerly “Fundsupermart”) a multi-product online wealth
management platform targeted at DIY investors (AUA: S$5.53 billion);
o Business-to-Business (B2B): Caters to the specialised needs of over 540 financial advisory (FA) companies,
financial institutions and banks (AUA: S$12.85 billion), which in turn have more than 11,000 wealth
advisers; and
o Emerging Fintech Solutions / Business-to-Business-to-Consumer (B2B2C) Model: iFAST Fintech Solutions
was launched to provide customisable Fintech solutions for our B2B clients and business partners to
empower them with B2C Fintech capabilities.
• The Group offers access to over 14,000 investment products including unit trusts, bonds and Singapore
Government Securities (SGS), stocks, Exchange Traded Funds (ETFs), insurance products, and services including
discretionary portfolios, research and investment seminars, fintech solutions, and investment administration and
transaction services.
• Our mission statement is, “To help investors around the world invest globally and profitably”.
51Milestones
Launch of iFAST Platform Acquired a stake in the holding
Services (B2B) in Hong Kong Incorporation of iFAST company of iFAST India Business
Launch of iFAST Launch of Fundsupermart.com Platform Services (Shenzhen) Launch of HKEX stockbroking on
Platform Services (B2C) and iFAST Platform Qianhai in China (CN) HK B2B platform
(B2B) in Singapore Services (B2B) in Malaysia (MY) Listing on SGX-ST Mainboard Launch of Insurance on FSM MY
Launch of FSMOne in SG
2000 2007 2011 2015
>>>
2002 2008 2014 2016
Launch of “FSM Mobile”
iPhone application. The
Launch of Android version of the “FSM
Distribution of bonds and ETFs in SG
Fundsupermart.com (B2C) Mobile” was launched in the
Launch of online discretionary portfolio
in Singapore (SG) Launch of following year
management service (DPMS) in HK
Fundsupermart.com Received Funds Distributor
(B2C) in Hong Kong (HK) Qualification in CN
52Milestones
Launch of US stockbroking in HK iFAST SG received the “Fastest Growing SGX-ST
iFAST Corp won the "Best Investor Relations Member” award for the second consecutive year
- Silver Award" in the small cap category at Launch of revamped FSMOne mobile applications
the Singapore Corporate Awards (SCA) 2018 in SG, HK and MY
Launch of FSMOne in MY Registered as Private Fund Manager in CN
2017 2019 2021
2018 2020
Launch of HKEX stockbroking on FSM HK iFAST SG clinched “Fastest Growing FSM MY launched Bursa stockbroking in March
Launch of online DPMS in MY SGX-ST Member” award iFAST SG acquired the fund management business of DWS
Admitted as Trading Member of SGX-ST iFAST MY launched retail bonds under Investment Singapore in April
and Clearing Member of CDP in SG the new Seasoning Framework iFAST HK was approved as Exchange Participant and
Launch of SGX stockbroking in SG Launch of iFAST Global Markets (iGM) Clearing Participant for China Connect Securities from
Launch of FSMOne in HK mobile app in SG and HK HKEX in May; launched China A-Shares trading services in
Launch of iFAST Fintech Solutions iFAST Corp won the “Best Investor HK and SG in June and October respectively
Launch of US stockbroking on FSM SG Relations – Bronze Award” at SCA 2019 iFAST Corp clinched Runner-Up for the “Most Transparent
Company Award 2021 - Financials” and “Shareholder
Communication Excellence Award 2021 - Mid Cap” at the
SIAS Investors’ Choice Awards 2021 in October
53iFAST Fintech Ecosystem
(as at 30 Sep 2021)
Connecting All to Help Investors Invest Globally and Profitably
B2C Fundsupermart.com / FSMOne.com /
Fund
Houses Bondsupermart
Holds relevant
licences in 5
markets
FA Companies
Banks/ Over
Bond Dealers 650,000
customer
accounts Over 540 companies,
in 5 Financial and
markets Institutions over 11,000
wealth advisers
Stock
use iFAST B2B
Exchanges
Fintech Research & platforms
Solutions Advisory
across 5 markets
Capabilities Banks
Investment
Insurance Products Cash Management B2B
Companies & & Services facilities B2B2C Internet
Other Product Companies
Providers
Access to iFAST’s Infrastructure & Distribution Network in 5 markets
54The iFAST Fintech Ecosystem
• Products and services:
─ Unit trusts (over 9,400 funds from over 280 fund houses)
─ Bonds (over 1,500 direct bonds)
─ Stocks & ETFs – in 5 markets (Singapore, Hong Kong, US, Malaysia & China A Shares)
─ Discretionary portfolio management services
• Over 540 financial institutions and other corporations and over 11,000 wealth advisers using
the platform
• Over 650,000 customer accounts in five markets
• Leading wealth management Fintech platform in Asia’s two international financial centres
(Singapore and Hong Kong)
• Presence in Asia’s two giants markets (China and India), with linkages to Singapore and Hong
Kong increasingly strengthened
55The Revenue Drivers
• The iFAST business model predominantly involves growing the size of our assets under
administration (AUA). Higher AUA will generally lead to higher revenues.
• Recurring income accounts for more than two thirds of our net revenue
• Sources of Recurring Net Revenue
o Trailer fees, platform fees, wrap fees
o Net interest income
o Fintech solutions IT maintenance fees
• Sources of Non-Recurring Net Revenue
o Transaction fees – unit trusts, bonds, stocks, ETFs
o Forex conversions
o Fintech solutions IT development fees
o Insurance commissions
• In recent times, the sources of the Group’s net revenue have broadened. The contributions
from net interest income arising from clients’ AUA and Fintech solutions IT fees have become
more important.
56Breakdown of Net Revenue (FY2020)
Fintech Solutions IT fees,
Others, 1.4%
2.8%
FX Margin, 7.4%
Transaction
Fees/Commission Income
(Other Products), 12.8%
Trailer Fee, 42.3%
Transaction
Fees/Commission Income
(UT and Portfolio
Management Services), 5.5%
Net Interest Income Arising
from Clients' AUA, 5.8%
Platform Fee, 15.8% Wrap Fee, 6.2%
57Licences Held and Products and Services Available
(as at 30 September 2021)
LICENCES HELD :
• Fund Distributor Qualification [CSRC]
• Associate Member of AMAC
• Member of SAMC
• Registered Private Fund Manager [AMAC]
PRODUCTS AVAILABLE : UT
LICENCES HELD:
• Type 1: Dealing in Securities [SFC]
• Type 4: Advising on Securities [SFC]
• Type 9: Asset Management [SFC]
• MPFA
LICENCES HELD : • SEHK Participant
• Registered Investment Adviser with SEBI • HKSCC Participant
• Registered Mutual Fund Distributor with • China Connect Exchange and Clearing Participant [HKEX]
Association of Mutual Funds in India • Licensed Insurance Broker with Insurance Authority
• Bombay Stock Exchange (BSE) PRODUCTS AVAILABLE : UT / Bonds / Stocks / ETFs / DPMS
• Central Depository Services (India) Ltd
• Approved person of Central Insurance
Repository Ltd. LICENCES HELD :
PRODUCTS AVAILABLE : UT / Stocks • Capital Market Services Licence [SC]
• Registered IUTA and IRPA [FIMM]
• Financial Advisers Licence [BNM] [SC]
LICENCES HELD: • Participating Organisation of Bursa Malaysia [SC]
• Capital Markets Services Licence [MAS] PRODUCTS AVAILABLE : UT / Bonds / Stocks /DPMS / Insurance
• Financial Adviser Licence [MAS]
• Exempt Insurance Broker [MAS]
• SGX Trading Member [SGX]
• CDP Depository and Clearing Agent [CDP]
PRODUCTS AVAILABLE:
UT / Bonds / Stocks / ETFs / DPMS / Insurance
58Our Value Proposition
B2B B2C
PRODUCT PROVIDERS
CUSTOMERS DIY INVESTORS
• One platform, multiple • One platform, multiple investment products • One platform, multiple
B2C and B2B customers • Adoption of recurring revenue business model investment products
• No need to enter into based on Assets Under Administration (“AUA”) • Competitive and transparent
individual distribution • Platform performs efficient collection of fees fee structure
agreement and business • IT solutions and backroom functions managed • Award-winning websites and
relationship with by platform mobile applications
customers • Competitive fee-sharing structure • Availability of Investment
• Research into investment products Advisers if advice is required
• Adoption of a wrap account which seamlessly • Online discretionary portfolio
combines multiple investment product management services (DPMS)
categories into one account
• Online discretionary portfolio management
services (DPMS)
59Fees Illustration
FUND HOUSES
TRAILER FEE
PLATFORM FEE
PLATFORM FEE
B2B CUSTOMERS UPFRONT FEE B2C CUSTOMERS
UPFRONT FEE
WRAP FEE
FX CONVERSION FEES
B2B FINANCIAL OTHER
ADVISORY COMPANIES FINTECH SOLUTIONS
FACILITIES
SERVICE FEES
609M2021: Activities & Achievements
(L-R): iFAST Corp received the "Best Performing Stock", "Best Weighted Return on Equity", and "Overall Sector Winner" awards in the banking and investment services sector at the Billion Dollar
Club 2021 organised by The Edge Singapore in September; iFAST Corp clinched Runner-Up for the “Most Transparent Company Award 2021 - Financials” and “Shareholder Communication
Excellence Award 2021 - Mid Cap” at the SIAS Investors’ Choice Awards 2021 in October.
(L-R): iFAST Malaysia launched US and Hong Kong stockbroking services on its FSMOne.com and B2B platform in July and September respectively;
FSMOne.com SG launched the FSMOne Investment Academy in July to help investors learn new insights from the various partners it worked with;
iFAST Hong Kong partnered the Hong Kong Family Welfare Society to bring joy and warmth to the elderly in need during the Mid-Autumn Festival in September.
61TO HELP INVESTORS AROUND THE WORLD
INVEST GLOBALLY AND PROFITABLY
THANK YOU!
For more information,
please visit: www.ifastcorp.com
iFAST Corporation Ltd.You can also read