Calcium Kidney Stones are Associated with Increased Risk of Carotid Atherosclerosis: The Link between Urinary Stone Risks, Carotid Intima-Media ...
←
→
Page content transcription
If your browser does not render page correctly, please read the page content below
Journal of
           Clinical Medicine

Article
Calcium Kidney Stones are Associated with Increased
Risk of Carotid Atherosclerosis: The Link between
Urinary Stone Risks, Carotid Intima-Media
Thickness, and Oxidative Stress Markers
Ho Shiang Huang 1,2 , Pao Chi Liao 3 and Chan Jung Liu 1, *
 1    Department of Urology, National Cheng Kung University Hospital, College of Medicine, National Cheng
      Kung University, Tainan 70403, Taiwan; hshuang54@gmail.com
 2    Department of Urology, College of Medicine, National Cheng Kung University, Tainan 70403, Taiwan
 3    Department of Environmental and Occupational Health, Medical College, National Cheng Kung University,
      Tainan 70403, Taiwan; liaopc@mail.ncku.edu.tw
 *    Correspondence: dragon2043@hotmail.com; Tel.: +886-6-235-3535 (ext. 5251); Fax: +886-6-276-6179

 Received: 7 February 2020; Accepted: 6 March 2020; Published: 8 March 2020

 Abstract: Previous studies have suggested that kidney stone formers are associated with a higher
 risk of cardiovascular events. To our knowledge, there have been no previous examinations
 of the relationship between carotid intima-media thickness (IMT) and urinary stone risk factors.
 This study was aimed toward an investigation of the association between dyslipidemia, IMT,
 and 24-hour urinalysis in patients with calcium oxalate (CaOx) or calcium phosphate (CaP) stones.
 We prospectively enrolled 114 patients with kidney stones and 33 controls between January 2016 and
 August 2016. All patients were divided into four groups, according to the stone compositions—CaOx
 ≥ 50% group, CaP group, struvite group, and uric acid stones group. Carotid IMT and the carotid
 score (CS) were evaluated using extracranial carotid artery doppler ultrasonography. The results of a
 multivariate analysis indicated that a higher serum total cholesterol (TC) and low-density lipoprotein
 (LDL) were all associated with lower urinary citrate and higher CS in both the CaOx ≥ 50% and CaP
 groups. Higher serum TC and LDL were also associated with increased serum 8-OHdG levels in both
 groups. The levels of carotid IMT and CS in the CaOx ≥ 50% and CaP groups were all significantly
 higher than in the controls. These findings suggest a strong link between dyslipidemia, carotid
 atherosclerosis, and calcium kidney stone disease.

 Keywords: atherosclerosis; kidney stone; hyperlipidemia; carotid intima-media thickness;
 hypercholesteremia; oxidative stress

1. Introduction
     A complete picture of the mechanisms involved in kidney stone disease is still not available
although several factors and steps involved in the crystallization and stone formation in kidneys
have been elucidated [1]. However, urologists are often puzzled to find patients with recurrent stone
disease despite having “normal” 24-hour urine, and patients whose urine have been modified with
drug therapy and nonetheless continue to form additional stones [2]. In fact, kidney stone disease is
thought to be a systemic disease [3] and is linked with a number of other chronic diseases, such as
cardiovascular disease (CVD) [4], chronic kidney disease [5], and diabetes mellitus [6].
     In addition to free and fixed particle theories and the Randall plaque hypothesis of stone
pathogenesis, a vascular theory of Randall plaque formation has also been suggested [7]. Although the
precise mechanisms underlying the association between kidney stone disease and CVD remain to be

J. Clin. Med. 2020, 9, 729; doi:10.3390/jcm9030729                                 www.mdpi.com/journal/jcm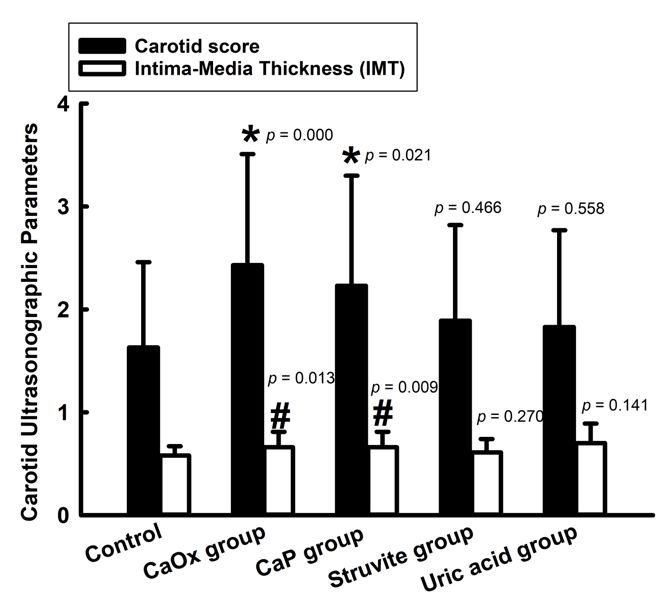
J. Clin. Med. 2020, 9, 729                                                                        2 of 14

elucidated, one potential risk factor could be atherosclerosis, as supported by the CARDIA study [8].
Production of reactive oxygen species (ROS) and development of oxidative stress is a common feature
of CVD and calcium oxalate (CaOx) stone disease [9]. However, the association between atherosclerosis
and Ca-containing kidney stone disease requires further investigation.
     It is generally believed that atherosclerotic changes in the carotid artery mirror general
atherosclerosis [10]. Ultrasound measurements of the intima media thickness (IMT) in the carotid
arteries have been used as an indicator of coronary atherosclerosis [11]. The severity of carotid
atherosclerosis can also be evaluated by the plaque score and maximum percentage stenosis on
sonograms [12].
     To test the hypothesis that calcium-containing stone disease (CaOx or calcium phosphate, CaP)
is associated with atherosclerosis, we conducted a prospective study to identify the association of
serum total cholesterol (TC), high-density lipoprotein cholesterol (HDL), and low-density lipoprotein
cholesterol (LDL), on 24-hour urine chemical components and stone composition (CaOx and CaP).
Then, the relationships among Ca-containing stone disease, serum cholesterol levels, and the severity
of atherosclerosis were evaluated, as compared to the controls. The impact of serum major markers
of inflammation and ROS were also evaluated and compared to the controls in order to define
their association.

2. Materials and Methods

2.1. Study Population
     This prospective study was approved by the ethics committee at National Cheng Kung University
Hospital (NCKUH) (B-ER-103-400) on 27th, March, 2015. Patients admitted to the urologic ward from
January 2016 to August 2016 for surgical intervention (endoscopic or percutaneous surgery) whose
stones had been analyzed with infrared spectroscopy were eligible for enrollment. Written informed
consent was collected from every enrolled patient. Patients younger than 18 years and patients on
statins or stone-related medications were excluded. We also enrolled 33 healthy volunteers, matched
by gender, as controls. None of the controls had urolithiasis, as indicated by imaging studies, and none
had a previous stone history. The confounders were adjusted using multiple logistic regression analysis.
The criteria of controls was according to our previous published study and other studies [3,13].

2.2. Classification of Patients by Stone Type
     Each patient was classified based on his/her stone composition as follows [14]: (1) CaOx ≥ 50%
group—CaOx component ≥ 50% with or without any CaP; (2) CaP group—containing any brushite
(BR, CaHPO4·2H2O) or Ca3(PO4)2 with or without any CaOx; (3) struvite (ST) group when containing
any ST; (4) uric acid (UA) group when containing any UA. At least one 24-hour urinalysis and a single
fasting lipid profile evaluation were performed three weeks after stone removal. Some of the blood
samples were sent to the NCKUH central laboratory for a lipid profile analysis, and the others were
centrifuged at 3000 rpm for 10 min, and the serum was frozen at −20 ◦ C, until further analysis.

2.3. The Protocol of Chemical Analyses
      The 24-hour urine specimen was sent to the NCKUH central laboratory for pH, calcium
(Ca), phosphate (P), uric acid (UA), and creatinine (Cr) determination. Urine oxalate and citrate
levels were assayed with commercial ELISA kits (BioVision, Miloitas, CA, USA). Urine anti-lithic
proteins—osteopontin (OPN) and Tamm-Horsfall protein (THP) were assayed using commercial ELISA
kits (Cloud-Clone Corp., Houston, TX, USA). Urinary supersaturation with respect to CaOx and CaP
was assessed using the index proposed by Tiselius et al. [15]—AP(CaOx)index by (2.09 × Ca0.84
× oxalate)/(citrate0.22 × Mg0.12) and AP(CaP)index by (0.432 × Ca1.07 × (pH−4.5)6.8)/Citrate0.20.
Serum levels of total cholesterol (TC) and high- and low-density lipoprotein cholesterol (HDL-C
and LDL-C) were measured at the Central Laboratory at NCKUH. The serum oxidative stress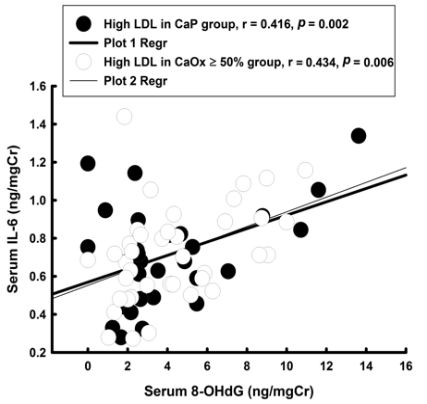
J. Clin. Med. 2020, 9, 729                                                                           3 of 14

marker—8-hydroxy-deoxyguanosine (8-OHdG), the marker for nitrosative stress (nitrotyrosine (NT)),
acute inflammation markers (interleukin 6 (IL-6)), neutrophil gelatinase associated lipocalin (NGAL),
and adhesion molecule—vascular cell adhesion molecule 1 (VCAM1) were assayed with commercial
ELISA kits (all from Cloud-Clone Corp., Houston, TX, USA). All markers were assayed from the serum
specimen and adjusted according to their serum creatinine levels.

2.4. Carotid Artery Ultrasound Evaluation
     Ultrasonographic scans of the extracranial carotid arteries were performed by well-trained,
protocol-adherent technicians in the department of Neurology, NCKUH, for which the procedures
were the same, as described previously [16]. The severity of carotid atherosclerosis in each subject
was evaluated using three parameters—intima-media thickness (IMT), maximum percentage stenosis,
and carotid score (CS) for IMT and plaques. The IMT was measured as the distance between the
leading edges of the lumen-intimal and media-adventitia interfaces on the far wall of the common
carotid artery (CCA). The segment extending from 10 mm proximal to the carotid bulb was scanned
through three different longitudinal measurements (anterior, lateral, and posterior) [16]. The maximum
IMT was the greatest thickness of the wall, including plaque lesions [16]. The maximum percentage
stenosis was computed by measuring the residual lumen diameter and the original diameter at the
maximal stenosis site and dividing the difference by the original diameter [17]. The scoring system
for the carotid score (CS) was—0: IMT < 0.8 mm with no plaque; 1: IMT ≥ 0.8 mm with no plaque;
2: plaque < 50%; 3: when plaque ≥ 50% and < 70%; 4: plaque ≥ 70%; and 5: total occlusion.

2.5. Statistical Analysis
     SPSS for Windows (version 17.0, SPSS Inc., Chicago, IL, USA) was used for all statistical analyses.
All data are shown as a proportion, or as mean ± SD. Serum TC, HDL, and LDL levels were analyzed
as dichotomous variables (abnormal vs. normal), to compare with the 24-hour urine chemical data and
carotid artery atherosclerosis parameters, in order to understand their relationships to stone risk in
CaOx ≥ 50% and CaP stone patients.
     We used either the Mann-Whitney U test or a one-way analysis of variance (ANOVA),
as appropriate, to compare the continuous variables. The Fisher’s exact test was used to compare the
categorical variables with the controls for the 24-hour urine chemical parameters, carotid sonographic
parameters, and serum markers. A multivariate analysis with a logistic regression was then performed
to confirm which variables still significantly correlated with the abnormal cholesterol levels. The Pearson
product-moment correlation method was used to determine and compare the correlation coefficients
(r values) for the carotid artery ultrasonographic scan parameters and the serum 8-OHdG and other
serum markers. Differences were regarded as significant at p < 0.05.

3. Results
     There were 114 patients with kidney stone disease (including UPJ stones) and 33 controls
included in this study (Table 1). Only thirty patients had pure stone compositions, whereas the
remainder were mixed-type kidney stones. Ninety-four patients in the kidney stone group were
within the Ca-containing stones. The major stone compositions in this cohort were CaOx (76.3%)
and CaP (79.8%) (Table S1). Compared to controls, patients in the Ca-containing stone group had
no significant between-group differences in gender, BMI, and age, but other stone type patients
(ammonium magnesium, uric acid, sodium urate) had significantly older, higher BMI, and more
females (as compared to the controls). With respect to 24-hour urine chemicals, Ca-containing kidney
stone patients had increased urine oxalate levels and significantly decreased urine levels of citrate and
OPN, as compared to the controls.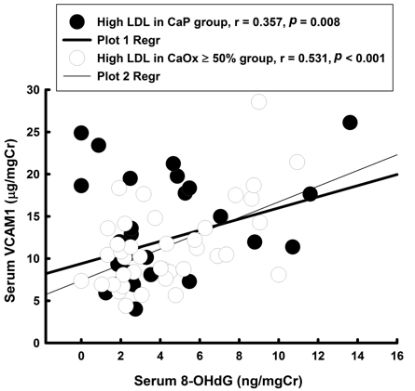
J. Clin. Med. 2020, 9, 729                                                                                                   4 of 14

      Table 1. Demographic data, 24-hour urinary chemicals, and stone composition in 147 patients. Data
      presented as mean ± SD.

               Variables             Control (C)                                     Kidney Stone
                                                           Ca-Containing Stone                      Other Stone Types #
                                       (n = 33)          (n = 94)        p Value (vs. C)      (n = 20)         p Value (vs. C)
                Age                   49.8± 12.9       52.4 ± 12.8           0.158           58.6 ± 13.0           0.021 *
           BMI (Kg/m2 )               24.9 ± 3.5       26.4 ± 4.4            0.065            26.9 ± 4.6           0.034 *
              % Male                     63.6             70.2               0.488               30.0              0.019 *
           Comorbidity
   % Elevated fasting blood sugar        24.2              34.0              0.301              50.0               0.059
          % Increased BP                 24.2              32.9              0.353              50.0               0.235
        % Large Abd. Circ.                9.1              23.4              0.077              25.0               0.124
         % High TG level                 18.2              35.1              0.071              30.0               0.330
        % Reduced HDL-C                  42.4              58.5              0.113              50.0               0.602
                                                       24-h urinalysis
                   pH                  6.0 ± 0.7         6.0 ± 0.7            0.542            6.2 ± 0.7           0.188
               Volume (L)               2.1 ± 0.7        2.2 ± 0.7            0.316            2.3 ± 0.7           0.472
           Calcium (mg/day)           191.6 ± 83.3    224.1 ± 144.7           0.509         147.4 ± 100.2          0.089
               P (mg/day)            713.9 ± 225.5    745.9 ± 433.1           0.843         673.0 ± 246.9          0.373
           Uric acid (mg/day)        666.7 ± 186.3    668.0 ± 289.2           0.873         550.7 ± 206.3         0.019 *
             Mg (mg/day)              97.3 ± 31.4      106.7 ± 88.9           0.952           80.5 ± 38.7         0.015 *
           Oxalate (mg/day)           27.7 ± 11.8       65.5 ± 83.2          0.006 *         52.16 ± 37.9         0.021 *
            Citrate (mg/day)         373.8 ± 58.9     250.3 ± 124.6
J.J. Clin.
     Clin. Med.
           Med. 2020,
                2020, 9,
                      9, x729
                           FOR PEER REVIEW                                                                                             55 of
                                                                                                                                          of 15
                                                                                                                                             14

      Figure 1. Carotid score and intima-media thickness (IMT) of carotid artery ultrasonographic scans in
      Figure  1. Carotid
      the different stonescore
                           groups.     p < 0.05 carotid
                                 and*:intima-media    thickness  (IMT)
                                                         score was      of carotiddifferent
                                                                    significantly  artery ultrasonographic scansthe
                                                                                            when compared with    in
      the different
      control.       < 0.05groups.
                #: p stone   IMT was *: significantly
                                        p < 0.05 carotid  score was
                                                       different when significantly different
                                                                        compared with         when compared
                                                                                          the control.         with
                                                                                                       Abbreviation:
      the control.
      CaOx,        #: p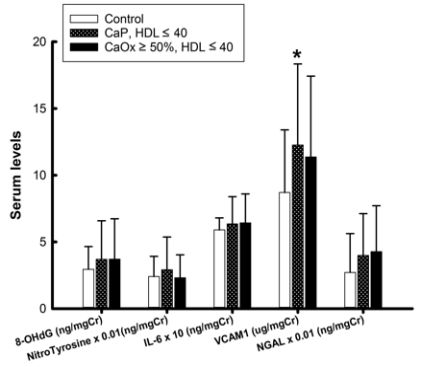
J. Clin. Med. 2020, 9, 729                                                                                                                                                                           6 of 14

                                             Table 2. Demographic, 24-hour urinary chemical data, and carotid score in the CaOx ≥ 50% group.

             Variables         Control                                                                                  CaOx ≥ 50% Group
                                                          TC (mg/dL)                                            HDL (mg/dL)                                     LDL (mg/dL)
                                                   40          p Value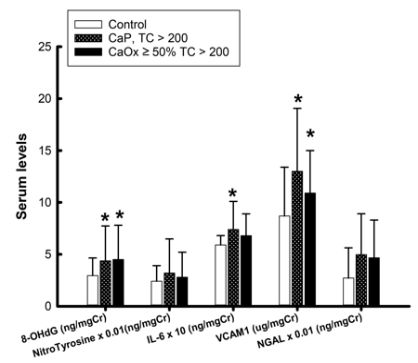
J. Clin. Med. 2020, 9, 729                                                                                                                                                                     7 of 14

                                               Table 3. Demographic, 24-hour urinary chemical data, and carotid score in the CaP group.

             Variables         Control                                                                               CaP Group
                                                        TC (mg/dL)                                           HDL (mg/dL)                                  LDL (mg/dL)
                                                 40          p Value
J. Clin. Med. 2020, 9, 729 8 of 14
After adjusting by age and sex (Table 4), in the multivariate analysis, only urinary citrate levels
(OR = 0.970, p = 0.003 in CaOx ≥ 50% group; OR = 0.970, p = 0.001 in CaP group) and CS (OR = 15.291,
p = 0.013 in CaOx ≥ 50% group; OR = 2.964, p = 0.032 in CaP group) still had a significant association
with higher serum TC in both groups. In patients with lower serum HDL levels, only CS (OR = 3.885,
p = 0.015) and urinary citrate level (OR = 0.987, p = 0.022) in the CaP group remained significantly
associated with lower HDL levels, when examined using a multivariate logistic regression analysis,
after adjusting by age and sex (Table 4). In patients with higher serum LDL levels, urine levels of
urinary citrate CS remained significantly associated with higher serum HDL in both groups, and the
urine oxalate level was only significantly associated with higher serum LDL levels in the CaP group
(OR = 1.030, p = 0.020) (Table 4).
Table 4. Risk factors in each stone group compared to the controls, using a logistic regression with
abnormal serum cholesterol levels (adjusted by age and sex).
Groups CaOx ≥ 50% CaP
OR 95%CI p Value OR 95%CI p Value
TC ≥ 200 vs. Control
Urine Citrate 0.970 0.951–0.990 0.003 0.970 0.953–0.987 0.001
Abd. Circ. 1.085 0.976–1.206 0.131 1.045 0.963–1.135 0.294
Urine Protein 0.999 0.994–1.004 0.758 1.001 0.997–1.005 0.617
Carotid score 15.291 1.778–131.492 0.013 2.964 1.100–7.983 0.032
HDL 5 40 vs. Control
Urine Citrate 0.992 0.982–1.002 0.127 0.987 0.976–0.998 0.022
Urine OPN 0.995 0.936–1.058 0.874 1.023 0.950–1.102 0.543
Urine Protein 1.004 0.999–1.008 0.097 1.003 0.999–1.007 0.105
Carotid score 1.941 0.761–4.947 0.165 3.885 1.297–11.632 0.015
LDL ≥ 100 vs. Control
Urine Citrate 0.857 0.759–0.969 0.014 0.914 0.871–0.958 0.000
Urine Oxalate 1.043 0.990–1.099 0.115 1.030 1.005–1.057 0.020
Urine Protein 1.001 0.997–1.005 0.570 1.004 0.999–1.008 0.113
Carotid score 4.786 1.327–17.258 0.017 3.582 1.435–8.943 0.006
Abbreviations: OR, Odds ratio; CI, Confidence interval; TC, Total cholesterol; CaOx, Calcium oxalate; CaP, Calcium
phosphate; Abd. Circ., Abdominal circumference.
In the univariate analysis results, it was found that patients with higher serum levels of TC
and LDL had significantly higher serum levels of 8-OHdG and VCAM1 in both stone groups, as
compared to the controls (Figure 2A,C); patients with high serum LDL levels in both stone groups
had higher serum NGAL levels, as compared to the controls (Figure 2C). Higher serum IL-6 levels
were found only in the CaP patients with higher serum TC levels (Figure 2A). Patients in the CaP
group with lower serum HDL levels had significantly higher serum VCAM1 levels, as compared to the
controls. In the multivariate analysis results after adjusting by sex and age, only the serum 8-OHdG
levels remained significantly associated with high serum TC in both stone groups (Table 5). Lower
serum HDL remained significantly associated with serum 8-OHdG and VCAM1 in the CaP group.
In the higher LDL stone subgroup, serum 8-OHdG and NGAL remained significantly associated with
high serum LDL levels in the CaOx ≥ 50% group, whereas serum 8-OHdG and VCAM1 remained
significantly associated with high serum LDL levels in the CaP group.J. Clin. Med. 2020, 9, 729 9 of 14
J. Clin. Med. 2020, 9, x FOR PEER REVIEW 10 of 15
(A) (B) (C)
(D) (E) (F)
Figure 2.2. Serum
Figure Serummarkers
markersof of inflammation
inflammation andand oxidative
oxidative stressstress compared
compared to the controls
to the controls in stone in stone
patients
patients with CaOx and CaP, respectively. (The Nitro Tyrosine data was reduced
with CaOx and CaP, respectively. (The Nitro Tyrosine data was reduced 100X; IL-6 was magnified 10X, 100X; IL-6 was
and neutrophil gelatinase associated lipocalin (NGAL) was reduced 100X from the original valuesthe
magnified 10X, and neutrophil gelatinase associated lipocalin (NGAL) was reduced 100X from in
original2A–C.
Figure values(A), TC > 200,
in Figure 2A,(B),
2B, HDL
and 2C. (A),(C)
≤ 40, TCLDL
> 200, (B), HDL
≥ 100. ≤ 40 , (C) LDL
(D). Correlation ≥ 100. serum
between (D). Correlation
8-OHDG
between
and VCAM1; serum(E).8-OHDG andbetween
Correlation VCAM1;serum(E). Correlation
8-OHdG and between serum
IL-6; (F). 8-OHdG
Correlation and IL-6;
between (F).
urinary
Correlation
Oxalate levelbetween urinary
and serum NGAL Oxalate
level. level and serum NGAL level.
Table 5. Serum
Table 5. Serum markers
markers of
of inflammation
inflammation with
with abnormal
abnormal cholesterol levels compared
cholesterol levels compared to
to the
the controls,
controls,
using
using aa logistic
logistic regression
regression (adjusted
(adjusted by
by age
age and
and sex).
sex).
Groups Groups CaOx
CaOx ≥ 50%
≥ 50% CaP CaP
OR 95%CI p Value OR 95%CI p Value
OR 95%CI p Value OR 95%CI p Value
vs. ≥
TC ≥ 200 TC 200 vs. Control
Control
8-OHdG 1.622 1.015–2.592 0.043 1.614 1.096–2.375 0.015
8-OHdG 1.622 1.015–2.592 0.043 1.614 1.096–2.375 0.015
VCAM1 1.230 0.977–1.547 0.078 1.181 0.999–1.398 0.052
VCAM1 IL-6 1.230 47.49 0.977–1.547
0.147–52.456 0.078
0.190 4.8961.181 0.999–1.398
0.088–270.84 0.438 0.052
IL-6 HDL 5 4047.49 vs. Control 0.147–52.456 0.190 4.896 0.088–270.84 0.438
HDL≦40 vs. 8-OHdG
Control 1.275 0.863–1.886 0.223 1.623 1.021–2.581 0.041
8-OHdG VCAM11.275 1.144 0.863–1.886 0.956–1.369 0.142
0.223 1.2731.6231.037–1.562 0.021
1.021–2.581 0.041
IL-6 0.969 0.012–177.07 0.989 0.205 0.004–41.17 0.689
VCAM1 1.144 0.956–1.369 0.142 1.273 1.037–1.562 0.021
LDL ≥ 100 vs. Control
IL-6 8-OHdG 0.969 1.670 0.012–177.07
1.152–2.422 0.989
0.007 1.6940.205 0.004–41.17
1.206–2.378 0.002 0.689
LDL ≥ 100 vs. Control
VCAM1 1.149 0.978–1.351 0.092 1.164 1.012–1.338 0.033
8-OHdG NGAL 1.670 1.003 1.152–2.422 1.000–1.006 0.047
0.007 1.0021.6941.000–1.004 0.097
1.206–2.378 0.002
VCAM1
Abbreviations: OR,1.149
Odds ratio; CI,0.978–1.351
Confidence interval; TC,0.092 1.164
Total cholesterol; 1.012–1.338
CaOx, Calcium 0.033
oxalate; CaP, Calcium
phosphate; 8-OHdG, 8-Hydroxydeoxyguanosine; VCAM1, Vascular cell adhesion molecule 1; NGAL, Neutrophil
NGAL 1.003 1.000–1.006 0.047 1.002 1.000–1.004 0.097
gelatinase associated lipocalin.
Abbreviations: OR, Odds ratio; CI, Confidence interval; TC, Total cholesterol; CaOx, Calcium oxalate;
CaP, Calcium phosphate; 8-OHdG, 8-Hydroxydeoxyguanosine; VCAM1, Vascular cell adhesion
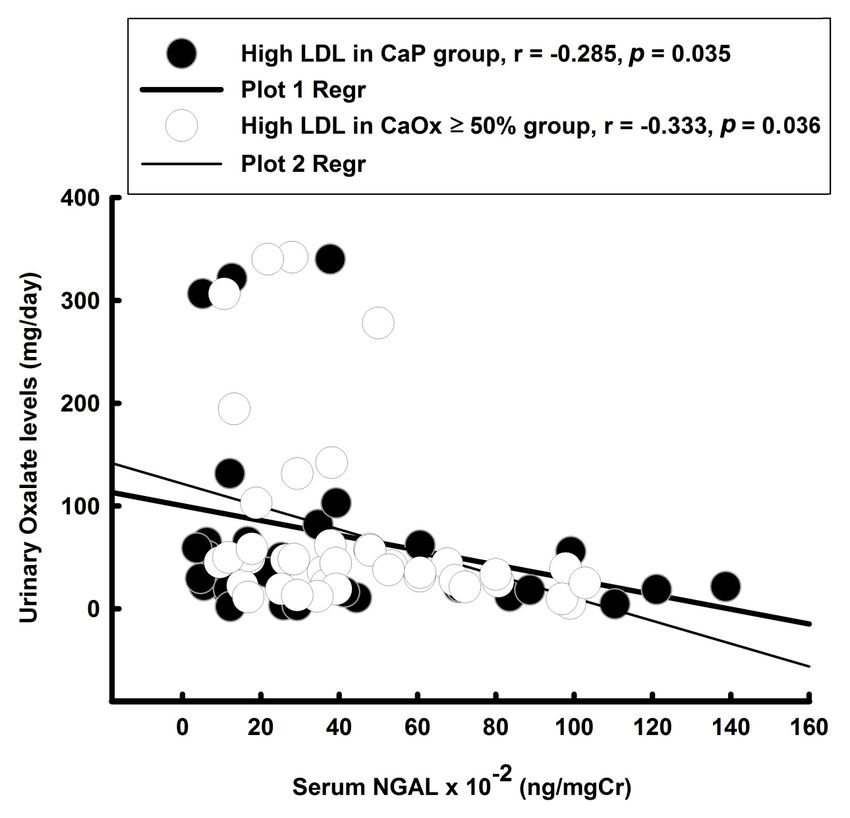
The correlation between serum markers and 24-hour chemical parameters was analyzed using a
molecule 1; NGAL, Neutrophil gelatinase associated lipocalin. Bold data, XXX.
Pearson product-moment correlation method. There were positive correlations found between serum
8-OHdG and VCAM1 (Figure 2D,E) and between serum 8-OHdG and IL-6, and a negative correlation
was found between serum NGAL and urinary oxalate level (Figure 2F).J. Clin. Med. 2020, 9, 729 10 of 14
4. Discussion
A significant association with atherosclerosis was found in patients with Ca-containing kidney
stones and dyslipidemia, as compared to the controls. In the multivariate analysis, after adjusting
by age and sex, only urinary citrate and carotid scores remained significantly associated with high
serum TC and high serum LDL levels in both stone groups and with low serum HDL in the CaP group.
Urine oxalate levels remained significantly associated with high serum LDL levels in the CaP group.
Serum 8-OHdG, a marker of oxidative damage of DNA, was significantly associated with high serum
TC and LDL levels in both stone groups, and was associated with low serum HDL in the CaP group.
The changes in serum 8-OHdG were positively correlated with serum VCAM1 and IL-6 levels in the
high LDL subgroup with Ca stone disease. Significantly elevated serum NGAL was only found in the
high serum LDL subgroup of Ca kidney stone patients and remained significantly associated with
high serum LDL in the CaOx ≥ 50% group in the multivariate analysis, after being adjusted by sex and
age, and was negatively associated with urinary oxalate levels.
4.1. A Comparison with Animal Studies
Rats fed with a cholesterol- and fat-rich experimental diet exhibited dyslipidemia, hyperoxaluria,
hypercalciuria, dysproteinuria, and CaP nephrocalcinosis [18]. In our clinical study, we found
hyperproteinuria, hyperoxaluria, hypocitrauria, but no hypercalciuria, in the higher serum LDL
subgroup of both stone patients. One animal study found that rats fed with high cholesterol diet also
exhibited high magnesuria [19]. However, our current clinical study failed to show hypermagnesuria
in stone patients when compared to the controls. Hyperproteinuria was found in all Ca stone patients,
and this result was consistent with an animal study [18] and another clinical report [20], but there was
no significant differences between the kidney stone patient and the controls in the 24-h Ccr. Some
authors have hypothesized that the retention of LDL and its potential oxidative modifications by
intrinsic cells (exhibiting higher atherogenic potential) within the glomerulus might initiate a cascade
of cellular events that are involved in the development of glomerulosclerosis [21].
4.2. Carotid Atherosclerosis is Associated with Ca-Containing Kidney Stone Disease
In present study, we found that patients with Ca-containing kidney stones had significantly
higher IMT and CS, as compared to the controls. In 2011, Reiner et al. first demonstrated that
young-to-middle-aged patients with self-reported kidney stone history were associated with subclinical
carotid atherosclerosis, using a 20-year longitudinal cohort database (CARDIA study) [8]. No more
studies have been conducted since to investigate the relationship between kidney stone and carotid
atherosclerosis. To compare with the results of CARDIA study, the current study provided information
about specific stone compositions and 24-hour urine chemistries in the patients with Ca-containing
stones, and evaluated their associations with carotid atherosclerosis. In addition, UA stone formers
were included in the CARDIA study, which has been proven to be associated with metabolic syndrome
and thus might be a source of bias in the CARDIA study.
4.3. The Link Connecting Atherosclerosis and Kidney Stone Formation
Both animal [22,23] and clinical studies [3] have demonstrated that increases in oxidative stress
in the kidneys of stone-forming patients and animals is indicated by the urinary excretion of ROS,
the production of lipid peroxidation, and renal tubular enzymuria. An in vitro cell culture study showed
that exposure to crystals, CaOx, and CaP leads to the development of oxidative stress [24]. Oxidative
stress also plays a significant role in atherogenesis [25]. An in vitro study showed that oxidized
low-density lipoproteins (ox-LDL) and oxidized lipoprotein induce O2- formation and apoptosis in
endothelial cells and in the cultured human mesangial cells [26]. Human monocyte/macrophage
studies have demonstrated that small, phagocytosable basic CaP crystals are more potent in terms
of inducing the release of tumor necrosis factor-α, compared with larger particles [27] and that theyJ. Clin. Med. 2020, 9, 729 11 of 14
can destabilize atherosclerotic plaques by initiating inflammation, causing vascular smooth muscle
cell death and plaque rupture [28]. This scenario of atherogenesis is similar to the vascular theory
of Randall plaque formation, which suggests that the repair of injured papillary vasculature in an
atherosclerotic-like fashion, results in calcification near vessel walls that eventually erodes a carbonate
apatite calculus into the papilla, through the renal papillary interstitium. The current clinical results
showed elevated serum oxidative stress markers in the higher serum TC and LDL CaP and CaOx
subgroups, as well as an association with serum VCAM1 and abnormal serum lipoproteins in the CaP
group. Interestingly, the serum VCAM1 levels increased significantly in all of the abnormal CaP stone
group serum cholesterol subgroups (i.e., high TC, Low HDL, and high LDL) and remained significantly
associated with low serum HDL levels. Cybulsky et al. [29] found that VCAM1, not ICAM1, plays a
more dominant role in the initiation of atherosclerosis and is a better marker for early atherosclerosis.
These findings suggest that vascular-induced plaque formation might play a role in kidney stone
formation, as theorized by Randall.
Apart from oxidative stress, chronic kidney disease (CKD) mineral and bone disorder (CKD-MBD)
is a systemic disorder that alters calcium homeostasis and affects cardiovascular morbidity and
mortality [30]. CKD-MBD involves the dysregulation of fibroblast growth factor 23 (FGF23)-Vitamin D
(Vit. D)—parathyroid hormone (PTH) axis, which not only leads to kidney stone formation but is also
associated with increased carotid IMT [31,32]. In our data, there was no significant difference in the level
of PTH between the Ca-containing stone group and the control group (43.7 ± 15.7 vs. 44.6 ± 11.6 pg/mL,
p = 0.664). In addition, no significant difference in the level of urinary Ca between the two groups was
found (Table 1). However, we lacked the data of FGF23 and Vitamin D. Further studies are warranted
to determine the role of CKD-MBD in the link between atherosclerosis and kidney stone formation.
4.4. Circulating NGAL Might Derive from the Toxic Effect of Urinary Oxalate
NGAL gained considerable diagnostic and prognostic value in kidney disorders as a valuable
marker of acute kidney injury [33]. In patients with coronary artery disease, levels of circulating NGAL
reflect the degree of the inflammatory process [34]. In present study, increased serum NGAL levels
were found only in the high LDL subgroup of CaOx ≥ 50% stone patients, which showed a negative
correlation with the urine oxalate levels only (r = −0.285, p = 0.0349 in CaP and r = −0.333, p = 0.036 in
CaOx ≥ 50% group), but had no correlation with the serum IL-6 levels. This result implies that patients
with CaOx kidney stones are at constant exposure to inflammatory insults, which might be generated
by the urinary oxalate level. Proximal tubule damage caused by high urinary oxalate levels in stone
patients might cause NGAL to leak into the urine and further decrease the serum NGAL levels. Thus,
we found a significant negative correlation between serum NGAL and urine oxalate levels in renal
stone patients.
There are some limitations in the current study. First, this study was a prospective clinical trial but
was still subject to potential selection biases. Second, our data did not provide any dietary information
from both groups. Especially urinary citrate excretion, diets rich in animal proteins were associated
with hypocitraturia and vegetarian rich diets associated with hypercitraturia [35]. Accordingly, our
results, which demonstrated the association between high cholesterol and hypocitraturia, are likely
to be related to dietary habits. Third, there is still controversy over the value of IMT and carotid in
predicting cardiovascular and cerebrovascular risks. Some studies suggested the association between
IMT and the cardiovascular risks is still inconclusive [36,37]. Finally, our study recruited a relatively
small number of cases. In the future, we intend to collect more cases to prove our observations.
5. Conclusions
Calcium kidney stone formers are associated with increased carotid artery atherosclerosis. Patients
with Ca-containing kidney stones have higher levels of serum LDL (69.7% in CaOx ≥ 50% group
and 70.3% in CaP group). Through multivariate regression analysis it was found that the carotidJ. Clin. Med. 2020, 9, 729 12 of 14
score, serum 8-OHdG level, and urine citrate levels were significantly associated with Ca-containing
stone diseases.
Supplementary Materials: The following are available online at http://www.mdpi.com/2077-0383/9/3/729/s1,
Table S1: Stone composition in patients with kidney stone group.
Author Contributions: Conceptualization, P.C.L. and H.S.H.; methodology, H.S.H.; software, H.S.H.; validation,
C.J.L., P.C.L., and H.S.H.; formal analysis, H.S.H.; investigation, H.S.H.; resources, P.C.L. and H.S.H.; data curation,
H.S.H.; writing—original draft preparation, P.C.L. and H.S.H.; writing—review and editing, C.J.L. and H.S.H.;
visualization, P.C.L. and H.S.H.; supervision, C.J.L. and H.S.H.; project administration, C.J.L. and H.S.H.; funding
acquisition, C.J.L. and H.S.H. All authors have read and agreed to the published version of the manuscript.
Conflicts of Interest: The authors declare no conflict of interest. The funders had no role in the design of the
study; in the collection, analyses, or interpretation of data; in the writing of the manuscript, or in the decision to
publish the results.
References
1. Xu, L.H.R.; Adams-Huet, B.; Poindexter, J.R.; Maalouf, N.M.; Moe, O.W.; Sakhaee, K. Temporal Changes in
Kidney Stone Composition and in Risk Factors Predisposing to Stone Formation. J. Urol. 2017, 197, 1465–1471.
[CrossRef] [PubMed]
2. Wollin, D.A.; Kaplan, A.G.; Preminger, G.M.; Ferraro, P.M.; Nouvenne, A.; Tasca, A.; Croppi, E.; Gambaro, G.;
Heilberg, I.P. Defining metabolic activity of nephrolithiasis—Appropriate evaluation and follow-up of stone
formers. Asian J. Urol. 2018, 5, 235–242. [CrossRef] [PubMed]
3. Ma, M.C.; Chen, Y.S.; Huang, H.S. Erythrocyte oxidative stress in patients with calcium oxalate stones
correlates with stone size and renal tubular damage. Urology 2014, 83, 510.e9–510.e17. [CrossRef]
4. Hsi, R.S.; Spieker, A.J.; Stoller, M.L.; Jacobs, D.R., Jr.; Reiner, A.P.; McClelland, R.L.; Kahn, A.J.; Chi, T.;
Szklo, M.; Sorensen, M.D. Coronary Artery Calcium Score and Association with Recurrent Nephrolithiasis:
The Multi-Ethnic Study of Atherosclerosis. J. Urol. 2016, 195, 971–976. [CrossRef] [PubMed]
5. Shoag, J.; Halpern, J.; Goldfarb, D.S.; Eisner, B.H. Risk of chronic and end stage kidney disease in patients
with nephrolithiasis. J. Urol. 2014, 192, 1440–1445. [CrossRef] [PubMed]
6. Weinberg, A.E.; Patel, C.J.; Chertow, G.M.; Leppert, J.T. Diabetic severity and risk of kidney stone disease.
Eur. Urol. 2014, 65, 242–247. [CrossRef] [PubMed]
7. Taylor, E.R.; Stoller, M.L. Vascular theory of the formation of Randall plaques. Urolithiasis 2015, 43, 41–45.
[CrossRef]
8. Reiner, A.P.; Kahn, A.; Eisner, B.H.; Pletcher, M.J.; Sadetsky, N.; Williams, O.D.; Polak, J.F.; Jacobs, D.R.;
Stoller, M.L. Kidney stones and subclinical atherosclerosis in young adults: The CARDIA study. J. Urol. 2011,
185, 920–925. [CrossRef]
9. Alelign, T.; Petros, B. Kidney Stone Disease: An Update on Current Concepts. Adv Urol. 2018, 2018, 3068365.
[CrossRef]
10. Van den Oord, S.C.; Sijbrands, E.J.; ten Kate, G.L.; van Klaveren, D.; van Domburg, R.T.; van der Steen, A.F.;
Schinkel, A.F. Carotid intima-media thickness for cardiovascular risk assessment: Systematic review and
meta-analysis. Atherosclerosis 2013, 228, 1–11. [CrossRef]
11. Naqvi, T.Z.; Lee, M.S. Carotid intima-media thickness and plaque in cardiovascular risk assessment.
Jacc Cardiovasc Imaging 2014, 7, 1025–1038. [CrossRef] [PubMed]
12. Ziegelbauer, K.; Schaefer, C.; Steinmetz, H.; Sitzer, M.; Lorenz, M.W. Clinical usefulness of carotid ultrasound
to improve stroke risk assessment: Ten-year results from the Carotid Atherosclerosis Progression Study
(CAPS). Eur. J. Prev. Cardiol. 2013, 20, 837–843. [CrossRef] [PubMed]
13. Ticinesi, A.; Milani, C.; Guerra, A.; Allegri, F.; Lauretani, F.; Nouvenne, A.; Mancabelli, L.; Lugli, G.A.;
Turroni, F.; Duranti, S.; et al. Understanding the gut-kidney axis in nephrolithiasis: An analysis of the gut
microbiota composition and functionality of stone formers. Gut 2018, 67, 2097–2106. [CrossRef] [PubMed]
14. Lieske, J.C.; Rule, A.D.; Krambeck, A.E.; Williams, J.C.; Bergstralh, E.J.; Mehta, R.A.; Moyer, T.P. Stone
composition as a function of age and sex. Clin. J. Am. Soc. Nephrol. 2014, 9, 2141–2146. [CrossRef] [PubMed]
15. Tiselius, H.G. A proposed method for approximate estimates of the ion-activity products of calcium oxalate
and calcium phosphate in spot-urine samples or in urine samples collected during less well defined periods
of time. Urolithiasis 2013, 41, 105–109. [CrossRef] [PubMed]J. Clin. Med. 2020, 9, 729 13 of 14
16. Jeng, J.S.; Sun, Y.; Lee, J.T.; Lin, R.T.; Chen, C.H.; Po, H.L.; Lin, H.J.; Liu, C.H.; Sun, M.C.; Chern, C.M.; et al.
The efficacy and safety of cilostazol in ischemic stroke patients with peripheral arterial disease (SPAD):
Protocol of a randomized, double-blind, placebo-controlled multicenter trial. Int. J. Stroke. 2015, 10, 123–127.
[CrossRef]
17. Handa, N.; Matsumoto, M.; Maeda, H.; Hougaku, H.; Ogawa, S.; Fukunaga, R.; Yoneda, S.; Kimura, K.;
Kamada, T. Ultrasonic evaluation of early carotid atherosclerosis. Stroke 1990, 21, 1567–1572. [CrossRef]
18. Schmiedl, A.; Schwille, P.O.; Bonucci, E.; Erben, R.G.; Grayczyk, A.; Sharma, V. Nephrocalcinosis and
hyperlipidemia in rats fed a cholesterol- and fat-rich diet: Association with hyperoxaluria, altered kidney and
bone minerals, and renal tissue phospholipid-calcium interaction. Urol. Res. 2000, 28, 404–415. [CrossRef]
19. Favaro, V.F.; Oshiro-Monreal, F.M.; de Braganca, A.C.; Andrade, L.; Seguro, A.C.; Helou, C.M. High
cholesterol feeding may induce tubular dysfunction resulting in hypomagnesemia. Kidney Blood Press Res.
2012, 35, 137–146. [CrossRef]
20. Imran, K.; Zafar, M.N.; Ozair, U.; Khan, S.; Rizvi, S.A.H. Metabolic risk factors in pediatric stone formers:
A report from an emerging economy. Urolithiasis 2017, 45, 379–386. [CrossRef]
21. Kamanna, V.S.; Bassa, B.V.; Kirschenbaum, M.A. Atherogenic lipoproteins and human disease: Extending
concepts beyond the heart to the kidney. Curr. Opin. Nephrol. Hypertens 1997, 6, 205–211. [CrossRef]
[PubMed]
22. Huang, H.S.; Ma, M.C.; Chen, J. Low-vitamin E diet exacerbates calcium oxalate crystal formation via
enhanced oxidative stress in rat hyperoxaluric kidney. Am. J. Physiol. Renal. Physiol. 2009, 296, F34–F45.
[CrossRef] [PubMed]
23. Huang, H.S.; Ma, M.C. High Sodium-Induced Oxidative Stress and Poor Anticrystallization Defense
Aggravate Calcium Oxalate Crystal Formation in Rat Hyperoxaluric Kidneys. PLoS ONE 2015, 10, e0134764.
[CrossRef] [PubMed]
24. Khan, S.R.; Joshi, S.; Wang, W.; Peck, A.B. Regulation of macromolecular modulators of urinary stone
formation by reactive oxygen species: Transcriptional study in an animal model of hyperoxaluria. Am. J.
Physiol. Renal. Physiol. 2014, 306, F1285–F1295. [CrossRef] [PubMed]
25. Rashidi, B.; Hoseini, Z.; Sahebkar, A.; Mirzaei, H. Anti-Atherosclerotic Effects of Vitamins D and E in
Suppression of Atherogenesis. J. Cell Physiol. 2017, 232, 2968–2976. [CrossRef]
26. Galle, J.; Heermeier, K.; Wanner, C. Atherogenic lipoproteins, oxidative stress, and cell death. Kidney Int. Suppl.
1999, 71, S62–S65. [CrossRef]
27. Nadra, I.; Boccaccini, A.R.; Philippidis, P.; Whelan, L.C.; McCarthy, G.M.; Haskard, D.O.; Landis, R.C. Effect
of particle size on hydroxyapatite crystal-induced tumor necrosis factor alpha secretion by macrophages.
Atherosclerosis 2008, 196, 98–105. [CrossRef]
28. Ewence, A.E.; Bootman, M.; Roderick, H.L.; Skepper, J.N.; McCarthy, G.; Epple, M.; Neumann, M.;
Shanahan, C.M.; Proudfoot, D. Calcium phosphate crystals induce cell death in human vascular smooth
muscle cells: A potential mechanism in atherosclerotic plaque destabilization. Circ. Res. 2008, 103, e28–e34.
[CrossRef]
29. Cybulsky, M.I.; Iiyama, K.; Li, H.; Zhu, S.; Chen, M.; Iiyama, M.; Davis, V.; Gutierrez-Ramos, J.C.; Connelly, P.W.;
Milstone, D.S. A major role for VCAM-1, but not ICAM-1, in early atherosclerosis. J. Clin. Investig. 2001,
107, 1255–1262. [CrossRef]
30. Nakano, C.; Hamano, T.; Fujii, N.; Matsui, I.; Tomida, K.; Mikami, S.; Inoue, K.; Obi, Y.; Okada, N.;
Tsubakihara, Y.; et al. Combined use of vitamin D status and FGF23 for risk stratification of renal outcome.
Clin. J. Am. Soc. Nephrol. 2012, 7, 810–819. [CrossRef]
31. Bellasi, A.; Raggi, P.; Rossi, R.; Rochira, V.; Stentarelli, C.; Zona, S.; Lattanzi, A.; Carli, F.; Mussini, C.;
Guaraldi, G. Intact parathyroid hormone levels are associated with increased carotid intima media thickness
in HIV infected patients. Atherosclerosis 2014, 237, 618–622. [CrossRef] [PubMed]
32. Taylor, E.N.; Hoofnagle, A.N.; Curhan, G.C. Calcium and phosphorus regulatory hormones and risk of
incident symptomatic kidney stones. Clin. J. Am. Soc. Nephrol. 2015, 10, 667–675. [CrossRef] [PubMed]
33. Kashani, K.; Cheungpasitporn, W.; Ronco, C. Biomarkers of acute kidney injury: The pathway from discovery
to clinical adoption. Clin. Chem. Lab. Med. 2017, 55, 1074–1089. [CrossRef] [PubMed]J. Clin. Med. 2020, 9, 729 14 of 14
34. Eilenberg, W.; Stojkovic, S.; Kaider, A.; Piechota-Polanczyk, A.; Nanobachvili, J.; Domenig, C.M.; Wojta, J.;
Huk, I.; Demyanets, S.; Neumayer, C. Neutrophil Gelatinase Associated Lipocalin (NGAL) for Identification
of Unstable Plaques in Patients with Asymptomatic Carotid Stenosis. Eur. J. Vasc. Endovasc. Surg. 2019,
57, 768–777. [CrossRef]
35. Zacchia, M.; Preisig, P. Low urinary citrate: An overview. J. Nephrol. 2010, 23, S49–S56. [PubMed]
36. Den Ruijter, H.M.; Peters, S.A.; Anderson, T.J.; Britton, A.R.; Dekker, J.M.; Eijkemans, M.J.; Engstrom, G.;
Evans, G.W.; de Graaf, J.; Grobbee, D.E.; et al. Common carotid intima-media thickness measurements in
cardiovascular risk prediction: A meta-analysis. JAMA 2012, 308, 796–803. [CrossRef]
37. Lorenz, M.W.; Polak, J.F.; Kavousi, M.; Mathiesen, E.B.; Volzke, H.; Tuomainen, T.P.; Sander, D.; Plichart, M.;
Catapano, A.L.; Robertson, C.M.; et al. Carotid intima-media thickness progression to predict cardiovascular
events in the general population (the PROG-IMT collaborative project): A meta-analysis of individual
participant data. Lancet 2012, 379, 2053–2062. [CrossRef]
© 2020 by the authors. Licensee MDPI, Basel, Switzerland. This article is an open access
article distributed under the terms and conditions of the Creative Commons Attribution
(CC BY) license (http://creativecommons.org/licenses/by/4.0/).You can also read