Abstract - Landlord's Self Help Centre
←
→
Page content transcription
If your browser does not render page correctly, please read the page content below
Abstract

This report was prepared to develop comprehensive information about the size of the secondary
rental housing market in Ontario. The report estimates the number and type of rental units
which comprise the secondary rental market on a provincial basis and on a regional basis as of
2016. It also projects the growth, or loss, of the market over the next five and ten year periods
and assesses the factors which will contribute to the growth or loss of units in the market.

The report uses a demographics-driven model to estimate and project the size of the secondary
rental market that combines age-specific population projections with assumptions about the
household formation, tenure, dwelling type, and condominium status decisions of people as they
age. Base case assumptions were based on headship, tenure, dwelling type and condominium
status rates calculated from the 2011 Census. The report offers multiple scenarios to illustrate
the impacts of alternative assumptions of how different extrapolations of past trends and key
factors could affect demand and supply of secondary rental housing.

The report estimates that the secondary rental market in Ontario currently has between 495,440
and 574,962 dwellings – 520,895 dwellings if age-specific headship rates and rental rates have
remained constant at 2011 values. Approximately 30% of these units are part of a condominium.
Under all of the projection scenarios, the size of the secondary rental market is projected to grow
in the next five and ten year periods on a provincial basis and on a regional basis, except the
north, where it will be relatively stable. Provincially, the report projects that the size of the
secondary rental market will grow by 10% between 2016 and 2026, or 51,214 units, under the
base case scenario.
Current and Projected Size and Scope of
Ontario’s Secondary Rental Housing
Market

Updated Report – Now Includes Information on Municipalities within the GTA
November 2016

Prepared For:    Landlord’s Self-Help Centre

Prepared by:
Table of Contents

Introduction                                                     1
Research Questions                                               1
Hypothesis                                                       1
Definition of the Secondary Rental Market                        2
Methodology                                                      2
Factors Contributing to Secondary Rental Market Growth or Loss   9
Size of the Secondary Rental Market                              13
Conclusions                                                      28
References and Bibliography                                      29
Introduction
This report was prepared to develop comprehensive information about the size of the secondary
rental housing market in Ontario. The report estimates the number of rental units which
comprise the secondary rental market on a provincial basis and on a regional basis as of 2016. It
also projects the growth, or loss, of the market over the next five and ten year periods and
assesses the factors which will contribute to the growth or loss of units in the market.

The report was commissioned by the Landlord’s Self-Help Centre. The Landlord’s Self-Help
Centre is a specialty community legal clinic that supports Ontario’s small landlords by providing
summary legal advice, guidance and direction with respect to their rights, responsibilities, and
obligations as housing providers. The report was intended to assess the size of the community
the Landlord’s Self-Help Centre serves.

Research Questions

The research questions addressed in this report are:
   1. How is the secondary rental housing market defined?
   2. What is the breadth of the secondary rental housing market and the type of rental units
      which comprise this market on a provincial basis and on a regional basis?
   3. What are the contributing factors to secondary rental market growth or loss in the next
      five and ten year periods and how are they anticipated to contribute to growth or loss?
   4. What is the projected secondary rental market growth, or loss, in the next five and ten
      year periods on a provincial basis and on a regional basis?

Hypothesis

It was hypothesized that the size of the secondary rental market will grow in the next five and ten
year periods on a provincial basis and on a regional basis in four of the five regions. The Northern
region will be the exception, with relative stability in the size of its secondary rental market.

                                                                                                    1
Definition of the Secondary Rental Market
In this report, the “secondary rental market” is defined as any rental property with only one or
two self-contained residential rental units. The secondary rental market consists of units within
dwellings or within structures accessory to dwellings, including:
- Rented single-detached houses
- Rented double (semi-detached) houses (i.e.. two units of approximate equal size and
under one roof that are situated either side-by-side or front-to-back)
- Rented row/town homes that are part of properties with one or two residential units
- Rented condominium apartments
- Rented duplex apartments (i.e. one-above-other).
- Rented accessory apartments (one or two separate dwelling units that are affiliated with
another dwelling type and may or may not be within or attached to other dwellings or
buildings)
- Two rented units in a triplex
- One or two rented residential units that are affiliated with or have been converted from a
commercial or other non-residential structure (which may or may not be attached to other
buildings).
This definition is largely based on Canada Mortgage and Housing Corporation’s (CMHC’s)
definition of the secondary rental market, which has also been used by the City of Toronto and
studies for the Ministry of Municipal Affairs and Housing.
Methodology
This report uses a demographics-driven model to estimate and project the size of the secondary
rental market that combines age-specific population projections with assumptions about the
household formation, tenure, dwelling type, and condominium status decisions of people as they
age. This is a widely used method of projecting household growth (CMHC, 2009 and CMHC,
2013). It is the method used by CMHC to project households, tenure, and dwellings by type.
CMHC’s Long-Term Household Projections report states that:
“Since a private household is defined as one or more persons residing in an occupied private
dwelling, it is expected that changes in the number of households would be related to changes
in the overall number of dwellings… Growth in the adult population over time tends to
simultaneously spur the formation of new households and the demand for additional housing
(CMHC, 2013).”
2As such, the demographics-driven model, known as the headship rate approach, is an appropriate
model for projecting the size of the secondary rental market. As the number of households rises,
there may be some reductions in the number of vacant dwellings, but over time housing supply
must rise accordingly to accommodate the additional demand. Over the longer term,
conversions to residential use and new housing construction generally aligns with household
growth (CMHC, 2013).
The model used in this report to estimate and project the secondary rental market is based on
CMHC’s Potential Housing Demand Model. Households are projected by applying projected
headship rates by household type and age of the primary maintainer to population projections.
Secondary rental dwellings are projected by then applying projected rental rates and dwelling-
type/condominium status rates by household type and age of the primary maintainer to the
household projections. The projection model is depicted below.
Source: Vink Consulting based on CMHC, 2013
Population Projections
The population projections used in this report were prepared by the Ontario Ministry of Finance.
The data was in five-year age increments. The projections were published in Spring 2016 and
were based on the 2011 Census and 2015 population estimates from Statistics Canada, with
minor changes to reflect the most recent trends in fertility, mortality and migration (Ontario,
2016).
3The Ontario Ministry of Finance provides three population projection scenarios for Ontario. The
reference, or medium, scenario is considered most likely to occur if recent trends continue
(Ontario, 2016). The low- and high-growth scenarios provide a reasonable range based on
plausible changes in the components of growth. At the regional level, the Ontario Ministry of
Finance only publishes the reference scenario. The assumptions for population growth in these
projections “reflect recent trends in all streams of migration and the continuing evolution of long-
term fertility and mortality patterns in each census division” (Ontario, 2016).
Household Projections
Projecting households involves multiplying age-specific population projections by age-specific
household headship rates. These headship rates represent the propensity of people in a given
age group to form households. The headship rate for a given age group is calculated as the
number of primary household maintainers1 in that group divided by the total number of people in
the same age segment.
At the provincial level, four headship rate scenarios for family and non-family households were
used in the report. Three of the scenarios were developed by CMHC. These are based on
historical trends and capture a range of outcomes. The low scenario is a continuation of the
historical downward trend and assumes headship rates to continuously decrease to some extent.
The high scenario assumes headship rates will increase and there will be some reversal of the
historical decreasing trend after 2015. The medium scenario is the average between the high and
low scenarios. The fourth scenario, holds the age-specific headship rates for family and non-
family households at their 2011 values. This is the only headship rate scenario provided at the
regional level. This scenario relies on custom-tabulated Census and National Household Survey
data from Statistics Canada for 2011.
Each of the four headship rate scenarios was paired with each of the three population projection
scenarios at the provincial level, resulting in 12 household projection scenarios for Ontario.
Rental Housing Projections
Two scenarios for age-specific rental rates were used at the provincial level. The first, which is
also the only rental rate scenario provided at the regional level, holds the age-specific rental rates
for family and non-family households at their 2011 values. In the second scenario, the pattern of
rising age-specific ownership rates observed from 1996 to 2011 is assumed to reverse over the
projection period. In this scenario it was assumed that there was a small increase in the rental
rate between 2011 and 2016 and a more significant increase will occur between 2016 and 2021
before flattening out somewhat by 2026. Data on age-specific rental rates for 2011 was from
custom-tabulated Census and National Household Survey data from Statistics Canada. Data for
2001 and 2006 was from CMHC, and was originally obtained from Statistics Canada.
1
The primary household maintainer is the person or one of the people responsible for the major household costs such
as rent or mortgage, property taxes, and electricity in a private household.
4These rental rate scenarios were informed by information on key factors influencing rental rates
and demand and supply of rental housing. These include changes in relative affordability of
ownership compared to incomes, changes in employment, the attractiveness of rental housing
investment, house prices, rent levels, rental vacancy rates, the supply of primary rental housing,
and the policy landscape. Key sources of information about these factors included:
- Statistics Canada’s Census and National Household Survey – primarily 2006 and 2011
- Ontario Ministry of Finance’s Population Projections – Spring 2016
- CMHC’s Long-Term Household Growth Projections – 2015 Update
- CMHC’s Housing Market Outlook Reports, 2016
- CMHC’s Rental Housing Market Surveys, 2006-2015.
- Statistics Canada’s Labour Force Survey, 2011-2014
- Bank of Canada, 5-year Conventional Mortgage Rate Data.
Each of the twelve household projection scenarios for Ontario was paired with each of the two
rental rate projection scenarios at the provincial level, resulting in 24 rental housing projection
scenarios for Ontario.
Dwelling Type and Condominium Status Projections
One dwelling type and condominium status projection scenario was used in the report. It
assumes age-specific occupancy patterns for family and non-family households will continue to
resemble those observed in 2011 for the projection period. Data on age-specific occupancy
patterns for 2011 was obtained from custom-tabulated Census and National Household Survey
data from Statistics Canada. This data classifies households by tenure, whether or not the
dwelling is part of a condominium, and categorizes dwelling types into eight structural types as
outlined on the following page.
Based on the report’s definition of secondary rental units as any rental property with only one or
two self-contained residential rental units, it was assumed that all rented units of the following
structural types are part of the secondary rental market:
- Single-detached house
- Semi-detached house
- Apartment or flat in a duplex (these a primarily basement apartments)
- Other single-attached house
- Movable dwelling.
For the following dwelling types, only a portion of units were included in the secondary rental
market calculations:
- Row house
- Apartment, building that has fewer than five storeys
- Apartment, building that has five or more storeys.
5All rented condominium apartment units and condominium row houses were included in the
calculation of the secondary rental market. Row houses include a mix of primary or purpose built
rental units and secondary rental units. The number of row houses in the secondary rental
market was calculated by subtracting the number of primary rental row houses and row houses
that are social housing units or developed through the Canada-Ontario Affordable Housing
Program. Data on the number of primary rental row houses was from CMHC’s Rental Market
Surveys of communities of over 10,000 2. Data on social housing units and units developed
through the Canada-Ontario Affordable Housing Program was obtained from the Ontario
Ministry of Municipal Affairs and Housing.
Statistics Canada’s Structural Type of Dwelling Classifications
Single-detached house – A single dwelling not attached to any other
dwelling or structure (except its own garage or shed.)
Semi-detached house – One of the two dwellings attached side by side
(or back to back) to each other, but not attached to any other dwelling or
structure (except its own garage or shed.)
Row house – One of three or more dwellings joined side by side (or
occasionally side to back), such as a town house or garden home, but not
having any other dwellings either above it or below.
Apartment or flat in a duplex – One of two dwellings, located one
above the other.
Apartment in a building that has five or more storeys – A dwelling
unit in a high-rise apartment building which has five or more storeys.
Apartment in a building that has fewer than five storeys – A
dwelling unit attached to other dwelling units, commercial units, or other
non-residential space in a building that has fewer than five storeys.
2
The calculations do not subtract out row house units in the primary rental market in communities of less than 10,000
because of the unavailability of data. However, this number is likely quite small.
6Other single-attached house – A single dwelling that is attached to
another building and that does not fall into any of the other categories,
such as a single dwelling attached to a non-residential structure (e.g. store
or church) or occasionally to another residential structure (e.g. apartment
building).
Movable dwelling – A single dwelling capable of being moved to a new
location on short notice.
Source: Statistics Canada
Summary of Scenarios
The base case scenario assumes medium population growth and constant headship rates, rental
rates and dwelling type/condominium status rates at 2011 values. The base case scenario has
been more accurately calculated as a roll up of values from each of the sub-regions. The
alternative scenarios have just been prepared at the provincial level, which results in slightly
different numbers as a result of changes in distributions of the population regionally since 2011.
All scenarios are summarized below:
Population Headship Rental Dwelling Type/ Condominium Status
Projections Rates Rates Rates
Medium Growth Constant Constant Constant
Increasing
Low Constant
Increasing
Medium Constant
Increasing
High Constant
Increasing
Low Growth Constant Constant
Increasing
Low Constant
Increasing
Medium Constant
Increasing
High Constant
Increasing
High Growth Constant Constant
Increasing
Low Constant
Increasing
Medium Constant
Increasing
High Constant
Increasing
Factors Contributing to Secondary Rental Market Growth or Loss
While age-specific headship rates, rental rates, and occupancy patterns were obtained from
Census and National Household Survey data, the projections use population estimates which
have been adjusted for the census undercount.
7The report provides projections for the size of the secondary rental market in the next five and
ten years. The projections are not forecasts. They provide a variety of scenarios which illustrate
the impacts of alternative assumptions of how different extrapolations of past trends and key
factors could affect demand and supply of secondary rental housing. Some of these factors, such
as migration, have been highly variable. The scenarios are thought to present a reasonable
range, but it is possible that actual outcomes may lie outside it in either direction.
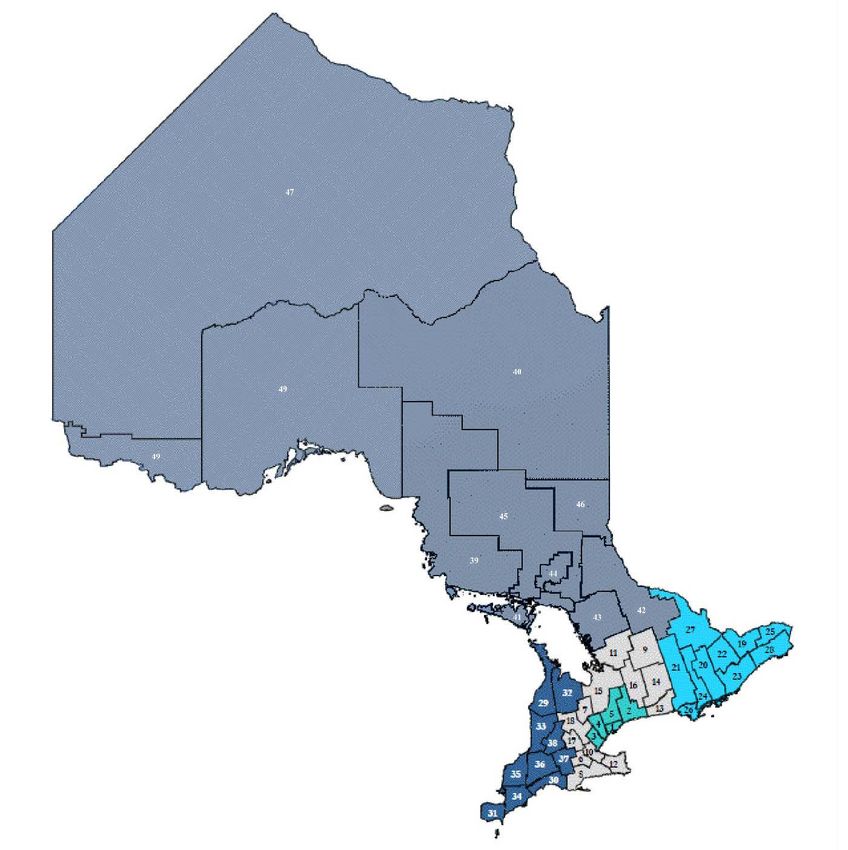
Geographic Regions Used in the Report
The report provides estimates and projections on a provincial and regional basis. Below is a list of
the municipalities included in each of the five regions.
Northern Ontario – 39. Algoma, 40.
Cochrane, 41. Manitoulin, 42. Nipissing, 43.
Parry Sound, 44. Greater Sudbury, 45.
Sudbury, 46. Timiskaming, 47. Kenora, 48.
Rainy River, 49. Thunder Bay
Eastern Ontario – 19.
Ottawa, 20. Frontenac, 21.
Hastings, 22. Lanark, 23.
Leeds and Grenville, 24.
Lennox and Addington, 25.
Prescott and Russell, 26.
Prince Edward, 27.
Renfrew, 28 .Stormont
Dundas and Glengarry
Central Ontario – 6. Brant, 7. Dufferin, 8.
Haldimand-Norfolk, 9. Haliburton, 10.
Hamilton, 11. Muskoka, 12. Niagara, 13.
Northumberland, 14. Peterborough, 15.
Simcoe, 16. Kawartha Lakes, 17. Waterloo, 18. Greater Toronto Area –
Wellington 1. Toronto, 2. Durham, 3.
Southwestern Ontario – 29. Bruce, 30. Elgin, Halton, 4. Peel, 5. York
31. Essex, 32. Grey, 33. Huron, 34. Chatham-
Kent, 35. Lambton, 36. Middlesex, 37. Oxford,
38. Perth
8Factors Contributing to Secondary Rental Market
Growth or Loss
Demographic Factors
A number of factors contribute to changes in demand for secondary rental housing.
Demographic factors, and household growth in particular, are the most important (CMHC,
2016b). The main contributors to household growth are population growth and age composition
of the population. Key components of population growth are fertility, mortality, and migration.
Highlights of the assessment of how these factors have influenced the size of the secondary
rental housing market since the 2011 Census and how they are anticipated to influence the
market over the next five and ten year periods are as follows:
- Ontario’s population is projected to grow by 1,654,492 between 2016 and 2026 under the
medium growth (base case) scenario (Ontario, 2016). This represents an increase of 6% in
each of the five year periods between 2016 and 2026. The Greater Toronto Area (GTA)
will be the fastest growing, and is projected to see its population increase by 8% between
2016 and 2021 and another 4% between 2021 and 2026. The Central and Eastern regions
are both projected to see 5% growth in each of the five year periods of the projection
horizon. Growth in Southwestern Ontario will be moderate at 2.3% to 2021 and 2.4% to
2026, while the population size will remain essentially unchanged in the Northern Region
over the projection horizon.
- Natural increase will be fairly stable over the projection period (Ontario, 2016).
- Net migration is projected to increase in Ontario through interprovincial migration and
increased federal immigration targets (Ontario, 2016). Net migration will contribute to a
significant portion of Ontario’s population growth, although this factor is highly variable
due to swings in interprovincial migration and international migration.
- The province, and each of the five regions, will see a shift towards an older age structure
over the projection period (Ontario, 2016). The share of seniors will increase from 16% to
21% provincially under the medium scenario (base case). The Central, Southwestern, and
Northern regions will see the largest shift – a 6% increase in seniors’ share of the
population. Both the number and share of people 15 to 29, the prime years for household
formation, are projected to decrease provincially and in each of the five regions under the
medium growth scenario.
- Headship rates represent the propensity of people in a given age group to form
households 3. Headship rates have trended downwards over the past ten years for people
3
It is calculated as the number of primary household maintainers in that group divided by the total number of people
in that age group
9between the ages of 20 and 44 and over the age of 65 (CMHC, 2016b). CMHC’s
projections for headship rates range from a continued decrease in headship rates to some
reversal of past trends (CMHC, 2016b).
- The number of households in Ontario is projected to increase by 767,721 between 2016
and 2026 under the medium population growth constant headship scenario (base case)
(Vink Consulting calculations). This represents a 15% increase over the projection period.
- The number of non-family households grew at a higher pace than family households
between 2001 and 2011. “These changes reflect demographic, social, cultural and
economic developments, such as changing attitudes towards marriage and divorce and
rising labour force attachment among women, which likely contributed to gains in young
and middle-aged non-family households” (CMHC, 2009). Non-family households are
projected to continue to grow more rapidly than family households over the projection
horizon at 19% and 14% respectively in the medium population growth constant headship
scenario (base case) (Vink Consulting calculations).
- The propensity towards homeownership increases with age, with the exception of family
households where the primary maintainer is 75 or older. While the increasing population
projects an increase of 194,669 in the number of renter households between 2016 and
2026 under the base case scenario, the changing age composition of the population
projects a decrease in the overall percentage of households that are renters under the
constant age-specific rental rate scenario (base case) (Vink Consulting calculations).
- There has been a pattern of rising age-specific ownership rates from 1996 to 2011. Key
factors behind the large increases in ownership rates were strong income and
employment growth and low interest rates, which made homeownership more attainable
for a wider range of households (CMHC, 2009). However, CMHC does not expect gains in
age-specific ownership rates to continue, and in fact uses only a constant age-specific
rental rate scenario in its latest (2015) projections (CMHC, 2009 and CMHC, 2016b).
- The projected changes to the population’s age composition are not projected to have
much of an effect on the relative percentage shares of each type of rental dwelling or
condominium status of the dwellings, provincially or in any of the five regions (Vink
Consulting calculations).
The population projections used in the report incorporate a range of plausible scenarios for all
components of population growth (Ontario, 2016). In addition to projecting overall population
growth, they project changes in age composition of the population. The headship rate scenarios
factor in a range of reasonable scenarios for headship rates by age. Age- and household type-
specific household projections paired with projections of rental rates and dwelling-
type/condominium status rates by age account for changes in the demand for secondary rental
housing as a result of household formation and dissolution and age-specific propensities to rent
and to occupy various dwelling types.
10Economic Factors
The other key factors influencing the demand and supply of secondary rental housing are
economic. The change in demand for rental housing in general is primarily influenced by income
and employment growth or loss and changes in the relative affordability of ownership housing.
Components of change in ownership affordability include changes in household incomes, house
prices, and mortgage rates.
Changes in demand for rental housing are met by some combination of change in the supply of
primary purpose-built rental housing and change in the supply of secondary rental housing,
depending on the attractiveness of investment in each of the two markets. It becomes
increasingly un-economic to develop new primary rental housing in circumstances with high or
increasing vacancy rates in primary rental housing, insufficient returns on investment as a result
of low rent levels, limited escalation in rents, housing prices and correspondingly low
expectations of capital gains, higher mortgage rates, and unfavourable or uncertain policy
landscapes, including unfavourable tax treatment of rental housing and stringent rent
regulations, lack of or limited private sector subsidized supply programs, unfavourable mortgage
insurance policies, and stringent regulatory controls of secondary suites (Focus Consulting, 2011;
FRPO, 2005; Steele, 1991; Suttor, 2015). Additions to the rental stock tend to be
disproportionately concentrated in the secondary rental market in such circumstances (Steele,
1991).
Highlights of the assessment of how these factors have influenced the size of the secondary
rental housing market since the 2011 Census and how they are anticipated to influence the
market over the next five and ten year periods are discussed below. However, it should be noted
that economic factors are highly volatile, and therefore there is limited availability of long-term
projections.
- Real income has continued its increasing trend across the province since 2011, although
income growth since 2011 has not been as strong as 2006 to 2011 growth in several parts
of the province (CMHC, 2016a). This includes the Census Metropolitan Areas (CMAs) of
Kitchener-Waterloo, Kingston, Ottawa, Barrie, and Peterborough. Strong income growth
in Ontario is expected to continue over CMHC’s projection horizon to 2017 (CMHC, 2016a).
Income growth has supported growth in house prices and is anticipated to continue to
support price growth until price escalation dampens demand in 2017 (CMHC, 2016a).
- Unemployment rates have decreased across the province since 2011 and employment
growth has occurred in the majority of economic regions across Ontario, with the
exception of the Kingston-Pembroke, Muskoka-Kawarthas, and Stratford-Bruce Peninsula
Economic Regions (Statistics Canada, 2015). Employment growth is expected to continue
in Ontario over CMHC’s projection horizon to 2017 (CMHC, 2016a). “Weaker economic
conditions in Northern and Eastern Ontario will restrain housing activity [in these regions]
relative to the rest of the province” (CMHC, 2016a).
- Ontario house prices have continued on a strong upward trend since 2011. However,
some areas have had low or negative price growth, including the Kingston, Ottawa and
11Sudbury CMAs. Prices are projected to continue to grow to the end of CMHC’s forecast
period of 2017, although at a slower rate (CMHC, 2016a). For individuals, price escalation
can dampen homeownership demand when households begin to be priced out of the
homeownership market. This is currently occurring in some parts of the province, in
particular in the Greater Toronto Area. For secondary rental housing investors, in periods
of anticipated strong escalation of house prices, capital gains are expected to be high and
play an increasing role in the return on rental real estate, and therefore additions to the
rental stock tend to be disproportionately concentrated in the secondary rental market
(Steele, 1991). However, later in periods of strong price escalation when prices are
anticipated to flatten or reverse, landlords are encouraged to sell units for homeownership
(Steele, 1991). Landlords currently have some incentives to sell their units for
homeownership.
- Mortgage rates have been on a decreasing trend since 2008 and are at historical lows
(Bank of Canada, 2016). They are not expected to rise until 2017, and are then expected to
rise gradually (CMHC, 2016a). With everything else equal, this will continue to support
homeownership demand as well as the attractiveness of rental housing investment.
- The household incomes required to support the mortgage carrying costs 4 on the average
resale home have increased relative to increases in actual household incomes since 2011,
an indication of decreasing affordability of ownership housing in Ontario (CMHC, 2016a).
Substantial erosion of affordability has occurred in the GTA, while Kingston, Ottawa and
Sudbury CMAs have had limited increases in required incomes compared to actual
incomes. The decline in affordability is anticipated to erode some of the future demand
for ownership housing.
- Growth in rents has been modest for the past 15 years (CMHC, 2016c). With annual
growth of 3% or less in average rent since 2011, rent changes have had limited impact on
returns on rental investment.
- Compared to the previous five years, new housing construction in Ontario intended for
the primary rental housing market increased between 2011 and 2015. Primary rental
housing construction is anticipated to “continue to remain near record highs thanks to low
vacancy rates and increasing cost of ownership housing” (CMHC, 2016a).
- Vacancy rate trends have varied across the province, but have decreased since 2011 in the
majority (58%) of areas surveyed by CMHC (CMHC Rental Housing Market Survey, 2011-
2016). Ontario’s vacancy rates are anticipated to continue to decrease slightly as a result
of rental demand supported by the “rising cost gap between owning and renting, an
improving job market and rising international migration” (CMHC, 2016a).
- A number of policies have changed at the federal level since 2012 which have changed the
economics of rental housing investment. A number of these changes have been largely in
an effort to cool the housing market in hot markets such as Toronto. These have included
4
Required income is mortgage carrying costs divided by 0.32 to reflect the 32 per cent gross debt service ratio.
Mortgage carrying costs are calculated on the average MLS® price, a 10 per cent down payment, the fixed five-year
mortgage rate and the longest available amortization.
12“changing mortgage insurance rules by increasing down payments and shortening the
period buyers have to repay their loans, withdrawn mortgage insurance for investment
properties and homes valued over $1 million, and changing the rules for immigrant
investors such that they cannot simply invest in Canadian real estate or fixed income and
call it job creation” (Canadian Business, 2015). Another recent change by the Federal
government has been its commitment of increased investment in affordable housing,
including the construction of new affordable rental housing, which will absorb a small
portion of the net new demand for rental housing over the next ten years.
- At the local level, the number of municipalities that permit second units in single
detached, semi-detached and row dwellings and accessory dwellings will continue to
increase, as a result of provincial regulation enacted in 2012 requiring municipalities to
establish policies allowing second units in new and existing developments. This will
support the creation of some additional secondary rental market units.
- Additional changes to housing policy are anticipated beginning in the Federal
government’s spring 2017 budget. This may include tax breaks to encourage the
construction of rental housing, such as the removal of the GST on new capital investments
(Canadian Business, 2015). This may stimulate some new rental development and absorb
a small portion of the net new demand for rental housing. It is also anticipated, based on
campaign promises, that the Federal government will loosen policies to help first-time
homebuyers and others access homeownership. One promise is to expand the existing
qualification rules to withdrawal from RRSPs as part of the Home Buyers’ Plan. Such
changes would support access to homeownership for a wider range of households. Also
under consideration by the federal and provincial governments, are additional restrictions
or taxes of foreign home-buyers in an effort to cool Toronto’s hot housing market.
In the model, economic change factors influencing the demand and supply of rental housing are
incorporated through the two rental rate projections scenarios. The base case assumes that age-
specific rental rates will remain constant at 2011 values over the projection horizon, while the
alternative scenario assumes increases to rental rates. The main factor driving the alternate
scenario of higher rental rates is the erosion of homeownership affordability as a result of strong
price escalation. The projections hold the composition of the rental market, in terms of dwelling-
types and condominium status, constant over the projection horizon as there is not a strong
indication of economic factors impacting occupancy.
Size of the Secondary Rental Market
Current size of the secondary rental housing market and type of units
It is estimated that the current (2016) size of the total secondary rental market in Ontario is
520,895 dwelling units, under the base case scenario of medium population growth and constant
age-specific headship and rental rates at 2011 values. Under the lowest scenario, with low
13population growth since 2015, low headship rates, and constant age-specific rental rates since
2011, it is estimated that there are 495,440 dwellings in the secondary rental market. The current
number could be as high as 574,962 dwellings if the province has experienced high population
growth since 2015, high headship rates, and an increase in rental rates since 2011.
Approximately 30% of the units in Ontario’s secondary rental market (or 148,448 dwellings under
the base case scenario) are part of a condominium, while the other 70% (or 372,447) are freehold
secondary rental dwellings.
Figure 1: Estimated Current Size of Ontario’s Secondary Rental Housing Market (2016)
574,962
520,895
495,440
403,209
372,447
348,098
171,753
148,448
Total Freehold 147,342
Part of a Condominium
Base Case Low High
The Greater Toronto Area has the highest number of secondary rental housing units at 212,121,
accounting for 41% of the province’s market. The Central region has the next largest market, at
121,508 dwellings, representing almost a quarter of the province’s market. The East (74,635
dwellings) and Southwest (72,135 dwellings) regions each account for 14% of the province’s
secondary rental market, while the North accounts for 8% (40,497 dwellings).
14Figure 2: Estimated Size of Ontario’s Secondary Rental Housing Market by Region (2016)
250,000
212,121
200,000
150,000
121,508
100,000
74,635 72,135
50,000 40,497
0
Greater Toronto Central East Southwest North
Area
Over half (57%) of the units in the Greater Toronto Area’s secondary rental market are in the City
of Toronto. The Region of Peel distantly follows the City of Toronto at 37,309 units. The Regions
of York and Durham has the third and forth highest number of secondary rental units in the
Greater Toronto Area at 26,321 and 15,733 units, respectively. Halton Region has the fewest
number of secondary rental dwellings in the Greater Toronto Area.
Figure 3: Estimated Size of the Secondary Rental Housing Market in the Greater Toronto Area Municipalities (2016)
140,000
121,287
120,000
100,000
80,000
60,000
37,309
40,000
26,321
20,000 15,733
11,471
0
Durham York Toronto Peel Halton
15It is estimated that the secondary rental market makes up one third of the rental market in
Ontario. The secondary rental market’s share of the total rental market ranges from a low of 28%
in the Greater Toronto Area to a high of 41% in the North region. The Southwest and Central
regions also have higher proportions of secondary rental units at 38% and 37% respectively,
whereas the East region is consistent with the provincial average.
Figure 4: Secondary Rental Market as a Percentage of the Total Rental Market in Ontario and by Region, 2016 Estimate
45% 41%
38% 38%
40%
35% 33% 33%
30% 28%
25%
20%
15%
10%
5%
0%
Ontario Greater Central East Southwest North
Toronto Area
Within the Greater Toronto Area, secondary rental housing is particularly predominant within the
rental market in the Region of York, where it accounts for 61% of the rental market. The
secondary rental market accounts for no more than 37% of the rental market in any of the other
Greater Toronto Area regional municipalities.
Figure 5: Secondary Rental Market as a Percentage of the Total Rental Market in the Greater Toronto Area
Municipalities, 2016 Estimate
70%
61%
60%
50%
40% 37% 37%
33%
28%
30%
23%
20%
10%
0%
Greater Durham York Toronto Peel Halton
Toronto Area
16While people may think of basement apartments or condominium apartment units when they
think of the secondary rental market, single-detached houses actually make up the largest share
(37%) of the secondary rental market. Condominium units in apartment buildings account for
almost one quarter (22%) of the market. Rental units that are located in a duplex (one of two
dwellings, located one above the other, primarily basement apartments) contribute to another
15% of the market, while row houses and semi-detached houses account for 15% and 10%
respectively. The remaining 1% are other single attached houses or movable dwellings.
Figure 6: Current Composition of Ontario’s Secondary Rental Housing Market by Dwelling Type and Condominium Status
194,812
250,000
200,000
150,000
88,664
76,260
76,865
53,803
100,000
25,576
3,845
50,000
1,070
-
Row house
Apartment or flat in a duplex
Movable dwelling
Apartment, building that has
Other single-attached house
Apartment, building that has five
Single-detached house
Semi-detached house
fewer than five storeys
or more storeys
Condominium Freehold
Dwellings that are part of a condominium range from a high of almost half (45%) of the
secondary rental market in the Greater Toronto Area to a low of 6% in the North region. One
quarter of the secondary rental dwellings in the East region are part of a condominium. The share
of condominium units in the Southwest and Central regions are 18% and 15% respectively. Refer
to Table 1 for further details on the number of dwellings by type and condominium status
provincially and in each of the five regions.
17Table 1: Estimated Size of the Secondary Rental Housing Market in Ontario and Each of the Regions in 2016 by Unit Type
and Condominium Status, Base Case Scenario
Greater
Ontario Toronto Central East Southwest North
Area
Single-detached house 193,677 49,859 58,465 25,761 38,432 21,161
Apartment, building that has
five or more storeys 0 0 0 0 0 0
Movable dwelling 1,070 0 279 148 200 444
Semi-detached house 52,921 14,267 12,529 12,304 7,522 6,299
Row house 44,476 19,354 10,839 8,444 3,320 2,520
Apartment or flat in a duplex 76,458 31,917 19,400 9,031 8,705 7,406
Apartment, building that has
fewer than five storeys 0 0 0 0 0 0
Freehold
Other single-attached house 3,845 920 1,166 838 663 257
Total 372,447 116,316 102,678 56,525 58,842 38,087
Single-detached house 1,135 364 541 186 45 0
Apartment, building that has
five or more storeys 88,664 75,738 4,417 4,742 3,380 385
Movable dwelling 0 0 0 0 0 0
Part of a Condominium
Semi-detached house 882 152 226 194 257 53
Row house 31,784 9,831 8,402 6,792 6,076 683
Apartment or flat in a duplex 407 177 94 137 0 0
Apartment, building that has
fewer than five storeys 25,576 9,542 5,150 6,060 3,535 1,289
Other single-attached house 0 0 0 0 0 0
Total 148,448 50,223 18,830 18,110 13,293 2,411
Single-detached house 194,812 50,223 59,005 25,946 38,477 21,161
Apartment, building that has
five or more storeys 88,664 75,738 4,417 4,742 3,380 385
Movable dwelling 1,070 0 279 148 200 444
Semi-detached house 53,803 14,419 12,755 12,497 7,780 6,351
Row house 76,260 29,185 19,241 15,235 9,396 3,203
Apartment or flat in a duplex 76,865 32,093 19,494 9,167 8,705 7,406
Apartment, building that has
fewer than five storeys 25,576 9,542 5,150 6,060 3,535 1,289
Other single-attached house 3,845 920 1,166 838 663 257
Total
Total 520,895 212,121 121,508 74,635 72,135 40,497
Condominium units account for over half (55%) of the units in the secondary rental market in the
City of Toronto. This compares to 42% and 37% in the Regions of Peel and Halton, respectively.
In the Region of York, condominium units account for one quarter of the secondary rental
market. Condominium units were the least common among the Greater Toronto Area
municipalities in Durham Region (16%).
18Table 2: Estimated Size of the Secondary Rental Housing Market Each of the Regional Municipalities in the Greater
Toronto Area in 2016 by Unit Type and Condominium Status, Base Case Scenario
Durham York Toronto Peel Halton
Single-detached house 7,377 9,880 19,368 9,340 3,895
Apartment, building that has
five or more storeys 0 0 0 0 0
Movable dwelling 0 0 0 0 0
Semi-detached house 1,048 1,631 7,539 3,280 770
Row house 1,519 3,269 9,406 3,397 1,763
Apartment or flat in a duplex 3,282 4,725 17,493 5,571 845
Apartment, building that has
fewer than five storeys 0 0 0 0 0
Freehold
Other single-attached house 0 44 875 0 0
Total 13,226 19,549 54,680 21,587 7,273
Single-detached house 0 25 212 112 16
Apartment, building that has
five or more storeys 699 5,114 57,830 10,813 1,282
Movable dwelling 0 0 0 0 0
Part of a Condominium
Semi-detached house 0 0 118 34 0
Row house 1,086 980 2,582 3,456 1,726
Apartment or flat in a duplex 0 0 77 100 0
Apartment, building that has
fewer than five storeys 721 652 5,789 1,206 1,173
Other single-attached house 0 0 0 0 0
Total 2,592 2,769 149,878 157,085 161,769
Single-detached house 7,377 9,904 19,579 9,452 3,910
Apartment, building that has
five or more storeys 699 5,114 57,830 10,813 1,282
Movable dwelling 0 0 0 0 0
Semi-detached house 1,048 1,631 7,656 3,314 770
Row house 2,605 4,250 11,987 6,853 3,490
Apartment or flat in a duplex 3,282 4,725 17,570 5,671 845
Apartment, building that has
fewer than five storeys 721 652 5,789 1,206 1,173
Other single-attached house 0 44 875 0 0
Total
Total 15,733 26,321 121,287 37,309 11,471
Projected size of the secondary rental housing market and type of units in 2021 and 2026
Under the base case scenario, Ontario’s secondary rental housing market is projected to grow
from 520,895 units in 2016 to 549,347 units in 2021 and 572,109 units in 2026 – a 5% increase
between 2016 and 2021 and a further 4% increase between 2021 and 2026. Stronger growth is
projected in rental condominiums at 7% and 6% for 2016-2021 and 2021-2026 respectively. The
remainder of the market is projected to grow by 5% and 4% in these two periods respectively.
Refer to Figure 7 for information on the number of units by condominium status.
19Figure 7: Estimated and Projected Size of Ontario’s Secondary Rental Housing Market in 2016, 2021 and 2026, by
Condominium Status, Base Case Scenario
572,109
549,347
520,895
403,604
389,882
372,447
168,505
159,464
148,448
Total Freehold Part of a
Condominium
2016 2021 2026
The alternative scenarios show that as many as 649,205 dwellings or as few as 509,080 are
plausible by 2021 and as many as 734,627 dwellings or as few as of 516,670 dwellings are plausible
by 2026. Refer to Table 3 for a breakdown by condominium status.
Figure 6: Estimated and Projected Size of Ontario’s Secondary Rental Housing Market in 2016, 2021 and 2026, Base Case
and Alternative Scenarios
725,000
675,000
625,000
575,000 Base Case
525,000
475,000
2016 2021 2026
20Table 3: Projected Size of Ontario’s Secondary Rental Housing Market in 2021 and 2026 by Condominium Status,
Base Case and Lowest and Highest Scenarios
2021 2026
Base Case Low High Base Case Low High
Freehold 372,447 356,501 456,856 572,109 361,145 516,428
Part of a Condominium 159,464 152,579 192,349 168,505 155,526 218,199
Total 549,347 509,080 649,205 572,109 516,670 734,627
The Eastern and Central regions’ growth is projected to be relatively consistent with that of the
province. Stronger growth is projected in the Greater Toronto Area. Weaker growth is projected
in Southwestern Ontario. The size of the secondary market is projected to be stable in the North
over the projection horizon. Refer to Table 4 for information on the number of units by
condominium status. A breakdown by dwelling type can be found in Table 5 and Table 7.
Figure 7: Estimated and Projected Size of Ontario’s Secondary Rental Housing Market in 2016, 2021 and 2026, by
Region, Base Case Scenario
243,535
300,000
229,158
212,121
250,000
200,000
132,136
127,419
121,508
150,000
81,665
78,648
74,783
74,635
73,736
72,135
100,000
40,497
40,387
39,991
50,000
0
Greater Toronto Central East Southwest North
Area
2016 2021 2026
Strong growth in the secondary rental market is projected in each of the regional municipalities in
the Greater Toronto Area. Growth is projected at 10% or more between 2016 and 2021 in the
Regions of York, Peel and Halton. This compares to 8% and 7% in the Region of Durham and the
City of Toronto, respectively. Refer to Table 4 for information on the number of units by
condominium status. A breakdown by dwelling type can be found in Table 6 and Table 8.
21Figure 8: Estimated and Projected Size of the Secondary Rental Housing Market in 2016, 2021 and 2026 in the
Greater Toronto Area Municipalities, Base Case Scenario
135,176
129,337
160,000
121,287
140,000
120,000
100,000
80,000
44,343
41,004
37,309
60,000
31,619
29,020
26,321
18,318
17,063
15,733
14,079
40,000
11,471
11,471
20,000
0
Durham York Toronto Peel Halton
2016 2021 2026
Table 4: Projected Size of the Secondary Rental Housing Market in Ontario and Each of the Regions and the Greater
Toronto Area Regional Municipalities by Condominium Status in 2016, 2021, and 2026, Base Case Scenario
2016 2021 2026 % Change % Change
2016-2021 2021-2026
Freehold 372,447 389,882 403,604 5% 4%
Part of a
Ontario 7% 6%
Condominium 148,448 159,464 168,505
Total 520,895 549,347 572,109 5% 4%
Freehold 116,316 125,598 133,767 8% 7%
Greater Part of a
8% 6%
Toronto Area Condominium 95,805 103,559 109,768
Total 212,121 229,158 243,535 8% 6%
Freehold 102,678 107,254 110,721 4% 3%
Part of a
Central 7% 6%
Condominium 18,830 20,165 21,415
Total 121,508 127,419 132,136 5% 4%
Freehold 56,525 59,359 61,457 5% 4%
Part of a
East 7% 5%
Condominium 18,110 19,289 20,208
Total 74,635 78,648 81,665 5% 4%
Freehold 58,842 59,876 60,437 2% 1%
Part of a
Southwest 4% 4%
Condominium 13,293 13,860 14,346
Total 72,135 73,736 74,783 2% 1%
Freehold 38,087 37,795 37,222 -1% -2%
Part of a
North 8% 7%
Condominium 2,411 2,592 2,769
Total 40,497 40,387 39,991 0% -1%
22Table 4: Projected Size of the Secondary Rental Housing Market in Ontario and Each of the Regions and the Greater
Toronto Area Regional Municipalities by Condominium Status in 2016, 2021, and 2026, Base Case Scenario
(Continued)
2016 2021 2026 % Change % Change
2016-2021 2021-2026
Freehold 13,226 14,284 15,214 8% 7%
Part of a
Durham 2,507 2,778 3,104 11% 12%
Condominium
Total 15,733 17,063 18,318 8% 7%
Freehold 19,549 21,330 23,057 9% 8%
Part of a
York 6,772 7,690 8,562 14% 11%
Condominium
Total 26,321 29,020 31,619 10% 9%
Freehold 54,680 58,489 61,503 7% 5%
Part of a
Toronto 66,607 70,848 73,672 6% 4%
Condominium
Total 121,287 129,337 135,176 7% 5%
Freehold 21,587 23,513 25,245 9% 7%
Part of a
Peel 15,722 17,491 19,098 11% 9%
Condominium
Total 37,309 41,004 44,343 10% 8%
Freehold 7,273 7,981 8,747 10% 10%
Part of a
Halton 4,197 4,752 5,332 13% 12%
Condominium
Total 11,471 12,734 14,079 11% 11%
23Table 5: Projected Size of the Secondary Rental Housing Market in Each of the Regions in 2021 by Unit Type and
Condominium Status, Base Case Scenario
Greater
Toronto Central East Southwest North
Area
Single-detached house 54,107 61,189 27,197 39,207 21,054
Apartment, building that has
five or more storeys 0 0 0 0 0
Movable dwelling 0 292 150 202 437
Semi-detached house 15,289 13,091 12,915 7,632 6,215
Row house 20,850 11,246 8,802 3,393 2,513
Apartment or flat in a duplex 34,350 20,233 9,421 8,765 7,312
Apartment, building that has
fewer than five storeys 0 0 0 0 0
Freehold
Other single-attached house 1,003 1,204 873 677 264
Total 125,598 107,254 59,359 59,876 37,795
Single-detached house 382 590 195 50 0
Apartment, building that has
five or more storeys 81,765 4,848 5,183 3,619 440
Movable dwelling 0 0 0 0 0
Part of a Condominium
Semi-detached house 157 241 198 253 54
Row house 10,661 8,841 7,099 6,243 727
Apartment or flat in a duplex 184 95 135 0 0
Apartment, building that has
fewer than five storeys 10,412 5,549 6,479 3,695 1,370
Other single-attached house 0 0 0 0 0
Total 155,526 152,414 161,591 168,012 151,212
Single-detached house 54,488 61,779 27,392 39,257 21,054
Apartment, building that has
five or more storeys 81,765 4,848 5,183 3,619 440
Movable dwelling 0 292 150 202 437
Semi-detached house 15,446 13,331 13,113 7,884 6,270
Row house 31,511 20,087 15,901 9,636 3,240
Apartment or flat in a duplex 34,533 20,328 9,556 8,765 7,312
Apartment, building that has
fewer than five storeys 10,412 5,549 6,479 3,695 1,370
Other single-attached house 1,003 1,204 873 677 264
Total
Total 229,158 127,419 78,648 73,736 40,387
24Table 6: Estimated Size of the Secondary Rental Housing Market in Ontario and Each of the Regional Municipalities in
the Greater Toronto Area in 2021 by Unit Type and Condominium Status, Base Case Scenario
Durham York Toronto Peel Halton
Single-detached house 7,981 10,814 20,790 10,251 3,895
Apartment, building that has
five or more storeys 0 0 0 0 0
Movable dwelling 0 0 0 0 0
Semi-detached house 1,119 1,752 8,034 3,537 770
Row house 1,628 3,560 10,074 3,664 1,763
Apartment or flat in a duplex 3,557 5,162 18,631 6,061 845
Apartment, building that has
fewer than five storeys 0 0 0 0 0
Freehold
Other single-attached house 0 43 960 0 0
Total 14,284 21,330 58,489 23,513 7,273
Single-detached house 0 24 221 121 16
Apartment, building that has
five or more storeys 794 5,857 61,503 12,111 1,282
Movable dwelling 0 0 0 0 0
Part of a Condominium
Semi-detached house 0 0 122 35 0
Row house 1,174 1,060 2,769 3,771 1,726
Apartment or flat in a duplex 0 0 78 106 0
Apartment, building that has
fewer than five storeys 810 749 6,154 1,348 1,173
Other single-attached house 0 0 0 0 0
Total 159,323 165,013 150,788 162,922 173,110
Single-detached house 7,981 10,837 21,012 10,371 3,910
Apartment, building that has
five or more storeys 794 5,857 61,503 12,111 1,282
Movable dwelling 0 0 0 0 0
Semi-detached house 1,119 1,752 8,156 3,572 770
Row house 2,802 4,620 12,842 7,436 3,490
Apartment or flat in a duplex 3,557 5,162 18,709 6,166 845
Apartment, building that has
fewer than five storeys 810 749 6,154 1,348 1,173
Other single-attached house 0 43 960 0 0
Total
Total 17,063 29,020 129,337 41,004 11,471
25Table 7: Projected Size of the Secondary Rental Housing Market in Each of the Regions in 2026 by Unit Type and
Condominium Status, Base Case Scenario
Greater
Toronto Central East Southwest North
Area
Single-detached house 57,897 63,283 28,379 39,659 20,797
Apartment, building that has
five or more storeys 0 0 0 0 0
Movable dwelling 0 310 155 206 432
Semi-detached house 16,195 13,509 13,314 7,696 6,087
Row house 22,263 11,588 9,080 3,430 2,477
Apartment or flat in a duplex 36,316 20,792 9,656 8,738 7,160
Apartment, building that has
fewer than five storeys 0 0 0 0 0
Freehold
Other single-attached house 1,095 1,240 873 709 268
Total 133,767 110,721 61,457 60,437 37,222
Single-detached house 398 624 199 58 0
Apartment, building that has
five or more storeys 86,484 5,278 5,551 3,850 505
Movable dwelling 0 0 0 0 0
Part of a Condominium
Semi-detached house 160 255 204 247 56
Row house 11,397 9,200 7,304 6,333 763
Apartment or flat in a duplex 185 99 137 0 0
Apartment, building that has
fewer than five storeys 11,144 5,958 6,813 3,858 1,444
Other single-attached house 0 0 0 0 0
Total 109,768 21,415 20,208 14,346 2,769
Single-detached house 58,295 63,907 28,578 39,717 20,797
Apartment, building that has
five or more storeys 86,484 5,278 5,551 3,850 505
Movable dwelling 0 310 155 206 432
Semi-detached house 16,355 13,764 13,518 7,943 6,143
Row house 33,660 20,788 16,384 9,762 3,241
Apartment or flat in a duplex 36,501 20,891 9,792 8,738 7,160
Apartment, building that has
fewer than five storeys 11,144 5,958 6,813 3,858 1,444
Other single-attached house 1,095 1,240 873 709 268
Total
Total 243,535 132,136 81,665 74,783 39,991
26Table 8: Estimated Size of the Secondary Rental Housing Market in Ontario and Each of the Regional Municipalities in
the Greater Toronto Area in 2026 by Unit Type and Condominium Status, Base Case Scenario
Durham York Toronto Peel Halton
Single-detached house 8,506 11,700 21,953 11,070 4,669
Apartment, building that has
five or more storeys 0 0 0 0 0
Movable dwelling 0 0 0 0 0
Semi-detached house 1,175 1,883 8,422 3,771 943
Row house 1,744 3,871 10,626 3,921 2,101
Apartment or flat in a duplex 3,790 5,559 19,450 6,483 1,034
Apartment, building that has
fewer than five storeys 0 0 0 0 0
Freehold
Other single-attached house 0 44 1,052 0 0
Total 15,214 23,057 61,503 25,245 8,747
Single-detached house 0 24 230 127 17
Apartment, building that has
five or more storeys 934 6,570 63,926 13,328 1,725
Movable dwelling 0 0 0 0 0
Part of a Condominium
Semi-detached house 0 0 124 37 0
Row house 1,275 1,127 2,906 4,026 2,063
Apartment or flat in a duplex 0 0 76 110 0
Apartment, building that has
fewer than five storeys 894 841 6,411 1,471 1,527
Other single-attached house 0 0 0 0 0
Total 3,104 8,562 73,672 19,098 5,332
Single-detached house 8,506 11,724 22,182 11,197 4,687
Apartment, building that has
five or more storeys 934 6,570 63,926 13,328 1,725
Movable dwelling 0 0 0 0 0
Semi-detached house 1,175 1,883 8,546 3,808 943
Row house 3,020 4,998 13,533 7,946 4,163
Apartment or flat in a duplex 3,790 5,559 19,526 6,593 1,034
Apartment, building that has
fewer than five storeys 894 841 6,411 1,471 1,527
Other single-attached house 0 44 1,052 0 0
Total
Total 18,318 31,619 135,176 44,343 14,079
27Conclusions
This report estimates that the secondary rental market in Ontario currently has between 495,440
and 574,962 dwellings as of 2016 – 520,895 dwellings if age-specific headship rates and rental
rates have remained constant at 2011 values. Approximately 30% of these units are part of a
condominium. Under all of the projection scenarios in this report the size of the secondary rental
market is projected to grow in the next five and ten year periods on a provincial basis and on a
regional basis, except the north, where it will be relatively stable. Provincially, the base case
scenario projects 572,109 dwelling units by 2026, but the number could reasonably be between
516,670 and 734,627 dwellings.
28References and Bibliography
(Bank of Canada, 2016) Bank of Canada, Canadian Interest Rates and Monetary Policy Variables:
10-Year Lookup, accessed at http://www.bankofcanada.ca/rates/interest-rates/canadian-interest-
rates/
(CMHC, 2009) Canada Mortgage and Housing Corporation, Canadian Housing Observer, 2009
(CMHC, 2013) Canada Mortgage and Housing Corporation, Long-Term Household Growth
Projections – 2013 Update
(CMHC, 2016a) Canada Mortgage and Housing Corporation, Housing Market Outlook Reports,
2016
(CMHC, 2016b) Canada Mortgage and Housing Corporation, Long-Term Household Growth
Projections – 2015 Update
(CMHC, 2016c) Canada Mortgage and Housing Corporation, Rental Housing Market Surveys,
2006-2015.
(Canadian Business, 2015) CanadianBusiness.com How the party leaders could cool the housing
market—and why they won’t http://www.canadianbusiness.com/economy/how-the-party-
leaders-could-cool-the-housing-market-and-why-they-wont/
(Ontario, 2016) Ontario Ministry of Finance, Ontario Population Projections Update, 2015–2041
(Statistics Canada, 2016). Statistics Canada, Custom Tabulated National Housing Survey Data,
2011
(Statistics Canada, 2015). Statistics Canada, Labour Force Survey, CANSIM Table 282-0122
(Focus Consulting, 2011) Focus Consulting. The Contribution and Potential of the Private
Residential Rental Market: Canada Case Study
(FRPO, 2005) Federation of Rental-housing Providers of Ontario. Conversions and Demolitions
Policies in Ontario: Myths and Realities
(Steele, 1991) Steele, Marion. Conversions, condominiums and capital gains: changes in the
structure of the Ontario rental housing market
(Suttor, 2015) Suttor, Greg. Rental Housing Dynamics and Lower-Income Neighbourhoods in
Canada. Neighbourhood Change Research Partnership. University of Toronto
29You can also read