ELEVENTH MALAYSIA PLAN - 2016-2020 ANCHORING GROWTH ON PEOPLE Economic Planning Unit
←
→
Page content transcription
If your browser does not render page correctly, please read the page content below

ELEVENTH MALAYSIA PLAN
      2016-2020
 ANCHORING GROWTH ON PEOPLE

            Economic Planning Unit,
      Prime Minister’s Department, Malaysia
Outline

  1   Introduction of 11MP, 2016-2020

  2 11 MP macroeconomic targets

  3 11 MP strategic thrusts and game changers

                                                2
THE THEME OF THE ELEVENTH MALAYSIA PLAN (11MP) IS
                                                                  “    1. Introduction

“         Anchoring growth on people
            1

 People are the bedrock of
        the nation
                                         2

                              Preparing people for the
                                      future
                                                                   3

                                                         Everyone enjoys growth
                                                            and development

                                                                                         3
1. Introduction

11MP is part of a systematic planning of national
development ...
 1st Malaya Plan 2nd Malaysia Plan      6MP             8MP                 10MP
2nd Malaya Plan       3MP
1st Malaysia Plan     4MP               7MP             9MP           Eleventh Malaysia
                                                                             Plan
                      5MP

                        New            National       National             National
                     Economic        Development    Vision Policy        Transforma-
Post Independence,     Policy           Policy                            tion Policy
     1956-1970       1971-1990        1991-2000      2001-2010            2011-2020
                     Growth with        Balanced    A resilient and      New Economic
                        equity        development    competitive            Model
                                                        nation

                                                    Vision 2020
                                                     1991-2020
                                                                                              4
Outline

  1 Introduction of 11MP, 2016-2020

  2   11 MP macroeconomic targets
  3 11 MP strategic thrusts and game changers

                                                5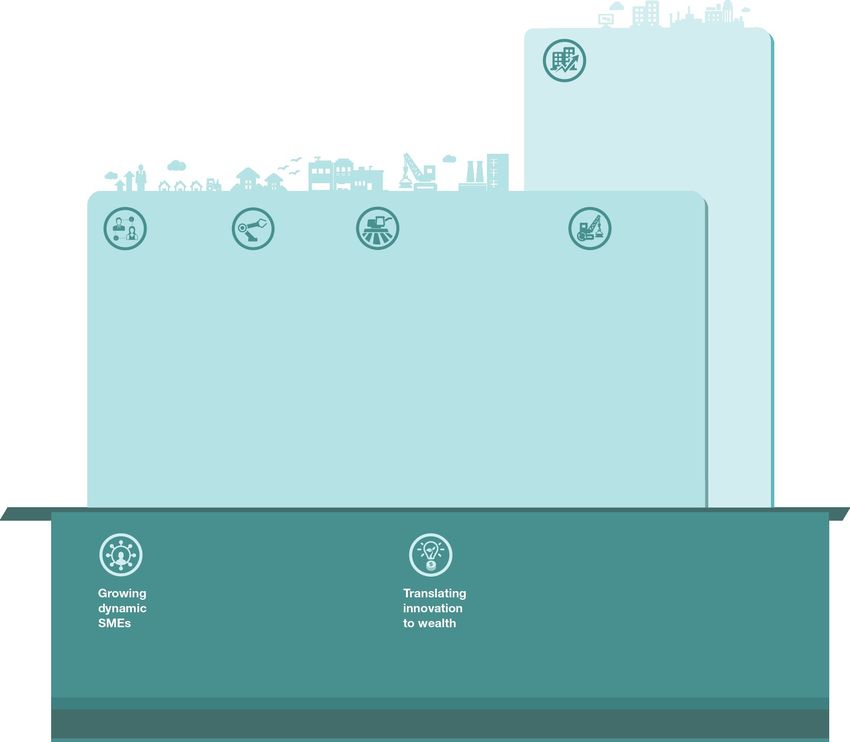
Targets, main strategies and selected macro economic outcomes                                             2. Targets
             Strengthening macro economic resilience for growth

      Strategies                                  Initiatives
                               National           Industry              Enterprise     Multidimensional goals,
Unlocking
productivity potential         Malaysia          Productivity            Enterprise-   2016-2020
                              Productivity       Champions                  level      GDP growth at
to ensure sustainable
and inclusive growth
                               Blueprint          based on              productivity           5-6%
                                                                                               per annum
                                                   industry             assessments
                             Public sector
                                                                         and targets
                             productivity                                              Labour productivity increases
                                                  Outcomes                             from RM77,100 (2015)
Promoting                                                               291
                                                                                       to
                                                                                              RM92,300
investment to                        9.4%                          RM
                                                                    billion                   (2020)

spearhead economic       Average growth of real private Average private investment
                                                                                       GNI per capita at

growth                            investment                 in current prices
                                                                                                    RM54,100
                                                                                                    by 2020
                                                                                       Average monthly household income
                                                                                       increases from RM6,141 (2014)
Increasing exports to                                                   57.3
                                     4.6%
                                                                   RM
                                                                                       to
                                                                    billion
improve trade                                                                                       RM10,540
                                                                                                       (2020)
balance                     Average growth of gross             Trade balance
                                    export                         by 2020             Compensation of employees to
                                                                                       GDP increase from 34.9% (2015)
Enhancing fiscal                     below
                                                                                       to
                                                                                                        40%
                                                                                                        (2020)
flexibility to                       45%
ensure sustainable                                                                     Malaysia Wellbeing Index
fiscal position           Ratio of Federal Government     Fiscal position to be        (MWI) to increase
                           total debt to GDP by 2020       balanced by 2020            by
                                                                                                         1.7%
                                                                                                           per annum                6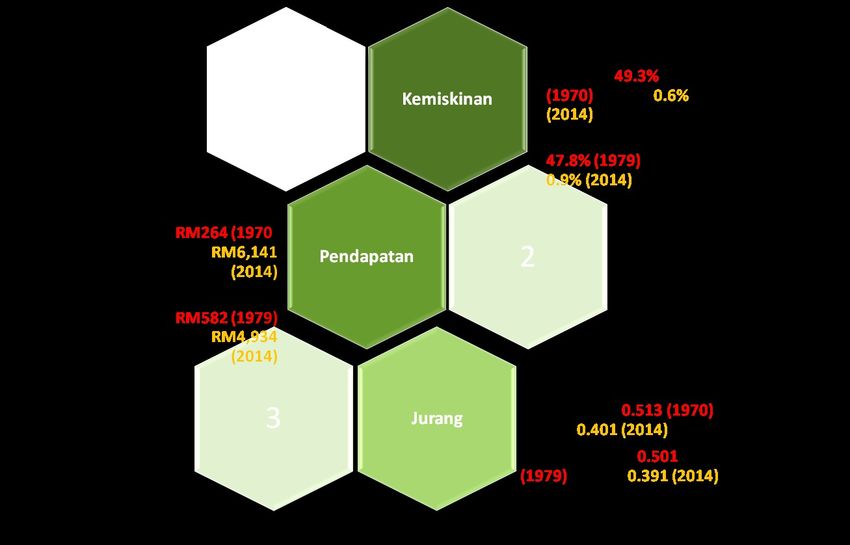
2. Targets
             Income gaps have narrowed since 1990, but higher
             growth is needed for 11MP…

                        1991-2000
                         1991-2000 (%
                                    (% p.a.)
                                        p.a.)             2001-2010
                                                           2001-2010 (%
                                                                      (% p.a.)
                                                                          p.a.)             2011-2020
                                                                                             2011-2020 (%
                                                                                                        (% p.a.)
                                                                                                            p.a.)
                        ••GDP
                          GDP            :: 7.1
                                             7.1          ••GDP
                                                            GDP            :: 4.6
                                                                               4.6          ••GDP
                                                                                              GDP            :: 5.6
                                                                                                                 5.6
                        ••GNI
                          GNI per
                              per capita
                                  capita                  ••GNI
                                                            GNI per
                                                                per capita
                                                                    capita                  ••GNI
                                                                                              GNI per
                                                                                                  per capita
                                                                                                      capita
                           oo RM
                               RM        :: 7.8
                                            7.8              oo RM
                                                                 RM        :: 6.4
                                                                              6.4              oo RM
                                                                                                   RM        :: 6.9
                                                                                                                6.9
GNI per capita             oo USD
                               USD       :: 4.2
                                            4.2              oo USD
                                                                 USD       :: 8.1
                                                                              8.1              oo USD
                                                                                                   USD       :: 6.2
                                                                                                                6.2
(US$)                   ••US$1 = RM2.99
                          US$1 = RM2.99                   ••US$1 = RM3.62
                                                            US$1 = RM3.62                   ••US$1 = RM3.35
                                                                                              US$1 = RM3.35

               US$15,000

                   Minimum for high-
                                                                                                       -24%
                   income
                   economies                                                         -30%

                                                                                                                       GDP: 5-6%
                                                   -57%                                                                (US$1= RM3.45)
                 -66%

                                                                         Malaysia
                                                                                             GDP: 5.3%
                                                                                             (US$1=RM3.24)

Note: Based on GDP (2010 = base year)                                                                                                7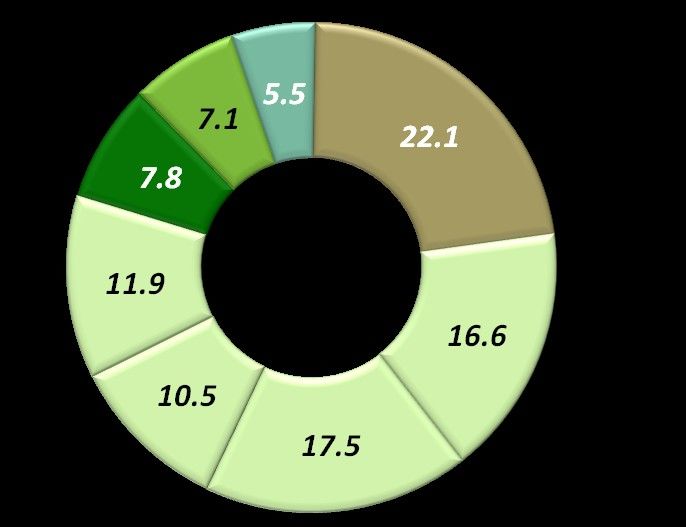
2. Targets
     Households in all income groups are expected to
     enjoy higher income, especially B40 households …

Average monthly household income
(RM’000 in current price)

                                                   T20 : RM22,240                                     % p.a.
                                                                             Income
                                                                              Group       2011-2015        2016-2020

                                                                             National        8.9               9.8
                              RM14,305                                         T20           7.2               8.2
                                                                              M40            9.5               10.1
                                         National Average:
                                                RM10,540                       B40           12.7              13.2
                                                             M40 : RM9,970
                                                             National Median: RM8,420
                    RM5,662
                                                             B40 : RM5,270

                                                                                  Ratio of T20 over
       6.90         6.94           5.64                4.22                         B40 income
                                                                                                                       8
2. Targets
            Growth will be driven by domestic demand with
            increased contribution from the external sector…
                                    10MP,           11MP,               11MP
                                   2011-2015       2016-2020            •Focus on high quality private
                                  Achievement            Target         investment in manufacturing and
                                          % to                % to      services sector to create high income
                                   %               %
                                  p.a.
                                          2015
                                                  p.a.
                                                              2020      job
                                          GDP                 GDP       •Public and private investments will
Real GDP                          5.3    100.0   5.0-6.0      100.0     be driven by infrastructure projects
                                                                        such as high-speed railway, LRT3 and
Consumption                       6.8     65.1    5.9         65.3
                                                                        Pan Borneo Highway
  Private                         7.1     52.4    6.4         53.9      •Private consumption will increase in
  Public                          5.5     12.7    3.7         11.5      line with the country's prosperity
Investment                        9.1     26.8    7.2         28.6      •Public consumption is expected to
                                                                        moderate due to prudent spending
  Private                         12.6    17.3    9.4         20.4
                                                                        •Positive contribution from net
  Public                          4.0     9.5     2.7             8.2
                                                                        exports
Net Exports                       -7.4    8.4     0.4             6.4
  Exports                         2.1     74.4    2.1         62.0
  Imports                         3.8     66.0    2.3         55.6
Note: Based on GDP (2010 = 100)                                                                                   9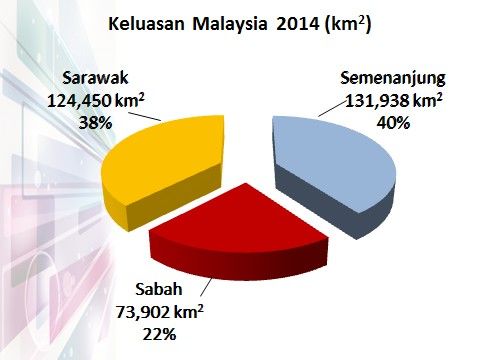
2. Targets

              11MP : GDP is projected to grow 5-6% and is expected to be
              driven by productivity …
 GDP growth (% p.a.) / % to GDP*                 GDP growth (% p.a.)
                                                                        5.0-6.0
                                                               5.3

                                                                        (44.0% )
                                        11MP                  (48.8%)
                                  •GDP* : 6.0%
                                  •GDP: 5-6%
                                                                         (16.0%)

                                                              (21.4%)

                                                                         (40.0%
                                                                        to GDP)
                                                              (29.8%)

Note: Based on GDP (2010 = 100)                                                         10
2. Targets
Manufacturing and services sectors will spearhead
the growth ...
10MP, 11MP,
Sector/ 2011-2015 2016-2020 Construction
% p.a. Mining Manufacturing
Achievement Target
Agriculture 2.4 3.5 Agriculture
Services
Mining 0.9 1.3 56.5 2020
Construction 11.1 10.3 RM1.4 tn
Finance,
Business Others-
Manufacturing 4.8 5.1 Utilities,
Govt.
Transportation, Services,
Services 6.3 6.9 Communications Private
Education
GDP 5.3 5.0-6.0 Trade, & Private
Accommodation & Health
Restaurants
Notes: Based on GDP (2010 = 100) 11Outline
1 Introduction of 11MP, 2016-2020
2 11 MP macroeconomic targets
3 11 MP strategic thrusts and game changers
123. Strategic Thrusts
11MP new dimensions …
• Co-developed over 18 1 Action driven
Focus more on the effectiveness of
months of implementation
stakeholder
2 People-centric
engagement with all Focus more on people economy – increase access
to education, healthcare, housing and reducing
segments of society income disparity
• It is the final leg in the
journey towards 3 Game changers
To spur growth and ensure inclusivity
achieving Vision 2020,
and lays the 4 Taking the long-term
foundation for further view
Goes beyond 2020
growth
13The 11MP has 6 strategic thrusts to address the needs 3. Strategic Thrusts
of the rakyat and 6 game changers to accelerate Malaysia’s development ...
rus
t s
a me rs
h G ge Uplifting B40 households
T
Enhancing inclusiveness ch
an 2 towards a middle-class
1 towards an equitable society society
Improving wellbeing for all
2
Enabling industry-led Technical
Accelerating human capital 2 and Vocational Education and
3 development for an advanced nation Training (TVET)
Embarking on green growth
Pursuing green growth for 3
4 sustainability and resilience
Strengthening infrastructure to support
5 economic expansion 4 5 6
Re-engineering economic growth for Enhancing Innovation to Competitive
6 greater prosperity productivity wealth cities 14STRATEGIC THRUST 1
Enhancing
inclusiveness towards
an equitable society
15Strategic Thrust 1 3. Strategic Thrusts
Enhancing inclusiveness towards an
equitable society
Main strategies and selected outcomes Paved roads will
3,000 be constructed
km
Empowering communities
8 Transforming rural areas to
for a productive and
out of
prosperous society uplift wellbeing of rural
10 communities
Average score in the
Family Wellbeing
Index
Bumiputera
Uplifting B40 households At least
towards a middle class 1 participation in skilled
society occupation category 60%
RM Mean monthly Enhancing opportunities
5,270 household for the Bumiputera
income in 2020 Economic Community
from RM2,537 in (BEC) to increase wealth
2014 ownership
Accelerating regional
growth for better
RM
236 Realised investment
billion
geographic balance
16reduction in Gini paved roads will
0.38 coefficient from 0.401
in 2014
3,000km be constructed
5
mean monthly
RM additional houses will
household income
90,00 be supplied with clean
5,27
from RM2,537 in 2014
and treated water
0
0
median monthly
RM household from
additional houses will
36,80 be supplied with
5,70 RM2,629 in 2014
0
electricity
OUTCOMES
Improving 1
SELECTED
overall income Uplifting B40 Transforming rural
inequality households towards areas to uplift
a middle-class wellbeing of rural
society communities
Empowering Accelerating regional Enhancing Bumiputera
communities for a growth for better Economic Community (BEC)
productive and geographic balance opportunities to increase
prosperous society wealth ownership
8 average score in the realised AT LEAST participation of Bumiputera in skilled
out of Family Wellbeing
Index
RM
236 investment
60 % occupation category
billion
10
AT LEAST Bumiputera households own
participation of women in Peluang pekerjaan
90 % a residential unit
59% the workforce from
53.6% in 2014 470,00 diwujudkan
0
AT LEAST Bumiputera corporate equity
30% ownership with effective
control3. Strategic Thrusts
Game Changer: Uplifting B40 households
towards a middle-class society
Raising the income and wealth of B40 Addressing the increasing
households cost of living
Reducing school dropouts Enhancing integrated Increasing the provision of
entrepreneurship support affordable housing
K9 SME 47,000 50,000
Corp
K9 concept is a primary school SME Corp will coordinate the Program Bantuan Rumah Program Perumahan
with secondary level from Form 1 development of the SMEs owned which will be implemented Rakyat which will be
to 3 that will be expanded by B40 households during 11MP implemented during 11MP
particularly in the rural and
remote areas
Enhancing accessibility to Incentivising investment in Increasing access to
higher education and skills majority B40 households healthcare services
training areas
Community Mobile Flying
CLINICS
Desa CLINICS Udara
DOCTORS
20% MNC
Increase access to basic
Increasing the percentage of B40 The private sectors will be healthcare services
households with tertiary incentivised to locate their
educational attainment by 2020 business operations in areas with
from 9% in 2014 majority B40 households 18STRATEGIC THRUST 2
Improving wellbeing
for all
19Strategic Thrust 2 3. Strategic Thrusts
Improving wellbeing for all
Main strategies and selected outcomes
Achieving Providing Creating Improving Enculturating Promoting
universal adequate and quality safer living road safety the spirit of sports for
access to affordable housing environment and 1Malaysia to healthy
quality to poor, low- and for emergency foster social living and
healthcare middle-income communities services to cohesion and unity
households to thrive reduce national unity
fatalities
2.3 47,000 60% 8
minutes
6,800 50%
Hospital beds per Houses to be Percent of Optimised emergency Number of schools Minimum percentage
1,000 population constructed/repaired population response time with Kelab Rukun of Malaysians who
for the poor feeling safe Negara embrace a sports
culture
1:400 606,000 5% 2.0
Doctor to Houses to be developed Annual reduction Road fatalities index
population ratio for low- and middle-income in crime index per 10,000 registered
households vehicles 20Malaysian Wellbeing Index
1.7 Increase per annum,
% compared to 1.1% during the
Tenth Plan
Achieving universal
access to quality Enculturating the spirit of Promoting sports for
healthcare 1Malaysia to foster social healthy living and unity
Hospital beds cohesion and national unity
2.3 per 1,000
Number of
Minimum
50
population1 percentage of
schools with %
6,80 Kelab Rukun
Malaysians who
OUTCOMES
0 embrace a sports
SELECTED
Negara
1:40 Doctor to
population ratio
Improving road safety culture
and emergency
0 services to reduce
fatalities
Providing adequate and
quality affordable
Creating safer living
environments for thriving minute
8 Optimised emergency
response time
housing to poor, low- communities s
and middle-income
households Road fatalities index per
Percent of 2.0
47,00
Houses to be
constructed/ 60 % population
feeling safe
10,000 registered vehicles
repaired for
0 the poor
Houses to be
developed for 5 % 8
minute
Optimised
police response
606,00 Annual reduction
time
low- and s
0 in crime index
middle-income
households
1
Includes public and private hospitals, maternity and nursing homes, hospices and ambulatory care centres.
21STRATEGIC THRUST 3
Accelerating human
capital development
for an advanced nation
22Strategic Thrust 3 3. Strategic Thrusts
Accelerating human capital development for
an advanced nation 2
Main strategies and selected outcomes
Game Changer
Improving labour market efficiency Enabling industry-led Technical and
to accelerate economic growth Vocational Education and Training (TVET)
60% of the 1.5 million jobs that will be created
during the Eleventh Plan will require TVET-
Labour productivity growth
3.7 %
rate per annum
related skills
Compensation of Transforming TVET to meet
40% employees to GDP in
2020
industry demand
Intake of SPM leavers to
225,000 TVET programmes
RM
2,500
Monthly median Improving the quality of education
wage in 2020 for better student outcomes and Strengthening lifelong learning for skills
institutional excellence enhancement
Increase in number of
TOP 58 %
employees that will
100 100 % benefit from expansion
of the HRDF act
2 universities in Top 100 of the Student enrolment from preschool to upper
QS World University Rankings secondary 23Improving labour Transforming Strengthening Improving the
market efficiency TVET to meet lifelong quality of education
to accelerate industry learning for for better student
economic growth demand skills outcomes and
enhancement institutional
OUTCOMES
SELECTED
excellence
3.7 225,000 58 %
% 0
Per annum labour Intake of SPM leavers to Increase in number of Malaysia aims to be at least on par with
productivity target in the TVET programmes; an employees that will benefit the international average in PISA and
Eleventh Plan, compared increase from 164,000 in from expansion of the HRDF TIMSS assessments
with 2.6% in the Tenth 2013 Act; from 1.77 million
Plan employees in 2014 to 2.8
million in 2020 2 universities in the
TOP
10
top 100 of the QS
World University
Rankings
40 %
RM
2,50 0
0
Compensation of Monthly median wage in
100
employees to GDP in 2020; an increase from %
2020; an increase from RM1,575 in 2014
33.6% in 2013 Student enrolment
from preschool to
upper secondary
24Game changer
Enabling industry-led Technical and
Vocational Education and Training (TVET)
60% of the We will enable industry to
1.5
play a greater role across
60%
the value chain, from
million student recruitment through
to curriculum design,
jobs that will be
delivery and job placement,
to ensure that the supply of
created during the graduates truly meets
Eleventh Plan will industry demand.
require TVET-related
skills
1 2 3 4 5 6
25STRATEGIC THRUST 4
Pursuing green growth
for sustainability and
resilience
26Strategic Thrust 4 3. Strategic Thrusts
Pursuing green growth for sustainability
and resilience 3
Main strategies and selected outcomes
Game Changer
Embarking on green growth
•Green lifestyle
Strengthening resilience •Reduce, reuse and recycle
against climate change and •Green learning
natural disasters
DRM Establishment of national
crisis and disaster
management Strengthening the enabling
environment for green
2
million
People protected through
flood mitigation projects
growth
Adopting the sustainable
consumption and production
Conserving natural resources for present
concept
and future generations Up to
Reduction in GHGs emission
Terrestrial and inland Coastal and marine areas 40 % intensity of GDP compared
17 % water gazetted as 10 % gazetted as protected areas to 2005 level
protected areas
27UP TO Reduction in GHGs
4% emission intensity of
GDP compared to 2005
level
0
At least
DSM 2,08
MW
0 2% 2%
0 2
OUTCOMES
Formulation of a In renewable Government Recycling rate of
SELECTED
comprehensive demand side energy installed procurement to be household waste
management master plan capacity green
Adopting the sustainable consumption and production
concept
Strengthening resilience Conserving natural resources for
against climate change and present and future generations
natural disasters
National crisis and disaster Terrestrial and inland
DRM
management centre to enhance
capacity for disaster
preparedness and response
1% water areas gazette as
protected areas
7
2
million
People protected through
flood mitigation projects
1%
Coastal and marine areas
gazette as protected
areas
0 28Game changer
Embarking on green growth
Living and Reduce, Learning to
moving reuse, and be green
green
We will reshape our lifestyles to be recycle (3R) We will instil a shared responsibility
more energy efficient. Households and
industries will be encouraged to use We will look at waste as a valuable to protect the environment through
less energy during peak hours through resource. Households will be education. In schools, sustainable
demand side management practices encouraged to separate their waste consumption and production
such as energy labelling. Residents will to reach a 22% household recycling practices will be embedded in the
have more and better public transport rate by 2020, while private sector will curriculum to instil the right behavior
options, as we move towards energy be encouraged to reuse waste as and mindset.
efficient vehicles. The proportion of inputs for energy conversion or other
renewables in the energy mix will be products.
increased.
1 2 3 4 5 6
29STRATEGIC THRUST 5
Strengthening
infrastructure to
support economic
expansion
30Strategic Thrust 5 3. Strategic Thrusts
Strengthening infrastructure to support
economic expansion
Main strategies and selected outcomes Encouraging sustainable energy
use to support growth
EURO 4M, EURO 5 standards & B15
(15% bio-diesel blending)
implemented
Building an integrated need-based
transport system New generation capacity
Malaysian Aviation
7,626
40 % Public transport
capital share in Commission as newly
MW installed in Peninsular
Malaysia
GKL/KV established regulator
Unleashing growth of logistics and
Continuing the transition to a enhancing trade facilitation
new water services industry TOP
framework Annual growth of transport
and storage subsector
8.5 % 10
Top 10 in the World Bank
Logistics Performance
99 % Population served by
clean and treated
Index
water
Improving coverage, quality and affordability
of digital infrastructure
Sewerage connected
80 % services coverage,
especially in main cities
95 % Populated areas covered
by broadband 1 % Of GNI per capita for
fixed broadband cost
infrastructure 3140 9 99
Populated areas covered Population served by
% Public transport
modal share in % by broadband
infrastructure
% clean and treated water
by 2020
GKL/KV
5 Of GNI per capita for Sewerage connected services
3,00
1% 8%
Paved rural roads fixed broadband cost coverage, especially in main
constructed cities, by 2020
km
0
Nationwide with Digital 0
46 2%
Malaysian Aviation Terrestrial Television roll-out
Commission as newly in 2016-2017 with all Non-revenue water by
OUTCOMES
established regulator services available after ASO 2020
SELECTED
areas
completion
Building an integrated Improving coverage, 5 the
Continuing
need-based transport quality, and transition to a new
system affordability of digital water services
infrastructure industry framework
Unleashing growth of Encouraging sustainable
logistics and enhancing energy use to support
trade facilitation growth
EURO 4M, EURO 5 New generation
Annual growth of transport standards for clean fuel and
7,62 capacity installed in
8. % and storage subsector B15 (15% biodiesel
blending) roll-out by 2020 MW6
Peninsular Malaysia by
2020
5
Additional LNG import
3.5
TOP
1
In the World Bank Additional refining
Logistics Performance
capacity through RGT- 300,00 capacity by 2019
2 in Pengerang, Johor
Index MTPA BPD
0STRATEGIC THRUST 6
Re-engineering
growth for greater
prosperity
33Strategic Thrust 6 3. Strategic Thrusts
Re-engineering economic growth for Investing in competitive cities and
greater prosperity regional economic corridors
Main strategies and selected outcomes development
4
Economic development plan
specifically for 4 cities
identified
4 5 6
Transforming Energising Modernising Transforming
services manufacturing agriculture construction
Growth of Growth of Growth of Growth of
Game Changers
6.9%
per annum
5.1%
per annum
3.5
per annum
% 10.3 %
per annum
•Enhancing the
potential of
Contribution of Contribution of Contribution of Contribution of productivity
RM3,488 billion RM1,417 billion RM519 billion RM327 billion •Translating
(56.5% to GDP) with (22.5% to GDP) with (8.2% to GDP) with (5.2% to GDP) with innovation to wealth
9.6 million jobs 2.8 million jobs 1.6 million jobs 1.2 million jobs
•Investing in
competitive cities
Growth of GERD
9.3 %
per annum
Contribution of
RM2,421 billion 2%
of GDP
Gross expenditure
on R&D of GDP
Growing or 38.4% Translating
dynamic SMEs to GDP with innovation to
RM 70% of total R&D
2,421 9.5 million jobs
billion across all sectors
wealth
70 % expenditure by
Business Enterprises
34Contribution of RM3,488 Contribution of RM519 Contribution of RM2,421 billion
billion or 56.55% to GDP billion or 8.2% to GDP or 38.4% to GDP with 9.5
with 9.6 million jobs with 1.6 million jobs million jobs across all sectors
GERD Gross
2%
Growth of Growth of Growth of
6.9 %
per annum
3.5 %
per annum
9.3 %
per annum
expenditure on
R&D of GDP
Of GDP
70% of total R&D
RM
3,488
billion
RM
519
billion
RM
2,421
billion 7 % expenditure by
Business Enterprises
0
OUTCOMES
SELECTED
Tranforming Modernisin Growing Translating
services g dynamic innovation to
agriculture SMEs wealth
Energising Transforming Investing in competitive cities
manufacturin construction and regional economic
corridors
4
g
Cities with City
RM
1,417 RM
327 Competitiveness
billion billion Masterplans
developed
Growth of Growth of Realised investment
5.1% 10. % 236
RM
with 470,000 job
per annum per annum
billion opportunities created
3 across five regional
economic corridors
Contribution of RM1,417 Contribution of RM327
billion or 22.5% to GDP with billion or 5.5% to GDP
2.8 million jobs with 1.2 million jobs3. Strategic Thrusts
4 Game Changer: Unlocking the potential of productivity
How? will this be achieved
Why? Is productivity important Malaysia’s approach to productivity will shift from primarily Government-
for Malaysia driven initiatives at the national level to targeted actions across the public
sector, industry players, and individual enterprises.
Greater emphasis on increasing
productivity to achieve a more Strategies
sustainable, inclusive, and high
rate of economic growth
What? will success look like
labour productivity is targeted
to rise by 3.7% per annum to
RM92,300 in 2020 from
RM77,100 in 2015
sectoral growth will accelerate
due to improvements in
productivity
363. Strategic Thrusts
4 Game Changer: Translating innovation to wealth
Why? is innovation How? will this be achieved
important for Malaysia
Innovation will be targeted at both the enterprise and
As Malaysia continues to move towards a
societal levels, instead of previous efforts which focused
high-value, knowledge-based economy with a
primarily on national-level
strong focus on the services and
initiatives
manufacturing sectors, innovation will be
crucial to raise the overall efficiency and thus
productivity of each sector
Strategies
What? will success look like
In the enhanced innovation
ecosystem, there will be greater
collaboration and integration across
industry, academia, and
communities
Research will be closely aligned with
industry demand, and the private
sector will be active partners in the
research, development,
commercialisation, and innovation
(R&D&C&I) process by contributing
funds, expertise, and other resources
373. Strategic Thrusts
4 Game Changer: Investing in competitive cities
Why? Important to Malaysia How? will this be achieved
Cities played an important role in a City Competitiveness Master Plans will be developed for
nation’s growth by providing investment four major cities Kuala Lumpur, Johor Bahru, Kuching and
and trade opportunities, as well as Kota Kinabalu as a start, based on key principles that
improving connectivity with rural or increase liveability and stimulate economic growth …
suburban areas
Strategies
What? will success look like
Developing city Strengthening corridors to
competitiveness master fuel regional development
Four major cities in Malaysia will have plans
undergone a step-change in their Strategic review of the
economic growth, importance as talent Enhancing economic density corridor development
hubs, and liveability Expanding Transit-oriented master plans
Development (TOD) Increased investment
City residents will be able to afford
urban housing, have adequate public Strengthening knowledge-
Improved infrastructure
transportation systems, enjoy green and based clusters
open spaces, and have access to Enhancing liveability Improved talent and skill
economic opportunities that will enable development
them to provide their children with a Adopting green-based
better future development and practices
Ensuring inclusivity
381 Rancangan Malaysia Kesebelas
Sosio Economic profile
Bottom 40 profile
39Bilangan Penduduk Malaysia, 2014
Jumlah penduduk
negara: 30.1juta
Sumber: Bahagian Perangkaan Penduduk dan Demografi, Jabatan Perangkaan Malaysia (DOSM) 40Keluasan & Kepadatan Penduduk
Malaysia 2014
Sumber:
Jabatan Ukur dan Pemetaan Malaysia
Bahagian Perangkaan Penduduk dan Demografi, Jabatan Perangkaan Malaysia (DOSM) 41Kadar Urbanisasi Sarawak, 2010 & 2014
Kadar
Urbanisasi
Semenanjung
2014 – 77.8%
42
Sumber: Anggaran Jabatan Perangkaan MalaysiaKadar kemiskinan semakin berkurangan…
%
43Pendapatan purata isi rumah semakin meningkat…
44Pekali Gini Mengikut Negeri, 2009, 2012 & 2014
Jurang semakin mengecil…
45
45Struktur Kumpulan Pendapatan Isi Rumah, 2014
MALAYSIA SARAWAK
Petunjuk:
Isi rumah T20
Isi rumah M40
T20
Isi rumah B40
Miskin
RM8,319 RM6,989
Miskin Tegar
M40
Julat Pendapatan: Julat Pendapatan:
T20 (Y > RM8,319) RM3,170 T20 (Y > RM6,989)
RM3,860
M40 (RM3,860 ≤ Y ≤ M40 (RM3,170 ≤ Y ≤
RM8,319) RM6,989)
B40 (YBilangan Isi Rumah Miskin, Miskin Tegar dan B401 Mengikut
Negeri, 2014
Taburan
isi rumah 12.8 11.8 10.9 10.5 10.1 10.1 8.2 6.9 4.8 4.5 3.6 2.3 2.1 1.3 0.2 0.0
B40 (%)
Nota: 1Merujuk kepada isi rumah yang berpendapatan di bawah RM3,860 sebulan (berdasarkan cut-off isi rumah B40 di peringkat Malaysia) 47PROFIL ISI RUMAH B40 NEGERI SARAWAK
SIAPA? KENAPA?
• Pendapatan purata bulanan isi rumah < • Tahap pendidikan rendah
RM3,170/bulan • Pekerjaan bergaji rendah
• Anggaran jumlah isi rumah: 232.8 ribu • Usahawan kecil dan mikro
• Pendapatan purata bulanan: RM2,044 • Produktiviti rendah
• Pendapatan penengah bulanan:
RM2,035
• Majoriti Bumiputera – 85.2% • Akses kepada pendidikan dan
• Tahap pendidikan rendah – 39.9% SPM dan ke latihan berkualiti rendah
bawah • Peluang latihan kemahiran –
• 24.4% Ketua Isi Rumah berusia 60 tahun dan ke kelayakan rendah
atas • Keupayaan bersaing rendah
• 60.9% pekerjaan bergaji
• 38.6% bekerja sendiri
DI MANA? • Ketidakseimbangan kawasan
pembangunan
• Majoriti di luar bandar: 63.1% • Secara berbanding – akses kepada
• KIR di bandar: 85.9 ribu
kemudahan asas & infrastruktur
• KIR di luar bandar: 146.8 ribu
kurangTaburan peratus isi rumah B40 mengikut kumpulan
industri1 ketua isi rumah dan strata,
Negeri Sarawak, 2014
PMR/SRP
SPM/SPMV
STPM
Diploma/Sijil
Ijazah/Dip. Lanjutan
Tiada Sijil¹
Nota: 1 “Tiada Sijil” merujuk kepada seseorang yang masih bersekolah; atau Sumber: Penyiasatan Pendapatan dan Perbelanjaan Isi Rumah, 2014
telah tamat persekolahan tanpa memperoleh sebarang sijil
49Taburan peratus isi rumah B40 mengikut pekerjaan1 ketua isi
rumah dan strata, Negeri Sarawak, 2014
Negeri Sarawak Bandar Luar Bandar
% % %
Nota: 1 Tidak termasuk suri rumah/menjaga rumah, pesara penganggur dan Sumber: Penyiasatan Pendapatan dan Perbelanjaan Isi Rumah, 2014
lain-lain . 50Majoriti terlibat dalam pekerjaan bernilai tambah rendah dalam industri
pertanian, perhutanan dan perikanan…
Pekerjaan
Pekerja
Pekerja Mahir Operator Loji dan
Industri Kemahiran dan Pekerja
Pertanian, Pekerjaan Mesin serta
Pekerja Perkhidmatan Lain-lain Jumlah
Perhutanan dan Asas Pemasang
Pertukangan dan Jualan
Perikanan
yang berkaitan
Pertanian, perhutanan dan
32.4 4.1 0.8 0.7 1.0 0.6 39.5
perikanan
Pembinaan - 8.5 7.1 0.2 0.6 0.8 17.2
Pembuatan 0.0 1.5 4.3 0.4 2.4 1.1 9.8
Perdagangan borong dan runcit;
pembaikan kenderaan bermotor 0.1 0.9 2.0 4.5 1.3 0.7 9.5
dan motosikal
Aktiviti pentadbiran dan khidmat
sokongan - 2.0 - 2.9 0.1 0.2 5.2
Pentadbiran awam dan
pertahanan; aktviti keselamatan
0.1 0.9 0.0 1.1 0.3 1.6 4.1
sosial wajib
Pengangkutan dan penyimpanan
0.0 0.6 0.1 0.1 2.8 0.4 4.0
Lain-lain - 2.1 0.5 4.5 0.9 2.9 10.8
Jumlah 32.6 20.5 14.8 14.4 9.4 8.2 100.0
51Bandar: Terlibat dalam industri pembinaan dalam pekerjaan
berpendapatan rendah…
Pekerjaan
Pekerja
Pekerja Kemahiran dan
Industri Operator Loji dan
Pekerjaan Asas Perkhidmatan Pekerja Pekerja Sokongan
Mesin serta Lain-lain Jumlah
dan Jualan Pertukangan Perkeranian
Pemasang
yang berkaitan
Pembinaan 11.4 0.2 9.0 1.3 0.4 1.3 23.6
Perdagangan borong dan runcit;
pembaikan kenderaan bermotor dan
1.6 7.6 3.9 2.2 0.6 0.8 16.6
motosikal
Pembuatan
1.9 0.7 7.3 4.6 0.8 1.3 16.4
Penginapan dan aktiviti
perkhidmatan makanan dan
1.4 5.5 0.1 - 0.6 0.6 8.3
minuman
Pengangkutan dan penyimpanan
1.1 0.1 0.2 4.7 0.6 0.2 6.9
Aktiviti pentadbiran dan khidmat
sokongan 2.6 3.7 - 0.1 0.3 0.1 6.8
Pentadbiran awam dan pertahanan;
aktviti keselamatan sosial wajib 1.4 1.6 0.1 0.6 0.8 0.8 5.5
Lain-lain 2.6 2.9 0.9 1.3 1.5 6.8 16.0
Jumlah 23.9 22.4 21.5 14.8 5.5 11.9 100.0 52Luar bandar: Terlibat dalam industri pertanian, perhutanan dan
perikanan …
Pekerjaan
Pekerja
Pekerja Mahir Kemahiran dan Operator Loji dan
Industri Pekerja
Pertanian, Pekerjaan Asas Pekerja Mesin serta
Perkhidmatan Lain-lain Jumlah
Perhutanan dan Pertukangan Pemasang
dan Jualan
Perikanan yang berkaitan
Pertanian, perhutanan dan perikanan 47.8 6.1 1.1 0.9 1.4 0.7 58.0
Pembinaan
- 7.0 6.1 0.1 0.3 0.3 13.7
Pembuatan
- 1.3 2.7 0.3 1.2 0.6 6.1
Perdagangan borong dan runcit;
pembaikan kenderaan bermotor dan
0.1 0.4 1.0 2.9 0.7 0.4 5.6
motosikal
Aktiviti pentadbiran dan khidmat
sokongan - 1.7 - 2.5 0.1 0.1 4.3
Pentadbiran awam dan pertahanan;
aktviti keselamatan sosial wajib 0.1 0.7 - 0.9 0.2 1.6 3.4
Pengangkutan dan penyimpanan 0.0 0.3 - 0.1 1.8 0.1 2.4
Lain-lain - 1.3 0.3 2.5 0.8 1.5 6.4
Jumlah 48.1 18.7 11.2 10.1 6.5 5.3 100.0
53Teras 1
INFRASTRUKTUR LUAR BANDAR
SEMENANJUNG SABAH SARAWAK SEMENANJUNG SABAH SARAWAK
54Teras 1
INFRASTRUKTUR LUAR BANDAR
55Teras 3
Bilangan Sekolah Rendah dan Menengah, 2013
56Teras 2
Nisbah Bilangan Klinik Kesihatan Kepada Penduduk
Nisbah Bilangan Penduduk bagi setiap Doktor
57Thank You
Economic Planning Unit
Prime Minister’s Department
www.epu.gov.my
585 Nod Pertumbuhan
Baharu
1. Industri berat 1. Kelapa sawit
berintensifkan tenaga 2. Pengeluaran makanan
3. Pembalakan
4. Pelancongan
1. Hab Perkhidmatan
2. R&D
3. Modal Insan
1. Taman Halal
2. Pembinaan kapal
3. Industri berasaskan sumber
1. Kelapa sawit
2. Pengeluaran makanan
3. Pembalakan
4. Pelancongan
59TERAS PEMBANGUNAN WILAYAH RMKE-11
Mempercepat Pertumbuhan Wilayah ke
Arah Keseimbangan Geografi yang Memperkukuh koridor bagi
Lebih Baik merancakkan pembangunan wilayah
..... Koridor ekonomi wilayah ..... Koridor ekonomi wilayah akan
terus merancakkan terus menjadi pemboleh ubah dalam
memastikan pembangunan yang
pertumbuhan ekonomi untuk seimbang di seluruh negara. Pada
menangani ketidakseimbangan akhir tempoh RMKe-11, pelaburan
antara dan dalam wilayah dan yang direalisasikan di semua koridor
meningkatkan inklusiviti dijangka akan bernilai RM236 bilion
dan menyediakan 470,000 peluang
pekerjaan
MEMPERKUKUH INKLUSIVITI KE ARAH MEREKAYASA PERTUMBUHAN EKONOMI
MASYARAKAT YANG SAKSAMA UNTUK PENINGKATAN KEMAKMURAN
60Mempercepat Pertumbuhan Wilayah ke Arah Keseimbangan Geografi
yang Lebih Baik
Memperkukuh koridor bagi merancakkan pembangunan wilayah
Inisiatif utama
Menilai semula strategik pelan induk pembangunan wilayah
Tumpuan kepada pelaksanaan inisiatif berteraskan inklusiviti
Kajian semula o SCORE – pembangunan program bagi menyokong pembangunan pelancongan dan
meningkatkan produktiviti pertanian
strategik pelan Mempercepatkan pelaburan, menyediakan infrastruktur dan mengkaji semula pelan
induk pembangunan koridor
Pengenalan Program Transformasi Ekonomi Sempadan (BETP)
o Dimulakan dengan sempadan Malaysia-Thailand (ECRE dan NCER)
o Bertujuan menarik pelaburan, mewujudkan pekerjaan dan meningkatkan pendapatan
untuk masyarakat tempatan
Menambah baik khidmat mudah cara kepada pelabur
Mempercepat Pengukuhan mekanisme penyampaian pelaburan – memudah cara, mobiliti dan
pelaburan di koridor pengkomersilan hasil penyelidikan
Perluasan model mudah cara pelabur
ekonomi Meningkatkan ketersambungan dan mobiliti
wilayah Membina dan menaik taraf jalan/lebuh raya – Pan Borneo
Pembangunan Mukah sebagai bandar pintar dan pembinaan lapangan terbang
Mempergiat penyelidikan, pembangunan dan pengkomersialan
Memperkukuh kerjasama di antara kerajaan, industri dan ahli akademik bagi menggiatkan
aktiviti penyelidikan, pembangunan dan pengkomersilan
61PERUNTUKAN PEMBANGUNAN PERSEKUTUAN RMKe-10 (2011 - 2015)
MENGIKUT NEGERI
JUMLAH RMKe -9 JUMLAH RMKe-10
NEGERI (2006-2010) (2011 - 2015)
(RM Juta ) (RM Juta)
Peruntuka n Peratus Peruntukan Peratus
JOHOR 13,894.45 6.04 11,366.18 4.94
KEDAH 9,293.46 4.04 5,361.21 2.33
KELANTAN 5,725.05 2.49 5,183.69 2.25
MELAKA 4,282.62 1.86 2,205.98 0.96
NEGERI SEMBILAN 9,203.78 4.00 4,817.36 2.09
PAHANG 10,393.54 4.52 11,402.23 4.96
PULAU PINANG 6,538.98 2.84 4,737.10 2.06
PERAK 9,428.10 4.10 6,330.17 2.75
PERLIS 2,875.46 1.25 1,654.53 0.72
SELANGOR 18,103.52 7.87 12,367.70 5.38
TERENGGANU 7,013.61 3.05 6,875.20 2.99
SABAH 20,316.33 8.83 20,608.71 8.96
SARAW AK 15,306.03 6.65 18,637.50 8.10
W ILAYAH PERSEKUTUAN 26,274.29 11.42 30,398.57 13.22
PELBAGAI NEGERI 71,350.76 31.02 88,053.80 38.28
JUMLAH 230,000.00 100.00 230,000.00 100.00
62Semenjak tahun 1970, Malaysia telah mencapai kejayaan besar dalam
usaha membasmi kemiskinan dan menyusun semula masyarakat …
Tumpuan dan pendekatan
pelaksanaan pembangunan telah
dikembangkan daripada pro-poor
kepada kumpulan isi rumah
berpendapatan 40 peratus terendah
(isi rumah B40)
Turut ditumpukan:
poket kemiskinan terutamanya
dalam kalangan masyarakat Orang
Asli di Semenanjung Malaysia dan
mereka di luar bandar dan
pedalaman Sabah dan Sarawak; dan
jurang sosioekonomi dalam
kalangan rakyat.
Kini, tumpuan diberikan kepada isi rumah B40… 63Back-up slides
2. Targets

            11MP: Strong economy growth with low inflation and full
            employment …
                    10MP               10MP
CPI (% p.a.),                           2.8
                     2.5
Unemployment (%)     3.0                2.9
                                                          11MP
                                                          •Inflation is expected to
                                                          remain low, averaging 2.5 -
                                                          3.0% per annum, on account
                                                          of supportive monetary
                                                          responses and administrative
                                                          measures to contain inflation
                                                          •Malaysia has recorded full
                                                          employment since 1994

 Source :
 •EPU forecast
                                                                                  65
You can also read