FARES AND TICKETING TRANSITION IN WELLINGTON
←
→
Page content transcription
If your browser does not render page correctly, please read the page content below
Fares and Ticketing Transition in Wellington        Reza Chalabianlou and Andrew G. Macbeth   Page i

              FARES AND TICKETING TRANSITION IN WELLINGTON
                                        Author: Reza Chalabianlou
                                         PhD Environmental Planning
                                Assoc.NZPI – New Zealand Planning Institute
                          Senior Policy Advisor, Greater Wellington Regional Council
                                        reza.chalabianlou@gw.govt.nz

                                   Co-author: Andrew G. Macbeth
                                   BE Civil – University of Canterbury
               MEng Transportation Planning and Traffic Engineering – University of Toronto
                                   Fellow – Engineering New Zealand
                       Senior Policy Advisor, Greater Wellington Regional Council
                                      andrew.macbeth@gw.govt.nz

                                         Presenter: Reza Chalabianlou

ABSTRACT
The Wellington region has the highest per capita use of public transport in New Zealand, and
notably competes with the large metropolitan areas in Australia. The region’s vision for the next
ten years is to grow public transport patronage, particularly for work journeys, and to make public
transport widely accessible for all. To realise this vision, the region’s public transport system has
recently been undergoing a significant transformation.
The transformation of public transport in the region has been a complex portfolio of business
change happening within an evolving legislative, political and operating landscape. It has involved
fundamental changes to the service procurement and delivery models, the bus network, bus and
train fleets, infrastructure, information, and fares and ticketing.
Most of the changes have needed one or more transition phases to enable a seamless move from
the old to the new systems, products and services. While some changes were immediate in nature
(such as roll out of new services), others have tended to last longer (such as interim fares and
ticketing solutions introduced to enable the transition to an integrated fares and ticketing system).
Each transition therefore had its own challenges, impacts, and management requirements.
Wellington’s experience in implementing fares and ticketing solutions is a practical example of
managing long-lasting transitions and can provide good insights into the challenges and
opportunities of such transitions. This paper discusses the principles, process and practice of the
fares and products transition.

Transportation Group 2019 Conference, Te Papa, 3-6 March 2019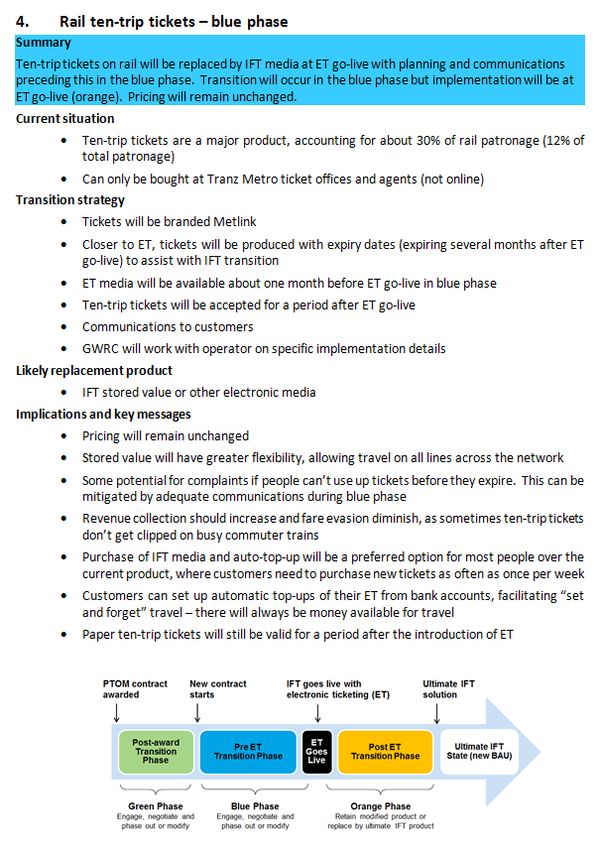
Fares and Ticketing Transition in Wellington        Reza Chalabianlou and Andrew G. Macbeth    Page 1

INTRODUCTION
A new package of fares and fare initiatives came into effect in the Wellington region on 15 July
2018. The package was introduced as part of a wider public transport transformation programme
that aims to change the face of public transport in the region. Implementation of the package
involved a number of major changes to fares and ticketing systems, processes and products.
These changes were needed to enable a smooth transition to a network-wide integrated fares and
ticketing (IFT) system, planned for 2021, by improving consistency and simplifying the complex set
of fare products that existed prior to the transition.
As part of this package, an interim bus ticketing solution (IBTS) was introduced in line with the start
of a new bus network and bus operating contracts in mid-2018. Implementing the new bus
network required a single network-wide electronic ticketing system with the capability of recording
information about origins and destinations of bus trips and enabling journey-based fare calculation
(free bus-to-bus transfers). Previously, four electronic card-based ticketing systems were in use (in
different parts of the region, with different operators), but the IBTS replaced these with the most
widely used one, Snapper, which had the required capabilities. From a customer point of view, this
means a more consistent fare offering, more flexibility and greater convenience as customers
would no longer need to carry different smart cards or pay extra to change buses or travel in areas
serviced by different operators. In addition, the data generated by IBTS provides a much better
understanding of when and where customers travel, allowing the Greater Wellington Regional
Council (GWRC) to better match demand for services with supply.
Simultaneously, a variety of operator-specific paper-based tickets were discontinued, and the
remaining paper tickets were replaced with consistently branded zone-based tickets. An off-peak
discount was introduced to spread peak demand and increase access to affordable services.
Cash tickets were retained at a premium price compared to smartcard fares to encourage greater
use of electronic ticketing, while recognising the needs of those who are least able to afford paying
upfront for multi-trip tickets (such as Snapper card or 10-trip ticket) or monthly passes. In addition,
concessions were introduced for tertiary students and people with disabilities and fare zone
boundaries were adjusted to improve consistency in fare charging across the network.
The package was a result of a comprehensive review of fares and fare policies and involved
intensive transition planning, public consultation and engagement with operators and a wide range
of stakeholders. While being transitional in nature, the process proved to be both challenging and
of great significance to public transport, as it had high public and political interest and high levels of
dependency with other projects in the region’s wider public transport transformation programme.
Despite the challenges, the changes have been implemented with general public acceptance. This
is partly a result of GWRC’s systematic, customer-focused approach to fares transition planning.
Implementation of the fare package has provided valuable insights into the challenges and
opportunities of transition, which are now being used to guide the next phases of the transition to
IFT. These are further discussed in the following sections.

WELLINGTON’S PUBLIC TRANSPORT SYSTEM
The Wellington region has a well-used public transport system, known as Metlink. The network
consists of more than 250 public and school bus routes, five rail lines and three harbour ferry
routes provided under contracts between GWRC and six operators (four bus, one rail and one
ferry). In addition, discounted taxi services provide travel support and assistance for people with
disabilities who have difficulty using conventional public transport services, under the government’s
Total Mobility scheme.

Transportation Group 2019 Conference, Te Papa, 3-6 March 2019
Fares and Ticketing Transition in Wellington            Reza Chalabianlou and Andrew G. Macbeth            Page 2

With a resident population of about 520,0001 and more than 38 million passenger trips per year2,
The Wellington region has the highest per capita number of public transport trips in New Zealand
(about 74 trips per person in 2017/18) and competes with large metropolitan areas in Australia3.
The bus network contributes about 64% (24.7m) of total annual passenger trips, rail contributes
about 35% (13.6m) and ferry to less than 1% (0.2m)4. Wellington also stands out in terms of mode
share of journey to work in New Zealand. Public transport carried about 17% of trips to work in
2013 (of those who travelled to work). This compares to 67% by car and motorcycle, 12% walk
and 3% cycle5. About 90% of Wellingtonians use public transport at least once over the course of
a year6.

FARES AND TICKETING IN WELLINGTON
Metlink fares are set and regulated by GWRC and implemented by operators of Metlink services.
Under current policies, most Metlink fares for bus and rail journeys are based on a radial fare zone
system, although a small number of tickets (including ferry tickets) are point-to-point (a flat fare
based on where the trip starts and finishes).
The zone-based fare system divides the region into 14 concentric fare zones radiating out from the
Wellington city centre (Zone 1) to Masterton in Zone 14, as shown in Figure 1. With this system,
fares are based on the number of zones passed through in a journey, including the zones where
the journey starts and ends.
Under the current fare zone system, travelling within a zone costs a fixed fare for one zone travel
regardless of distance travelled within the zone. The fares change once a fare zone boundary is
crossed. This method of fare calculation provides a proxy to distance travelled while avoiding the
pitfalls of a distance-based or flat fare system and is easier to understand and administer. Metlink
fares are also differentiated in various ways, including by:
       •   Types of passengers (e.g. adult, child, SuperGold or tertiary student),
       •   Methods of payment (e.g. cash or bus smartcard, rail ten-trip paper ticket),
       •   Time of use (e.g. peak and off-peak fares), and
       •   Frequency of use (e.g. discounted period passes).
Fares are based on adult smartcard fares as “base fares”. Cash fares are set at a higher rate
(about 25% more expensive) compared to the base fares, primarily to encourage smartcard use
which reduces fare evasion and improves data, and to reduce boarding times.
The new package of fares and fare initiatives incorporates new policies to improve access to
affordable travel for those most dependent on public transport; and encourage target behaviours of
more frequent use of public transport, more off-peak travel and greater use of electronic ticketing.
Concession fares and some multi-trip tickets or passes are accordingly priced at a discounted rate
to achieve these aims.

1
    https://profile.idnz.co.nz/greater-wellington
2   https://www.metlink.org.nz/customer-services/public-transport-facts-and-figures/patronage/
3   https://chartingtransport.com/2010/11/13/public-transport-patronage-trends/
4   https://www.metlink.org.nz/customer-services/public-transport-facts-and-figures/patronage/
5   https://profile.idnz.co.nz/greater-wellington/travel-to-work
6 http://www.gw.govt.nz/assets/Transport/Regional-transport/RPTP/WGNDOCS-1386111-v1-FinalRPTPdocWEBversion.PDF

Transportation Group 2019 Conference, Te Papa, 3-6 March 2019
Fares and Ticketing Transition in Wellington Reza Chalabianlou and Andrew G. Macbeth Page 3
Figure 1 Wellington fare zone system
THE CHANGING FACE OF PUBLIC TRANSPORT
The region has an ambitious plan to ensure its public transport remains the best in New Zealand
and contributes to the region’s economic growth, community wellbeing and environmental
sustainability. To realise this vision, most of the investment priorities over the last few years have
been towards modernising the public transport system, integrating the network and improving the
supporting infrastructure.
A major focus over the last decade has been on upgrading the Wellington commuter rail system
(including electrification of the network, new fleet, and upgrading tracks, stations and signalling).
During this period, the region has also gone through an extended process of redesigning and
transforming its bus network especially in Wellington city. The process has resulted in the
introduction of a new bus network in mid-2018, along with a number of enhancements since then;
to bed in the new network and improve performance of services. The new bus network has
changed to a hub and spoke system with an aim to reduce bus congestion in the city centre and
improve frequency and travel times. Nevertheless, fewer than 5% of bus journeys will require a
transfer.
Despite some public discontent over increased need to transfer and underperformance of services
in some locations, altogether, these improvements supported by Wellington’s culture of public
transport have resulted in an overall patronage growth of about 2% across the network between
2016/17 and 2017/18. While bus patronage has been relatively flat over this period, improvements
Transportation Group 2019 Conference, Te Papa, 3-6 March 2019Fares and Ticketing Transition in Wellington Reza Chalabianlou and Andrew G. Macbeth Page 4 to the rail network have resulted in over 3% annual growth in patronage and 5% growth in revenue. One of the impacts of growing rail patronage combined with a low rate of inflation and low fuel prices over the last five years (to mid-2018) was that GWRC had not increased fares for five years. To recoup part of the cost of the fare package, a 3% fare increase was introduced in July 2018. The transformation of public transport in the region has been a complex portfolio of business change that unfolded within an evolving legislative, political and operating landscape. GWRC adopted a phased and progressive transition approach to enable an orderly transition from the existing network and contracts to the new network, with limited disruptions for the travelling public. The transition was intended to enable users, operators and funding agencies to adjust their routines and budgets in response to the changes. Most of the changes have needed one or more transition phases to enable a seamless move from the old to the new systems, products and services. While some changes happened overnight, others have tended to last longer and involved multiple phases of transition, each having its own challenges, impacts, and management requirements. The rail services transitioned into the new operating environment (also known as Public Transport Operating Model or PTOM) with minimal disruptions from July 2016. Unlike rail, transitioning into the new bus network involved a range of intricate changes to current systems, processes, products and information and required some critical tasks to be completed in time for start of PTOM contracts. The new PTOM bus contracts started in three consecutive tranches with an intention to enable more effective use of resources and mitigate risks by making necessary adjustments through a progressive transition from earlier to later PTOM contracts. Improving the fares and ticketing system has been the next significant element in the modernisation of Wellington’s public transport system, with its own challenges and opportunities. Prior to implementation of the new fare package in July 2018, the fare structure was a complex blend of Metlink and operator-defined fares and products. This was largely due to the nature of the operating contracts prior to introduction of PTOM, where almost all services were operated under net contracts and operators collected all fare revenue. GWRC paid operators to provide specified services and was responsible for setting maximum fare levels for standard cash and multi-trip products. Public transport operators had their own fares and ticketing systems and therefore had their own operator-specific products. This resulted in more than 400 bus, rail and ferry fares and tickets, some being used for fewer than 10 trips each day, in comparison with four different bus operator smart cards that were used to pay for nearly 70% of bus trips, and monthly passes that were used to pay for over 40% of all rail trips, in 2016 (prior to the changes). GWRC in its current PT Plan has committed to reduce the total number of fare products in the lead-up to IFT through rationalisation of products and gradual transition towards a simpler set of fare products. The IFT system is intended to enable introduction of more innovative ticketing and fare products such as daily and weekly fare capping and a multi-modal payment method such as credit cards, debit cards and smart phones. Making the suite of fares available on a multi-modal payment method under IFT is expected to result in a higher proportion of electronic fare payment transactions, and potentially the phasing out of cash payments over time. THE FARES TRANSITION PATHWAY Phased delivery of a fully integrated national electronic fares and ticketing system (IFT) is currently planned for 2021. The ultimate IFT system as envisaged in the PT Plan has the following key characteristics: Transportation Group 2019 Conference, Te Papa, 3-6 March 2019
Fares and Ticketing Transition in Wellington        Reza Chalabianlou and Andrew G. Macbeth   Page 5

    •    Integrated fares and ticketing that supports integration of the network;
    •    Simple set of fares and fare products that are easy to understand for customers; and
    •    Standard set of fares and products that promotes fairness and consistency.
The IFT approach is not new and has been in GWRC’s policy agenda for the last ten years, but
has been deferred for several years for various technical, financial and political reasons largely
pending agreement on a nation-wide integrated ticketing system.
An integrated ticketing system is a prerequisite for delivery of integrated fares. In 2014, GWRC
developed a multi-year IFT programme to enable staged delivery of the IFT from 2016 following
commencement of the new rail contract.
Since then, GWRC has been working with the NZ Transport Agency (NZTA) and other partners
including the Auckland Transport and various regional councils on a nation-wide integrated
ticketing system. However, integrating ticketing component of the IFT was not able to be
implemented in time for the start of the rail contract in 2016. This national process has ultimately
resulted in decoupling of the regional ticketing component of IFT from the fares component, the
network and contract change process and other major initiatives.
The uncertainties regarding the timing for delivery of a national integrated ticketing system resulted
in delays to implementation of IFT, which needed to be addressed in the Fares and Products
Transition Strategy.

PRINCIPLES
The following principles were adopted by GWRC to assist in the development of a fares transition
strategy.
    1. Changes to fares and products will enhance customer experience, being easy to
       understand, logical, well-communicated and perceived as equitable
    2. Fares policies will help deliver Regional Public Transport Plan objectives including
       achieving patronage growth and meeting farebox recovery targets
    3. The fare structure will be rationalised and simplified through the transition
    4. New IFT fares and products will minimise negative impacts on revenue and costs for
       GWRC and NZTA
    5. The transition to a new fare structure will be easy to implement, and introduced in stages
       rather than as a single event
    6. A network-wide approach will be used to rationalise fares across all modes
    7. Emerging but proven payment and ticketing technologies will be considered in
       implementing IFT
    8. Existing free transfers on and between bus and rail will be retained through and beyond the
       transition to a new fare structure.
    9. The new fare structure and interim solutions will improve the quality of public transport data.
These principles were developed with the understanding that there would inevitably be situations
where change to a new fare regime and associated ticketing solutions would satisfy one or more
principles while not meeting others, and that any proposal (including the status quo) would conflict
with some principles; requiring a balanced approach to find an appropriate policy position.

TRANSITION APPROACH
Following Principle 5, GWRC adopted an incremental approach to transition as the most
appropriate way to manage and reduce risks prior to and following the introduction of an integrated
electronic ticketing system. With an incremental approach:

Transportation Group 2019 Conference, Te Papa, 3-6 March 2019
Fares and Ticketing Transition in Wellington Reza Chalabianlou and Andrew G. Macbeth Page 6
• Changes could be introduced on the bus and rail networks when convenient to each mode,
given that PTOM tendering had different timelines for bus, rail and ferry
• Customers would have more time to understand the proposed changes and to adjust their
ticketing choices accordingly
• GWRC would be able to more efficiently manage costs and risks, adjust funding (through
annual planning processes) and respond to customers’ needs and concerns
• It would be easier politically and operationally to rationalise ticket products incrementally,
with some rationalisation occurring through PTOM tendering, some at implementation of
electronic ticketing and further changes (such as fare capping, where customers pay no
more than a certain amount per day or week) could occur well after electronic ticketing “go
live”, when better travel data becomes available
• A simplified set of products could reduce complexity and ease implementation to network-
wide electronic ticketing, and
• Communications and marketing would be easier with an incremental approach.
The approach was also considered to be a more agile and adaptive to anticipate and manage risks
and hence to avoid a “big bang”, whereby all changes occur simultaneously and become hard to
manage. Breaking the change process into phases provided opportunities to:
• Prioritise changes to fare products based on their popularity and intensity of use;
• Standardise levels of discounts (particularly in regard to monthly rail tickets) in stages;
• Manage transition of low use but sensitive legacy concessions;
• Consult with operators and passengers to understand and manage expectations; and
• Learn from each stage to assist in planning and decision-making for subsequent
stages.
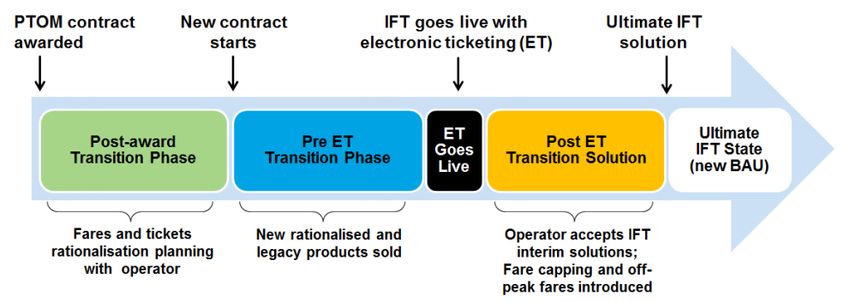
The transition approach for any product or group of products was proposed to consist of three main
phases (the “green”, “blue” and “orange” phases) with changes to happen at four significant
milestones, as shown in Figure 2:
(Green phase) (Blue phase) (Orange phase)
Figure 2 Fares transition approach
This approach aligned the fares changes with the changes to operators and the bus network and
involved a shift in responsibilities for provision and administration of fares and ticketing. The
green, blue and orange phases are distinguished by key events.
The green phase for rail started with the award of the PTOM rail contract in February 2016;
followed by the blue phase that started with the commencement of PTOM rail services in July 2016
and will continue until the orange phase will start with IFT electronic ticketing under the National
Ticketing Programme (NTP) in about 2021. Major changes to rail fare products in the blue phase
Transportation Group 2019 Conference, Te Papa, 3-6 March 2019Fares and Ticketing Transition in Wellington Reza Chalabianlou and Andrew G. Macbeth Page 7
started from mid-2018 when the fare package came into effect along with the PTOM bus contracts
and IBTS. Likewise, the green phase for bus started with the award of the PTOM bus contracts;
followed by the blue phase that started with the start of PTOM bus services (and IBTS) in 2018;
and will continue until the orange phase will start with IFT electronic ticketing under the NTP.
Business as usual (BAU) will then follow.
FARES TRANSITION STRATEGY
Following adoption of the transition approach, GWRC endorsed a Fares and Products Transition
Strategy in February 2016. The fares transition strategy set out high level guidance on how to
move from the existing set of fares and ticketing products to a simpler and more equitable system.
The objective was to gradually reduce the number of fares and ticketing products to enable
delivery of an IFT system across all modes (rail, bus and ferry). The transition strategy was
developed in the context of a number of evolving issues, including:
• Introduction of PTOM tendering for rail services (2015/16)
• Determination of the government’s national ticketing requirements for urban public transport
• Rapidly-evolving ticketing solutions internationally
• Nationally-led changes to SuperGold scheme funding; and
• Possibility of a need for interim ticketing solutions to manage the time lags between PTOM
rail go-live (July 2016) and various stages of bus PTOM go-live (scheduled at that time to
start from October 2017 but later deferred to mid 2018), and IFT go-live.
The evolving nature of the issues meant that the transition strategy would be iterative and dynamic,
with changes being made throughout the process as needed.
The primary focus of the transition strategy was to identify which fares, products, and product
groups needed to change to achieve the fares policies and IFT system, when they needed to
change, how they would change and the likely financial impacts on customers. The transition
strategy also provided a high level picture of the final state of products and the transition pathway
from legacy to ultimate state products, and identified how the fares and ticketing role of operators
would change. The high level strategy was also set to take a considered approach to risk and
customer impact by:
• Ensuring the majority of patronage was on products which would be retained or modified at
the start of IFT
• Allowing a staged transition to phase out the remaining products in the context of the new
PTOM tendering environment
• Simplifying the fares and ticketing structure through an incremental process; and
• Ensuring the stages and timing of transitions were based on an understanding of the
impacts on customers, GWRC, operators and other stakeholders.
METHODOLOGY
The following describes the methodology used to answer the core questions of the transition
strategy, i.e. which fares, products or product groups need to be changed; when and how should
the products change; and what would be the likely financial impact of the change on customers.
Grouping of fare products
The first challenge of the transition strategy was to reduce over 400 rail, bus and ferry fare
products down to a few. The first step was to aggregate products into groups of products to assist
with understanding fare products, developing the transition strategy and managing transitions of
individual products.
Transportation Group 2019 Conference, Te Papa, 3-6 March 2019Fares and Ticketing Transition in Wellington Reza Chalabianlou and Andrew G. Macbeth Page 8
For example, there were 73 different regular station to station rail ten-trip tickets including 29 child
and 44 adult tickets. In practice, all these regular ten-trip tickets could be dealt with the same way
in the transition strategy, so it made sense to call them one “fare product group” – rail ten-trip
tickets – rather than talking about the transition for these 73 fare products.
The regular ten-trip rail tickets were equivalent to bus smartcards and accounted for about 30% of
all rail trips, nearly 40% of commuter trips. Accordingly, they could not be withdrawn until IFT,
which would provide a proper electronic replacement for these tickets. This meant they could all
have the same transition path and would need to be retained through the blue phase until the start
of IFT.
In addition, there were various other ten-trip tickets including off-peak tickets. The nature of these
tickets was such that they needed different treatments and hence needed to be dealt with
separately and so put in different groups.
Likewise, there were a number of products which were similar in nature and provided similar
benefits, but were available from different operators or on different modes. Examples included
stored value cards, event tickets and school term passes, each of which became a fare product
group. This aggregation resulted in 64 fare product groups.
Criteria for transition
Four criteria were used to determine which fare product groups should be rationalised in which
phase. These criteria were mostly binary – products either do or do not meet each criterion. The
criteria are described as follows:
1 GWRC set the fares or supported the product
For many products, GWRC set the fare; otherwise operators set fares. Where GWRC set the
fare, it typically also supported the service financially and promoted the product on its website.
These products were typically zone-based and included many commonly-used ticket types,
such as ten-trip rail tickets, bus stored value cards, rail monthly passes and cash fares on bus
and rail.
Many products which met this criterion would need to be modified to be compatible with IFT
and provide for the changes as a result of the new contracts, new bus network, and possible
consolidation of tickets. These transitions would usually occur in the blue or orange phases.
This criterion was not as “black and white” as the others, and could be partially met. Products
which did not meet or only partially met this criterion were likely to be managed during the
green phase.
2 Concept will be supported by GWRC at IFT go-live
Products (or at least the product concept, such as cash, stored value media) that could be
supported at IFT go-live were likely to be supported in the ultimate IFT system. Where GWRC
set the fare, the product concepts were likely to be supported in the ultimate IFT system, and
would be available under IFT, although they would need to be modified in the orange phase.
Products that were supported by GWRC at IFT go-live but GWRC did not set the fare or
support the product could typically be managed during the blue phase.
3 Product has medium or high patronage
Patronage estimates were generated from available data but were imprecise as there was
incomplete data for many services, especially for the commercial services (i.e. services
provided by operators without subsidy) where no changes to fares and ticketing were
anticipated under IFT. Data availability and reliability were also poor for some of the
concession and operator-specific products.
Transportation Group 2019 Conference, Te Papa, 3-6 March 2019Fares and Ticketing Transition in Wellington Reza Chalabianlou and Andrew G. Macbeth Page 9
Notwithstanding some of these data quality issues, products were defined as having medium
or high patronage where they had greater than 75,000 trips per year (equating to about 200
trips per day, on average). Products with less patronage than this were considered to have
low patronage and should generally be phased out, in the interests of producing a simpler,
fairer fares and ticketing system. Most low-patronage products to be phased out were to
undergo transition in the green phase.
Changes to products with medium or high patronage were more likely to result in more public
concern and consequently needed to be addressed later in the transition process (blue or
orange phases), to minimise impacts.
4 Product has high discount
Products with high fare discounts relative to bus stored value cards or the ten-trip rail ticket
would be difficult to remove, yet the level of discounting meant that other products would cost
more than they might otherwise, to meet farebox recovery targets. The threshold chosen for
this criterion was 15% (the discounted fare was more than 15% cheaper than the base fare).
However, child fares, with a 50% discount off the adult smartcard fare were endorsed as a
standard fare.
The transition approach identified equity as a principle. This meant that products with high
discounts needed to be considered for rationalisation in the green phase, although if they had
high patronage, they would be difficult to remove and should be left to the blue phase. In the
interim, the annual fare review process needed to be used to better align the fares.
Changes to products with high discounts were more likely to result in more public concern and
consequently needed to generally be addressed later in the transition process (blue or orange
phases), to minimise impacts.
Decision table
A decision table was developed as a tool to help determine which transition phase was appropriate
for each product or group of products.
For each product, each criterion could be either “yes” or “no” (or “part” for the first criterion, which
can be partially met). Accordingly, there were 24 possible permutations of “yes”, “part” and “no” for
the criteria for each product. Eight of these permutations were not feasible (for example, GWRC
would not support a concept under IFT (Criterion 2) if it didn’t already support the concept
(Criterion 1)), leaving 16 feasible permutations. Each permutation was considered to determine
the preferred phase for dealing with products in the context of the four criteria. The outcome was a
decision table, illustrated in Figure 3.
4-Feb-16
GWRC sets fares or supports the
Yes Yes Yes Yes Yes Yes Yes Yes Pa rt Pa rt Pa rt Pa rt No No No No
product
Concept will be supported at ET go live Yes Yes Yes Yes No No No No No No No No No No No No
Medium or high patronage (>75,000) Yes Yes No No Yes Yes No No Yes Yes No No Yes Yes No No
High discount (>15%) Yes No Yes No Yes No Yes No Yes No Yes No Yes No Yes No
Green Pha s e Product Groups 0 0 5 14 0 4 11 34
Bl ue Pha s e Product Groups 2 3 3 1 3 12
Ora nge Pha s e Product Groups 3 3 6 6 18
64
Figure 3 Decision table for determining transition phase for each product group
Transportation Group 2019 Conference, Te Papa, 3-6 March 2019Fares and Ticketing Transition in Wellington Reza Chalabianlou and Andrew G. Macbeth Page 10
This means that if all four criteria were “yes”, officers recommended that the product be managed
during the orange phase, at or shortly after IFT go-live. Three products (bus transfer and
SuperGold concessions for bus and rail) had this permutation of criteria and would be dealt with in
the orange phase. In fact, for all 18 products where both of the first two criteria were “yes”,
transition was recommended for the orange phase and was thus independent of patronage and
discount level (criteria 3 and 4).
There were eight products where the first criterion was “yes” and the second was “no”, product
rationalisation would occur in the green or blue phase, depending on the patronage and discount.
High patronage and/or high discount meant that there would be more social impacts and thus more
time would be needed to transition, so this work would occur during the blue phase. Accordingly,
the transition would occur closer to IFT go-live, reducing impacts.
Where the first criterion was partially met and the second was not met, products were managed in
the green phase (19 product groups), unless they had both medium or high patronage and high
discount (one product), in which case they were managed in the blue phase.
The last four permutations had “no” for the first two criteria. They were not standard Metlink
products and did not fit the IFT model, so needed to be phased out. There were three products
which did not meet the first two criteria and which had medium or high patronage. Under the
remaining two permutations (“no” to each of the first three criteria), four products had high
discounts and 12 had low discounts; these needed to be managed during the green phase.
The decision table showed that most products in the green phase were not supported or were only
partially supported by GWRC; the ticket concepts were not supported at IFT go-live and they
mostly had low patronage and low discounts.
Most products in the blue phase were at that time supported by GWRC but the concept would not
be supported in IFT, plus they had either medium or high patronage or high discount.
Products in the orange phase were supported by GWRC or GWRC set the fare and their ticketing
concept would be supported at IFT go-live. Figure 4 shows the distribution of products by mode
and phase, in addition to estimates of patronage.
4-Feb-16
Mode Green Phase Blue Phase Orange Phase All phases
No. of % of All No. of % of All No. of % of All No. of % of All
Products Patronage Products Patronage Products Patronage Products Patronage
Rail 13 0.4% 7 36% 4 3% 24 40%
Bus 15 0.3% 4 3% 6 56% 25 59%
Bus/Rail 0 0.0% 1 0% 5 0% 6 0.4%
Ferry 6 0.0% 0 0% 3 0% 9 0%
Total 34 0.7% 12 39% 18 59% 64 99%
Figure 4 Product transition summary by mode and phase
It can be seen that the 34 product groups proposed to be in the green phase had low patronage (a
total of less than 1% of known patronage). For the 12 products in the blue phase (mostly rail),
patronage amounted to 39%. Products to be managed during the orange phase (18) accounted
for 59% of patronage.
Product summary sheets
Some of the more significant rail fare products were described in the Transition Strategy, in various
“product summary sheets”. Because the rail PTOM contract was imminent, transition of fares and
products needed to be considered earlier than for bus. Accordingly, product summary sheets for
major rail families (collections of similar ticket groups) in the green and blue phases were prepared
Transportation Group 2019 Conference, Te Papa, 3-6 March 2019Fares and Ticketing Transition in Wellington Reza Chalabianlou and Andrew G. Macbeth Page 11
and provided in the strategy document. Other product family summary sheets were scheduled to
be prepared as needed.
Figure 5 shows an example of a product summary sheet that describes the current situation,
outlines the transition strategy and likely replacement product and impacts and the key messages
for communication to customers.
Figure 5 Example of a product family summary sheet
Transportation Group 2019 Conference, Te Papa, 3-6 March 2019Fares and Ticketing Transition in Wellington Reza Chalabianlou and Andrew G. Macbeth Page 12 IMPLEMENTATION To implement the transition strategy, GWRC developed Fare Media Transition Plans (FMTP) for bus and rail, which were also included in the operator contracts. These documents provided the basis for GWRC to work with the operators through the transition to IFT and included the Metlink fare schedule, Metlink Fares Manual, Metlink Conditions of Carriage and other operational terms and conditions relating to Metlink fares, ticketing and ticket media. GWRC worked closely with the incoming bus operators and Snapper and developed detailed instructions for operator staff training. Further materials were developed and published as part of a fares and ticketing communication plan to ensure that customers were informed of the changes in a timely manner prior to and through the course of the new fares initiatives. Communication has been a critical element of the transition. Customers were informed of the changes to products and fares prior to the changes via multiple channels. Appropriate timing for communication and the information content varied depending on the product and availability of the substitutes or alternatives, the audience (market segment that would benefit or be disadvantaged by the changes), and customers’ dependency on the affected products. New fares, concessions and products generally required a lead time of some months to effectively communicate with customers. GWRC used marketing ambassadors in some areas or on some services to provide assistance to customers where needed. CONCLUSION The transition strategy aimed to simplify and standardise the fares and ticketing system in the lead- up to an electronic Integrated Fares and Ticketing system, planned for 2021. The final system will need to be easily understood and able to be used across all public transport modes (bus, rail and ferry). At this stage of the transition (about three years since the start), more than half of the initial 64 fare product groups have been withdrawn. The transition process has resulted in a much more user- friendly, equitable and consistent fares and ticketing system. The bus network is now equipped with a single electronic ticketing system, which generates improved bus journey data, provides a more convenient payment option for most customers and enables free transfers between buses across the network. Electronic ticketing on rail will further simplify and standardise the fares and ticketing system. The transition has required a rigorous technical approach accompanied by a robust political decision-making process. It has been an iterative process requiring the balancing of many factors and perspectives, recognising differences and commonalities in context and able to respond to uncertainty. Public consultation on fares through the transition process has highlighted the high level of public and stakeholder interest in fare equity between modes and various user groups, including the transport disadvantaged. The success of the transition has to a large extent been dependent on early engagement with stakeholders and clear communication of the purpose and anticipated impacts of the changes to affected users. There will be no standard way to implement a major transition; each will require its own approach, processes and practices depending on context. Wellington’s experience in managing its fares and tickets transition may provide good insights into a suitable approach. Transportation Group 2019 Conference, Te Papa, 3-6 March 2019
You can also read