CAPITAL MARKETS DAY 2020 - Media and Games Invest plc
←
→
Page content transcription
If your browser does not render page correctly, please read the page content below

CAPITAL MARKETS DAY 2020

Disclaimer

Cautionary note regarding forward-looking statements

This presentation contains forward-looking statements. These statements are based on current estimates and
projections    of     the    Board    of     Executive     Directors    and     currently   available    information.
Forward-looking statements are not guarantees of the future developments and results outlined therein. These are
dependent on a number of factors; they involve various risks and uncertainties; and they are based on assumptions
that may not prove to be accurate. Such risk factors include those discussed in Opportunities and Risks on pages 4 to
16 of the Company Description (Link: https://mgi.group/wp-content/uploads/2020/09/Media-and-Games-Invest-plc.-
Company-description-secure.pdf). MGI does not assume any obligation to update the forward-looking statements
contained in this presentation and beyond the legal requirements.

I.     Introduction
       I.     Overview MGI
       II.    Market Overview
       III.   Strategy
II.    Gaming
       I.     Overview
       II.    Portfolio Impressions
       III.   Community Impressions
       IV.    Review 2019 an Q1 2020
       V.     Preview 2020
III.   Media
       I.     What we do
       II.    Buy & Build
       III.   Outlook
IV.    Financials
Todays presenters

        REMCO WESTERMANN,
                                                                                   PAUL ECHT,
        CEO & Chairman of the Board
                                                                                   CFO
        ▪     Manager, entrepreneur & investor; more than 25 years                 ▪      Finance Manager with more than 10 years experience in the
              experience in various leadership positions                                  tech and finance industry
        ▪     Founding, reorganizing and growing various companies in the          ▪      Previously; UniCredit Bank and Shopgate Inc., M.A. in Finance
              new technologies and media sector, Sonra, Bob Mobile/ Cliq                  and Bachelor of Laws (LL.B.)
              Digital, MSc at Erasmus University, Rotterdam

                                                                               IONUT CIOBOTARU,
        JENS KNAUBER,
                                                                               CPO
        COO
        ▪     More than 10 years experience as manager in the gaming           ▪         founded the mobile monetization platform PubNative and has
              industry – over 300 published games                                        15+ years of experience in the ad-tech industry, previously
                                                                                         working for Applift, Weebo and EA.
        ▪     Held a series of leadership positions at Hamburg publisher dtp
                                                                               ▪         Holding a degree in Psychology and a M.D. in General Medicine.
Building a Global Games and Media Powerhouse
Leveraging the value chains of gaming and media; low risk, continues & profitable growth

                                                  Fast growth                             combining M&A and organic growth

                                                  Profitability                   focus on high margin and recurring revenues

                                                  Tech focus             technology as a driver of success; USP’s and efficiency

                                                 Synergy focus                integrating acquisitions & optimizing value chain

                                                 Low risk focus              no new game dev., focus on ROI, distressed M&A

                                               Shareholder value            mix of own cash-flow, listed equity and non-equity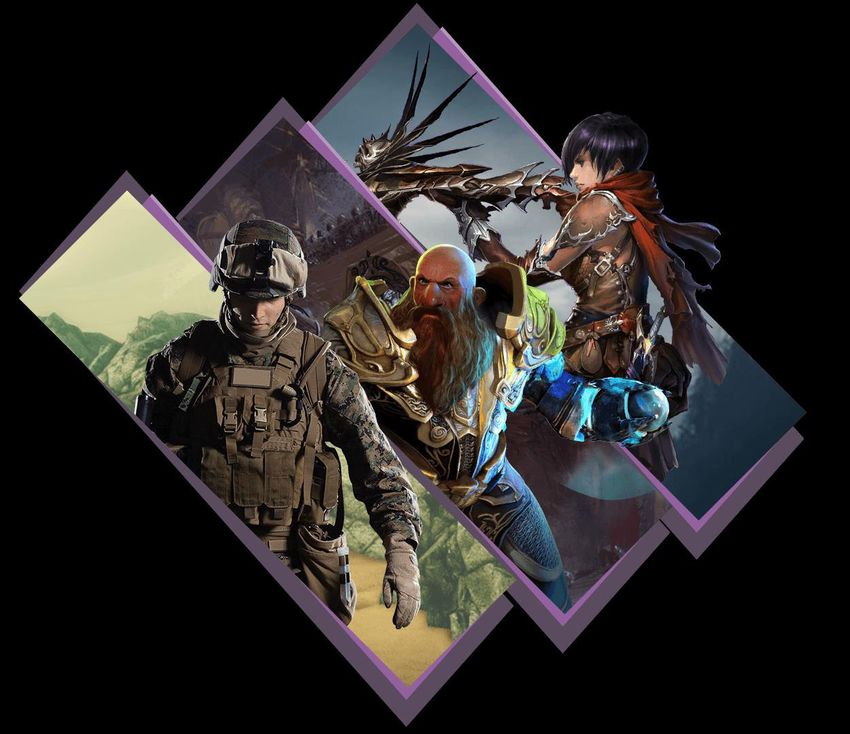
MGI at a Glance
Substance and access to capital markets; access to millions of customers

                           GAMING                                                              MEDIA
                       2012     first acquisition gamigo
                                                                               2016     first acquisition seven games media

                       2018     MGI acquires gamigo
                                                                               2019     Entry of ad-tech acquiring Applift & Pubnative

                       20+      M&A transactions
                                                                               10+      M&A transactions

                                                                               EUR 40m Revenues 2019
                       43m+      Revenues (2019)
                                                                               EUR 3m Ebitda 2019
                       12m+      Ebitda (2019)

                                                                               350+     Employees
                       300+     Employees

                                                                               4k+ Direct integrations & SDK apps
                       25+    MMOs (Massive Multiplayer Online games)          5b+ Monthly Ads delivered
                       5,000+ Casual games                                     Top Fortune 500 Advertisers and Global digital Brands

                       5,000,000+ Monthly active players                       +2bn monthly video views
                                                                               +750m subscribers across all channels

                                                   +80m revenues and +15m EBITDA
                  Media and Games Invest is listed at Frankfurt Stock Exchange with a Market Cap of more than +100m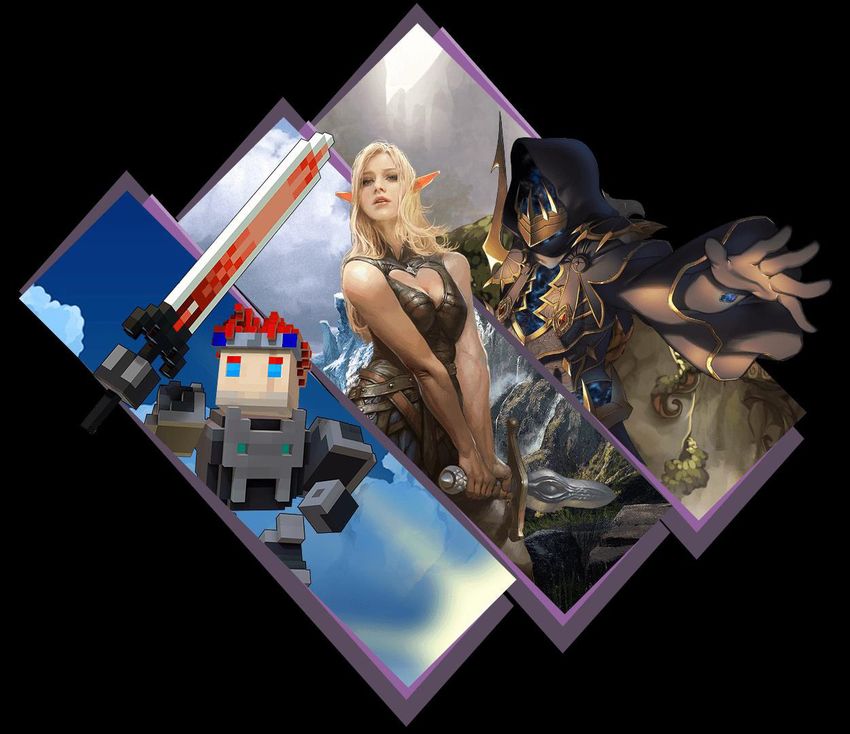
Strong Team

  Board of Directors                                                    Top Management Team

   Tobias Weitzel           Elizabeth Para           Remco Westermann    Paul Echt   Gary Coffey   Jens Knauber   Stefan Rascher
   Non-executive Director   Non-executive Director   Chairman of the     CFO         COO           COO            CSO
                                                     Board & CEO
MGI GROUP: acting worldwide
We serve our gamers and customers worldwide with +20 local offices

                              Europe
                              ○   Berlin
                              ○   Cologne
                              ○   Darmstadt
North America                 ○   Hamburg       Asia
○   Austin                    ○   Istanbul      ○   Beijing
○   Carlsbad                  ○   Moskow        ○   Shanghai
○   Chicago                   ○   Tel Aviv      ○   Seoul
○   New York
                                                ○   Singapore
○   San Diego
                                                ○   Tokyo
○   Seattle
○   Washington DC

          LATAM
           ○ São Paulo
           ○ Buenos                           Oceania
             Aires                            ○ Sydney
           ○ Mexico City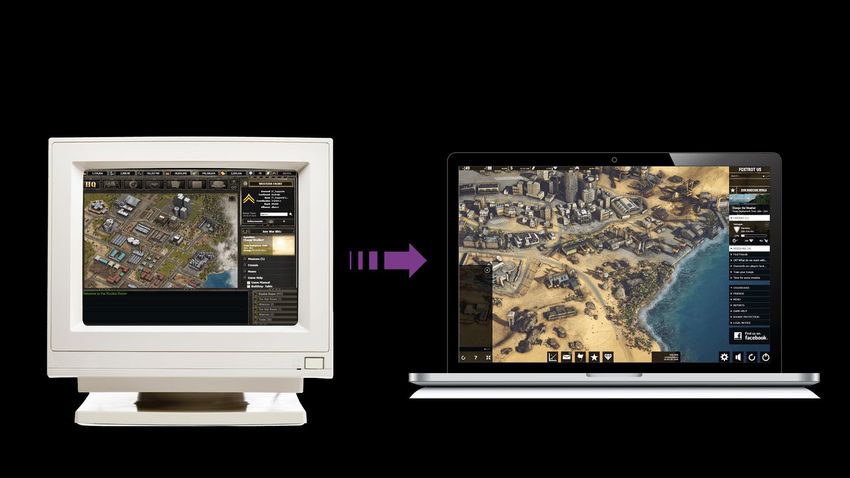
Market overview
Gaming: a substantial growth market
Largest entertainment market; continues fast growth

                                                Games market; USD +150bn                                                      Megatrend: More Leisure Time
                   200                                                                                                        ▪   Favored form of entertainment;
                                                                             CAGR +11%
                                                                                                                      180.1       interactive, rewarding, social
                   180                                                                                                        ▪   Gaming market is bigger than the
                                                                                                              165.9
                   160                                                                                                            market for books, music and films
                                                                                                      151.9
                   140                                                                        137.9
                                                                                                                              Mass Market
                                                                                      121.7
     USD billion

                   120                                                                                                        ▪   More than two billion players worldwide
                                                                              106.5
                   100                                                93.1                                                    ▪   42% of all Germans are playing, 41% of
                                                      84.8                                                                        whom are female, 29% over the age of 50
                    80                    76.5
                              70.6
                    60                                                                                                        Growth opportunities
                                                                                                                              ▪   Fragmented market
                    40
                                                                                                                              ▪   Driven by hits, some with billions in
                    20                                                                                                            revenues, but also failures
                                                                                                                              ▪   High growth and high margins
                       0
                              2012 2013 2014 2015 2016 2017 2018E 2019E 2020E 2021E                                           ▪   Market consolidation, numerous M&A
                                                                                                                                  candidates
                                 Console Gaming                                PC Games               Mobile Games
                   Source: Newzoo - Global Games Market Report 2020
Media: a substantial growth market
Monetizing digital media, advertising products and services: a very fragmented large market
Online advertising; USD +290 Mrd.
Megatrend: programmatic ads
CAGR +16% ▪ Digital advertising has bypassed offline advertising
434 ▪ Programmatic exchanges and bidding are more
401
367 efficient and winning
330
294 Fragmented Market
258
178 ▪ Fast growing number of channels, apps and players
USD billion
▪ From managed to self-serve; giants (Google, Tencent,
Facebook) and many others
Growth opportunities
▪ Fragmented market
2017 2018 2019 2020E 2021E 2022E 2023E ▪ Driven by technical change and optimization; AI,
programmatic and tracking
Search engine advertising Banner advertising Social media advertising
▪ High growth and good margins
Video Advertising Online classified ads
▪ Market consolidation, numerous M&A candidates
Source: Statista, April 2019; Digital Market Outlook / worldwide market for online advertisingMedia & Games: synergetic sectors
Higher efficiency, larger part of the value, more data, faster growth
Value-Chain optimization: cheaper user acquisition
▪ Scale advantage with ad-buying
▪ Additional margin from ad-buying stays in-house
▪ Better data to optimize ad-buying
Games ▪ Don’t need huge in-house advertising team: know-how
sharing
item sale Value-Chain optimization: more ad-income
media for user user playing
acquisition acquisition user selling ▪ Direct to advertiser sale: higher price per ad
advertising ▪ Additional margin from ad-selling stays in house
ads in games
▪ Better fill-rate
Media business: profitable 3rd party business
Media ▪ Clear USP by offering unique first party ads in games
▪ Substantial additional ad-purchase budget enables
volume guarantees and monetization of remnant
▪ Improved optimization: joint customer data platform,
optimized targetingStrategy
MGI “buy, integrate, build & improve”
Consequently implementing this strategy since 7 years, executing 30+ M&A cases

                     Buy                                   Integrate                     Build & Improve

                      =                                        =                                =
             Market consolidation                      Restructuring &                 Organic sales growth
                  via M&A                             realizing synergies

         ▪   M&A focus distressed &               ▪   Cost efficiency; unified     ▪   Product and technology
             in efficient companies                   management structure             improvements
         ▪   Also M&A of accretive                ▪   Technical integration; one   ▪   Increase number of users
             technology, product &                    platform & one cloud             and customers
             customer bases.
                                                  ▪   Cost savings; cancel or      ▪   Internationalization
                                                      renegotiate contracts,
                                                      merge offices
MGI “buy, integrate, build & improve”
30+ Company and asset purchases: 20+ in gaming, 10+ in media.
Pipeline Games M&A:
M&A # M&A Cumulative
process candidates Revenue
status (mEUR)
Buy Shortlist >40 > 400
Contacted >17 > 200
In talks 7 > 100
=
Pipeline Media M&A:
Market consolidation
M&A # M&A Cumulative
via M&A
process candidates Revenue
status (EUR)
Shortlist > 27 > 500
Contacted >9 > 300
In talks 5 > 100MGI “buy, integrate, build & improve”
Restructuring and thereafter integration leads to fast turn-arounds and use of synergies
Synergies Games:
▪ Joint customer base: upselling & lifetime cycle
▪ Customer acquisition: ad-efficiency
Integrate
▪ Datacenter -> cloud
▪ Integration of backends -> 1 backend
▪ Joint customer care & customer management
▪ Team optimization & know how sharing
Gaming Unit
▪ Overhead synergies (management, offices)
=
Restructuring &
realizing synergies Synergies Media:
Media Unit
▪ Joint customer base: upselling
▪ Customer acquisition: global sales team
▪ Datacenter -> cloud
▪ Tech-integration -> 1 united tech-stack
▪ Joint operations, supply development
▪ Team optimization & know how sharing
▪ Overhead synergies (management, offices)MGI “buy, integrate, build & improve”
Focus on quality, increase of customer base, and product innovation drives organic growth
▪ Exciting new content, updates for games portfolio
▪ New game launches (licensed) and sequels (in-house)
Build & Improve
▪ Improving the games; bug fixing, active community
management
▪ Increasing new users and paying users
▪ Internationalization
=
▪ Active sale and upselling of products and services
Organic sales growth globally
▪ Increasing and training sales and operations teams
▪ Product innovation; eg social media panel, header
bidding, digital out of home, connected TV, HyBid SDK
▪ Scaling technology, supply and demand position within
programmatic, supporting migration to SaaSExample 1: technology optimization
More cost control and efficiency through the use of state-of-the-art technology
Case study:
Trion Worlds technology costs
543
122
Expected
= 421
savings in
2020
174 130
Sep 18 Sep 19 Sep 20
Monatliche Ausgaben
Monthly spending Monatliche Leasing
Monthly tech Kosten
debt repayment
Data centers: Use of Cloud Technology : Result:
High fixed costs • Variable cost depending on traffic • Massive cost savings
High personnel costs • Scalable • Variable costs
Capital-intensive investments • Low personnel costs • Reduced risk
• No capital-intensive investments • Reduction of downtimesExample 2: M&A case study Trion Worlds
Preference for distressed asset deals; usual pay-back in less than 24 months
Optimization of the rentability Optimization of a s s e t s Organic growth
First
Balanced
1 Use synergies 1
monetization
1 Relaunches 12 months
post M&A
2 Improve technology 2 Community Management 2 Sequels
Revenue:
19 Mio. €
3 Internationalize 3 Content updates
INVESTMENTS IN GAMES
€3.4m
EBITDA:
Acquired for
€8,5m INCREASE IN PROFITABILITY 7.2 Mio. €
in October 2018
Trion Assets acquired Investment in content, sequels, advertising and Result: strong cashflow and
for €8.5m in oct. 2018 Internationalization + integration into gamigo. substantial increase in value
€ 3.4 Mio. invest Payback < 24 monthsExample 3: Hyper Casual Games value chain synergies
Games and media combined: optimizing the value chain
Example Hyper-Casual Games
Games user acquisition playing user ad-income Break-even -> 22.5 ad-views
only
€ 0.15 CPI € 2 CPM
versus 300% better efficiency
Games
& Media user acquisition playing user ad-income Break-even -> 7.5 ad-views
€ 0.10 CPI € 4 CPM
Hyper casual games, important: Result: much higher
Huge efficiency gain between - to acquire players as efficient as possible and
‘games & media’ versus ‘games efficiency with in-house
- to monetize players (via ads only) as good as media
only’ possibleExample 4: data optimization
Unified MGI group customer data platform for more efficiency
Data are the ‘fuel’ of programmatic advertising: Huge efficiency improvements are possible with:
Targeting each person with the - to bid for the ads that reach the right target group - more data volume
right ads is a challenge and - to enrich basic data with additional info’s - and combining data from various in-house
decides about efficiency. - to analyze and optimize efficiency sources with external data
- and data science know-how and AI skillsI. Introduction
I. Overview MGI
II. Market overview
III. Strategy
II. Gaming
I. Overview
II. Portfolio Impressions
III. Community Impressions
IV. Review 2019 an Q1 2020
V. Preview 2020
III. Media
I. What we do
II. Buy & Build
III. Outlook
IV. FinancialsGlobal gaming brands Unified under one umbrella
Gaming at a glance
Leading publisher of free2play games in the western market
Strong Portfolio Active Community Increasing revenues
More than 25 MMO
More than 5 Million
Games distributed via Run rate +50 Million
Monthly Active Users
own gaming Euros revenue
(MAU)
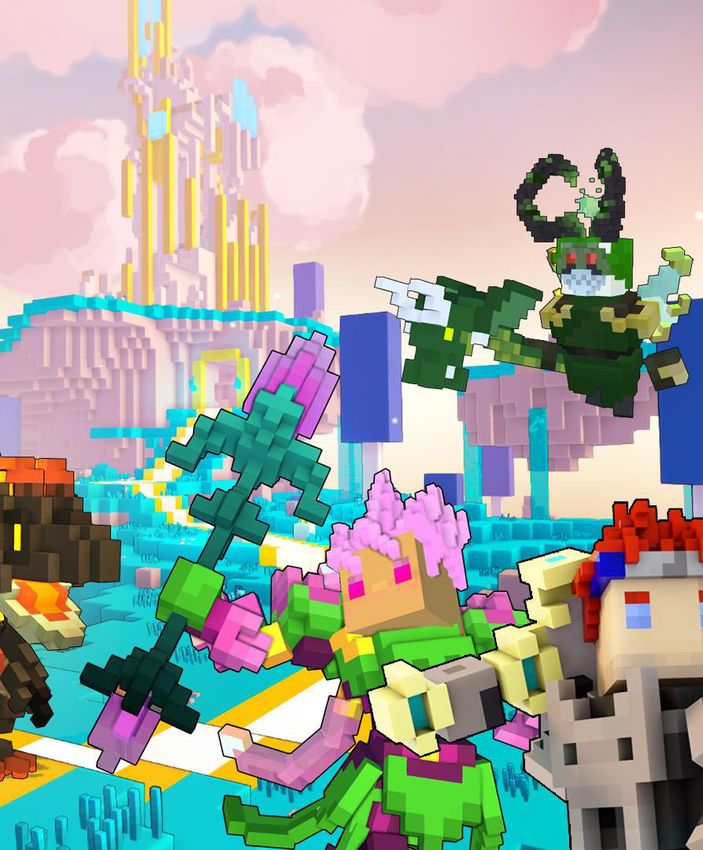
platformsPortfolio Impressions
Games Portfolio
Strong variety of genres

❖ Unique MMO-Shooter in Voxel Art
❖ Player map creator enables unlimited content

❖ Generated more than 180m Euro lifetime Revenue
❖ Unique competitive and strategic gameplay

❖ MMORPG in a timeless Anime style
❖ Average Customer Lifetime above 5 years
Games Portfolio
Strong variety of genres

❖ Turn based Strategy to play in a web browser
❖ Localized in 16 different languages

❖ Above 100m Euro lifetime revenues
❖ Battlepass is challenging players on a monthly base

❖ Weekly guild wars to conquer the castle to provide the king
❖ Countless hours of gameplay content due to level cap of 185
Community Impressions
Community building
Loyal and pro active community

             Dedicated Team of
            Community Managers

                Dedicated
            Social Media Team

          Daily Game Events and on
                 Social Media
Social Media Activity
More than 8 million Monthly reach of more
More than 350 weekly
Followers on Social than 30 million users
posts on Social Media
MediaCommunity Events
Own Video Award Best picture Contest Dance Contest
Bee Racing Cosplay Events Cookie ContestReview 2019 and Q1 2020
Desert Operations: Graphic and UI Update

                         91% of New Players      Registrations        Reg2Pay
                         using new UI Design   increased by 33%   increased by 9%
Trove Expansion: Into The Deep 19% increase of 14% increase of 15% increase of Paying Customer ARPU Net Revenues
ArcheAge: Shadows Revealed

 ❖ New Business Model
                             ❖ DAU doubled since its launch
 ❖ Major graphic refresh
                             ❖ Over 300.000 units sold of Unchained since ist
 ❖ Massive content update      launch
Game Updates in 2019/Q1 2020
New game mode – Battle Royale Enhanced PvP System New Battlepass Seasons
Brand New Maps Updated Gear Crafting New character class (Rock Star)KPI Highlights 2019
Accomplished
4.2 mio More than
over
words 1.200
1.100
localized Influencer made
game
for game updates „Let´s Play´s“
maintenancesCustomer centric approach strengthen in 2019
Partnering with market leaders
Group wide implementation of world leading
customer support solution
Increasing social media awareness by using
innovative software solution
Full platform integration of customer targeting
communication toolOutlook 2020
May 2020 - Trove

       Launch of the new Expansion
             „Trove – Delves“
June 2020 - ArcheAge Launch of the new Expansion „Archeage – Garden of the Gods“
Upcoming Game Updates in 2020

        New Battlepass       Level Cap raise    Level Cap raise

      New Character Class   Class Rebalancing    New Tutorial

and many more…
2020 - Further invest in growth
Working with
Launching new Extending to new Process
strong partners in
Games platforms automation via AI
new territories
Inlicensing strong Outlicensing owned Expanding Increase efficiency
IP´s IP´s customer reachI. Introduction
I. Overview MGI
II. Market overview
III. Strategy
II. Gaming
I. Overview
II. Portfolio Impressions
III. Community Impressions
IV. Review 2019 an Q1 2020
V. Preview 2020
III. Media
I. What we do
II. Buy & Build
III. Outlook
IV. FinancialsCompetitive environment in the ad-tech industry More and more advertising channels and parties. However invests in technology and less venture money lead to market consolidation. Scale matters !
Opportunity in media
                  PAID MEDIA AND THE OPEN INTERNET        MGI Value Chain

                                                     Advertiser        Service Layer

                                                        DSP         Technology Layer

                                                       Data               Data Layer

                                                        SSP         Technology Layer

       Media and Games Invest
                                                     Consumer          Content Layer
What we do in Media
Verve Group is a data-first brand performance ad platform connecting brands, advertisers and
publishers to people in real time
Full Stack Advertising Leadership
Platform
Brand – Top Fortune 500 Advertisers Strong Executive Global Team
Performance – Top 500 Global Digital Brands over 350 employees
Publishers – Top 100 in the App Stores 20+ Worldwide Offices
Global Marketplace - in 20 Countries
Influencers Platform - Full and Self Service
TECH &
ADVERTISER PUBLISHER
DATAVERVE GROUP: Fortune 500 Advertisers trust us
Top Game Publishers
OFFLINE BRANDS ONLINE BRANDS
Agencies Retail+Automotive Brand Gaming Banking Sharing EconomyVERVE GROUP: We work with top Publishers
Long term premium publisher partnerships
Social Games Entertainment Utility
Bigo Easybrain Flipboard Meitu
- 350M MAU - 500M downloads - 145M reach - 6B+ posts/monthAd Units
Drive revenue & engagement with support for all major ad formats
Native Display Video Rich MediaCase Study
RESULT:
590k+ 166k+ $0.45 3-Day Avg.Post
Exposure - 1st Visit
total visits incremental visits CPIV
OBJECTIVE TARGETING STRATEGY
Drive awareness, foot-traffic & sales • Geofenced all Burger King locations in
for the Winter Whopperland • the US.
promotional peel off game during the • Verve Activate Custom Audiences -
2019 Holiday Season. Prove results Burger King Loyalists & Competitive
with a 3rd Party Foot-Traffic Study. QSR Loyalists.
• Recent Past Visitors of competitive
burger QSR’s.
CREATIVE APPROACH
Standard banners with a Tap to Map function were designed by Verve Foundry™;
which automatically detected the user's current location and provided directions to
the closest Burger King restaurant.Case Study
RESULT: 984 518 2.3X 2.2X
Trade opens Trade opens Higher trade opens Higher trade opens on
on iOS on Android on iOS during peak Android during peak
trending season trending season
GOAL STRATEGY
• Acquire high value users who will trade • For each publisher, the conversion funnel at each step was
open with a minimum deposit of $200. analyzed i.e. registration, deposits, trade opens. Those who
performed below the set KPIs were automatically eliminated
• Optimize campaign towards a CPA pricing while high performing publishers were prioritized.
model with trade open - i.e. when someone • Leveraging an increase in cryptocurrency global search trends
opens an account and makes the minimum assisted in a significant scale in trade opens over a 2-month
deposit - as the payable action.
period.
“Through our partnership, we were able to acquire the right type of customers according to our KPIs.
Their dedicated support, expertise and agility in execution makes them one of our most valuable
partners.” - Nir Smulewicz , VP Marketing at eToroCase Study
50% of Influencers and
RESULT: 67 2.4M 77% of views
Influencer campaigns Views achieved booked via adspree
OBJECTIVE STRATEGY
• Reduce media costs in media and • Centralize booking of Influencers
Influencer buying across video and social media
channels, increasing negotiation power
• Create cost efficient video assets Influencer booked via Adspree
via internal production resources. • Combine skillsets of Gamigo internal
marketing graphics team and
Mediakraft production capabilities
• Constantly expand synergies in 2020
APPROACH
Sharing gamigo and Adspree resources, contacts and market insights, leading to an
ever growing Influencer database and long term partnerships
Involving Mediakraft production teams to create compelling spots and trailers
Video spot created by MediakraftBuy & Build
MGI GROUP: Market Consolidator Media
Acquiring and Integrating Media Companies in Verve Group

                 MGI                                       Brand and
                                            Advertiser     Performance
                                                                            Service Layer

          2020

          2019                                 DSP         Demand        Technology Layer

          2019
                                              Data         DMP                 Data Layer
          2019

          2019
                                               SSP         SDK Base      Technology Layer

          2017

          2016                              Consumer       Influencer       Content Layer
Outlook
Media
How the Gaming Sector Benefits From the Media Sector and Vice Versa

Inorganic growth
▪ M&A
▪ Synergetic Businesses
▪ Cost efficiencies                         Sales
                                                                                  ▪   Sustained growth despite COVID-19

                                                                                  ▪   Intercompany synergies

                          Wider Offering   PRODUCT
                                            Product   Customers                   ▪   Seasonal effects media and advertising space

                                           Growth
                                                                  Organic growth
                                                                  ▪ More sales people
                                                                  ▪ Wider offering for the same customers
VERVE GROUP: Driving Innovation in Adtech
Example: connecting the users across all / new media
DOOH + mobile
Launched 2019
Emerging Market Gen-Z CTV mobile
AdCast SDK
launched in 2019
VR Ads
Launched in 2020I. Introduction
I. Overview MGI
II. Market overview
III. Strategy
II. Gaming
I. Overview
II. Portfolio Impressions
III. Community Impressions
IV. Review 2019 an Q1 2020
V. Preview 2020
III. Media
I. What we do
II. Buy & Build
III. Outlook
IV. FinancialsRevenue and EBITDA development Adjusted
mEUR EBITDA margin
120 CAGR+43%
CAGR +43%
95%
Acquisitions of
100 Verve 97 85%
Acquisitions:
• WildTangent 84 75%
• ReachHero Historically
80 • AppLift
• PubNative 65%
▪ M&A as growth driver for building critical
55% mass to achieve economies of scale
60 Acquisition of
Acquisition of Trion Worlds
Mediakraft 45%
Acquisition of 42 45
Aeria Games 39
40 35%
Acquisition of
Looki 21
30%
18
Going forward
20 25%
15 25% 22%
20 20% 20%
18% 13 ▪ Organic growth will become a key growth
7 11 15%
4 driver, as acquisitions will gradually become
10% 2 smaller in relation to total revenue
0 5%
2014A 2015A 2016A 2017A 2018A 2019A Q1 2020 LTM
Revenue Gamigo Revenue MGI Adjusted EBITDA* Gamigo
Adjusted EBITDA* MGI Adjusted EBITDA margin*
* EBITDA adjusted for one time, M&A and financing costs
* gamigo was acquired by MGI in May 2018, financial development includes gamigo pro forma figures from 2014 – 04/2018Segment performance
FY 2019 (in kEUR)
Net revenues Revenue EBITDA EBITDA
43.132
12.621
40.761
51% 81%
19%
49%
2.921
Gaming Media Gaming Media Gaming Media Gaming MediaRevenue by region
Q1 2020 revenue by region MGI’s Main Markets
2%
5%
6%
36%
50%
Europe North America South America Asia RoWDiversified revenues
2019 Group Revenue 2019 Media Revenue
Rift* Grand Fantasia Shaiya*
Aura Kingdom 2% 2% 1%
Defiance*
3%
1%
Fiesta*
3% Performance Marketing
(Desktop)
Desert Operations* 10%
4%
Arche Age Unchained
5% Influencer Marketing
28%
Media Performance Marketing
ArcheAge Hiram (mobile)
49%
8% 32%
Trove*
8% SaaS
30%
Casual Games and
Other
14%Games revenue split by device and region
Games revenue Distribution channel Top 10 countries by
Q1 2020 by device games Q1 2020 revenues Q1 2020
1% 1 USA
10% 12%
External
12% 2 Germany
3 France
4 UK
5 Canada
Owned
88%
6 Brazil
7 Australia
78% The
8
Netherlands
9 Spain
Browser Client Mobile Console Owned External
10 Russia
PC Client is the biggest vertical with Top 3 countries accounts
Strong own distribution channels
strong recurring revenues due to for 82% of the gaming
leverage profitability
social communities in MMO Games revenuesRecurring gaming revenues for 5+ years
Desert Operations Global Deutschland-Spielt Fiesta Online Europe
85% 76%
63%
6%
2% 4% 9% 8% 10% 12% 11% 13%
1 Year 1-3 Years 3-5 Years > 5 Years 1 Year 1-3 Years 3-5 Years > 5 Years 1 Year 1-3 Years 3-5 Years > 5 Years
Last Chaos North America Last Chaos Europe Fiesta Online North America
57%
60% 58%
19% 20% 19%
13% 10% 15%
10% 11% 9%
1 Year 1-3 Years 3-5 Years > 5 Years 1 Year 1-3 Years 3-5 Years > 5 Years 1 Year 1-3 Years 3-5 Years > 5 YearsLicensed vs owned revenue
Increasing focus on licensed games
70%
60%
50%
40%
30%
20%
10%
0%
Q1-19 Q2-19 Q3-19 Q4-19 Q1-20
Licensed Owned
MGI’s launch strategy to accelerate organic growth is based on licensed games like ArcheAge Unchained to avoid development riskConsolidated balance sheet
31 Dec 31 Dec 31 Mar
EUR 000's Q1 2020 Highlights
2018 2019 2020
Intangible assets 204,142 233,207 253,466 - Intangibles increased mainly from
Property, plant and equipment 4,189 3,521 4,267
the acquisitions
- Trade receivables increased due
Financial assets and other assets 11,712 19,864 24,409
to revenue growth, partly by M&A
Long-term assets 220,043 256,593 282,143
- Cash position has been reduced
Trade and other receivables 11,803 22,872 45,606
compared to 2019 due to the
Cash and cash equivalents 4,447 32,984 12,950 buyout of gamigo minorities and
Short-term assets 16,250 55,857 58,556 the Verve acquisition in Q1 2020
Total assets 236,293 312,449 340,699 - Non-controlling interest
decreased due to the minority
Equity attributable to shareholders of the parent company 67,220 98,068 148,511 buyout in Q1 2020
Non-controlling interest 91,320 70,490 2,664 - Long-term liabilities increased
Total Equity 158,540 168,558 151,175 due to MGI bond issues and credit
lines for M&A, the acquisition of
Long-term liabilities 53,395 89,347 106,857 the gamigo shares
Short-term liabilities 24,358 54,544 82,667 - Short Term liabilities increased
Total liabilities and equity 236,293 312,449 340,699 stronger than receivables due to a
negative working capital and a
obligation towards the former
Equity Ratio 67% 54% 44% gamigo shareholdersConsolidated cash flow statement
Operating cash flow Capital expenditure
25.000 30.000
24.862
19.594 25.000
20.000
16.200
20.000
15.000
15.000 14.113
13.070
10.000
6.943 10.000
6.551 6.936
4.394 3.801
5.000 5.000
1.393 2.042
1.184
314
0 0
2014 2015 2016 2017 2018 2019 Q1 2020 2014 2015 2016 2017 2018 2019 Q1 2020
LTM LTM
Maintenance capex Expansion capex
• Free Cashflow: Despite 5 M&A Transactions and further
• +135% increase in operating cashflow in 2019 with investments into the games MGI generated 3.1 million free
strong further growth in Q1 2020 cashflow in 2019
• EUR 19.6 million operating cash flow In Q1 2020 and • Expansion capex in LTM Q1 2020: The Verve M&A
limited maintenance cashflow of EUR 4.1 million leads to transactions as well as investments into the media
strong cash conversion platform led to an increase in Q1 2020 while also operating
cashflow increased by EUR 3.4 millionLeverage development (2014 – Q1 2020)
Conservative credit metrics with a net leverage of 2.1x to reported EBITDA
Q1 2020 Highlights
Net interest bearing debt, EURk • Tap Issue MGI Leverage, x
Bond (EUR 5m)
80.000
• UniCredit Loan - Net Debt increased to EUR 72mn due to
Net interest bearing debt (EUR 10m) 71.775 gamigo buyout and further M&A
70.000 26,00x
Net IBD / reported EBITDA - EUR 10mn UniCredit term-loan drawn
• Capital Increase
(EUR 9m) for minority buyout of gamigo AG
60.000 • Tap Issue gamigo
Bond (EUR 18m) - EUR 5mn Tap Issue of the MGI Bond
• Issue of MGI Bond 21,00x
50.000 (15m EUR)
2019 Highlights
16,00x
40.000 Issue of Nasdaq
Issue of
gamigo Bond 34.911 - EUR 9mn Capital increase with Hauck &
UniCredit Loan
Issue of German (EUR 32m) Aufhäuser
(EUR 17m)
30.000 bond in 2013
(EUR 12m) 25.210 11,00x
- EUR 15mn MGI bond issue with a
20.453 20.430
20.000 framework of EUR 25mn with ICF
7,0
10.543
13.068
7,8 6,00x - EUR 18mn tap issue of the gamigo bond
10.000 with Pareto Securities AB
2,4 2,2
4,2
3,1
3,6 - EUR 12mn credit lines with UniCredit
0 1,00x and Commerzbank (undrawn)
2014 2015 2016 2017 2018 2019 Q1 2020 LTM
1) Until December 2017: Net IBD and EBITDA gamigo Group used for calculation
1) From December 2018 MGI Net IBD and reported EBITDA used for calculation; excluding Shareholder Loans starting from 2018 ffOutlook
COVID-19 has positive effects on MGI revenues
      Increased user activity as an effect of imposed restrictions
                                                                       Gaming
        • The pandemic and its corresponding lockdowns have boosted user engagement within video games
        • Online and mobile gaming market is growing as more people stay inside
        • People use online gaming to overcome social distancing

                                             New players*                                     MMO revenue growth*

                                               +43%                                                +50%
                                                                        Media
        • Despite the reduced demand for travel and retail advertisement, the media marketing budget of gaming media
          companies have been increased
        • Within May we saw within a few verticals like SaaS and Influencer Marketing revenue increases to levels before
          Corona

                                  MGI is perfectly positioned for strong growth in 2020 with accelerated M&A pipeline
*April compared to the average for January and February
Further execution of our buy & build growth story
Our target is to further continuing our 30+ % YoY organic and M&A growth
Low business risk focus
• Further predictable M&A; long-term revenues, predictable returns, in media and games
• Diversified revenue streams; several sustainable long-term revenue drivers
• No risky and capital-intense development of new games, no gambling games
Focus on attractive growth segments gaming and media
• Further focus on the synergetic, fast growth and good margin segments media and games
• Usage of technologies; optimize and utilize technical game changers
• Next to many attractive M&A targets also good opportunities for organic growth
Focus on synergies within and between games and media
• Platform philosophy: more volume = more efficiency; use of economies of scale
• Buy, Integrate, Build and Improve: concentration on increasing operational cash flows
• Using the synergies between media and games segment
Focus on financial targets
• Continuing to drive profitable growth, aiming at continuing 30+% YoY revenue growth
• But also focus on sustainability and stakeholder value
• Shares (MGI) and bonds (gamigo & MGI) to finance additional growth, keeping leverage at a healthy levelThank You
You can also read